Nonproportionality in the scintillation light yield of bismuth germanate
Abstract
We present measurements of nonproportionality in the scintillation light yield of bismuth germanate (BGO) for gamma-rays with energies between 6 keV and 662 keV. The scintillation light was read out by avalanche photodiodes (APDs) with both the BGO crystals and APDs operated at a temperature of 90 K. Data were obtained using radioisotope sources to illuminate both a single BGO crystal in a small test cryostat and a 12-element detector in a neutron radiative beta-decay experiment. In addition one datum was obtained in a 4.6 T magnetic field based on the bismuth K x-ray escape peak produced by a continuum of background gamma rays in this apparatus. These measurements and comparison to prior results were motivated by an experiment to study the radiative decay mode of the free neutron. The combination of data taken under different conditions yields a reasonably consistent picture for BGO nonproportionality that should be useful for researchers employing BGO detectors at low gamma ray energies.
keywords:
avalanche photodiode , bismuth germanate , nonproportionality , photon detection , radiative neutron decay1 Introduction
For an ideal scintillator, the number of optical photons produced by a gamma ray is linearly proportional to the energy deposited in the scintillator by the gamma ray. However, many scintillators exhibit nonproportionality in their response, especially for gamma-ray energies below 100 keV [1]. Nonproportionality is typically defined by the ratio of the scintillation yield for a particular energy deposit to the scintillation yield due to complete energy deposit for a 661.7 keV gamma ray from a 137Cs source. Measurements of nonproportionality in the response of bismuth germanate (BGO) in the following energy ranges have been reported: 4.5 keV to 662 keV [2], 6 keV to 1332 keV [3], 14 keV to 1330 keV [4], 60 keV to 662 keV [5], and 11 keV to 100 keV [1]. We report new measurements in the energy range from 6 keV to 662 keV.
Our measurements and comparison to prior results were motivated by an experiment to study the radiative decay mode of the free neutron. We reported the first observation of this process in a pilot experiment in which gamma-rays were detected by a single BGO crystal [6, 7]. To accurately test theoretical predictions for the photon energy spectrum, a higher precision experiment has been performed with a 12-element BGO detector [8]. Analysis of this experiment requires both Monte Carlo modeling of the energy deposit spectrum in the BGO crystals and understanding of the light yield from BGO. For our minimum detectable gamma ray energy deposit of 5 keV, the nonproportionality for BGO is an important source of uncertainty. Hence we performed measurements to determine the nonproportionality observed for our crystals, temperature, electronics, and other operating conditions. Our results were determined by both tests on a single BGO crystal with radioactive sources in a small test cryostat and with radioactive sources illuminating a 12-element detector in our apparatus for neutron beta-decay. In addition, the multi-element detector allowed for an additional measurement approach in which for any given crystal, a continuum of background gamma rays incident on the other 11 crystals produced escaping bismuth K x-rays that are detected by that given crystal. This particular determination of nonproportionality at the Bi K x-ray energy (mean of 78.7 keV) was performed in a magnetic field of 4.6 T. As in prior published studies, we determined the nonproportionality by comparing the center of the peak in the pulse height spectrum for a given gamma-ray energy deposit , , to that expected based on linear scaling from the center for the 661.7 keV gamma rays from a 137Cs source, . This definition applies for sufficiently high photoelectron yields so that a symmetric peak is obtained, which applies to all of our results except the 55Fe source results presented at the end of the paper. For this definition, the measured nonproportionality at energy expressed in percent is given by
| (1) |
Hence for a ideal scintillator, is unity for all energies. In Sec. 2, we describe the apparatus we employed for our measurements of nonproportionality. In addition to presenting our results in Sec. 3, we compare to previous reports. The combination of data taken under different conditions yields a consistent picture for BGO nonproportionality that should be useful for researchers employing BGO at low gamma ray energies. In Sec. 4 we present results for data obtained in the test cryostat with 6 keV x-rays from an 55Fe source and in Sec. 5 we summarize the paper.
2 Apparatus and measurements
2.1 Test cryostat measurements
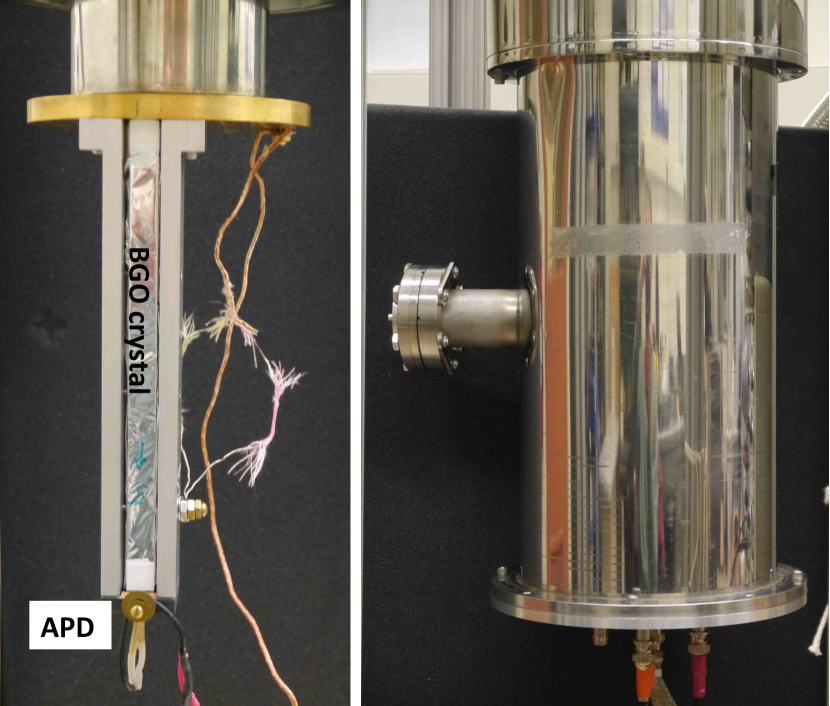
The test cryostat apparatus has been previously described in its use for studies of APD response [9]. For these nonproportionality studies, a 12 mm by 12 mm by 200 mm BGO crystal [10] coupled to an APD with an active area of 13.5 mm by 13.5 mm [11] was thermally sunk to the bottom of the inner reservoir of a cryostat (see Fig. 1). As discussed in Ref. [8], the opposite end of the BGO crystal was painted with reflective paint to improve the light collection efficiency. The long sides of the BGO crystal were covered by two layers of aluminized Mylar (total of 12.4 m Mylar and 0.065 m aluminum). The long-side regions near the end faces (12 mm) had additional layers of polytetrafluoroethlyene (PTFE) tape and aluminized Mylar for mechanical protection. (300 m PTFE and 6 m Mylar with 0.033 m aluminum). The cryostat’s vacuum jacket included a 3.5 cm diameter tube with a 7 cm diameter metal-sealed flange through which we illuminated the crystal about midway along its 200 mm length (see right side of Fig. 1). The light collection efficiency for gamma rays incident at different locations along this crystal can vary by 8 % from the center, with greater light collection efficiency obtained at either end of the crystal. This geometric effect is independent of the incident energy [8]. For these nonproportionality tests, the tubing for the vacuum port and the cryostat itself provided sufficient collimation to ensure that only the central region of the crystal was illuminated. For the highest energy (thus most penetrating) source, this was confirmed by a check with additional collimation that consisted of 1.2 cm thick, 2.8 cm tall copper pieces clamped in place above and below the horizontal 3.5 cm tube.
An oil-free turbomolecular pumping station was used to reduce the pressure in the chamber to a typical base pressure of on the order of 10-6 mbar. Upon filling the cryostat with liquid nitrogen, the typical pressure was on the order of 10-7 mbar. The APD signal was sent to a charge-sensitive preamplifier[12], followed by an amplifier set for a gain of 100 and a 6 s shaping time constant. The output of the shaping amplifier was registered by a multichannel analyzer (MCA)[13]. The lower level discriminator of the MCA was typically set slightly below the detector noise level at 10 channels, for a 1000-channel full range of 1000 keV. The APD was operated at a typical bias of 1380 V (40 V below breakdown). Using studies with a precision pulser, we found that our electronics for the test cryostat apparatus exhibited a slight nonlinearity that was consistent with an offset of one channel out of 1000 in the MCA. To determine the BGO nonproportionality, we corrected for this nonlinearity, which yielded a shift of 4.3 % for our lowest energy datum at 23.3 keV, decreasing to 1 % at 60 keV.
A thin polyimide window in the side port allowed the sources to be outside the cryostat vacuum space so they could be easily manipulated. The gamma-ray energies and sources employed in the test cryostat apparatus are listed in Table 1. A 137Cs source was used to provide the 662 keV reference. The mean energy deposit listed was determined for multiple-line emissions from the following components in keV, using the weighting percentages [14] in parentheses: 109Cd - 22.1, 25.1 (83.7*0.026, 17.7*0.078); 133Ba - 30.6, 31.0, 35.1, 35.9 (54, 100, 29, 7); 153Gd - 97.4, 103.2 (29, 21); and 57Co - 122.1, 136.5 (85.5, 10.7). For the low energy lines of the 109Cd source, the weighting included the factors shown to account for energy-dependent transmission through a 0.25 mm thick stainless steel cover on this particular source. To evaluate the nonproportionality, the pulse height spectrum for a given emission was fit with a single Gaussian, except for the multiple-line emissions noted above for which multiple-line Gaussians were employed. In the case of multiple-line emission, a single nonproportionality value was used for all the Gaussians and is listed for the mean energy deposit.
| [keV] | source | [%] |
|---|---|---|
| 23.3 | 109Cd | 73.4 (3.0) |
| 31.7 | 133Ba | 81.2 (2.5) |
| 59.5 | 241Am | 88.8 (1.0) |
| 81.0 | 133Ba | 91.6 (1.5) |
| 88.0 | 109Cd | 90.7 (1.0) |
| 99.8 | 153Gd | 86.5 (1.5) |
| 123.7 | 57Co | 89.2 (1.5) |
| 185.7 | 235U | 93.3 (2.0) |
| 661.7 | 137Cs | 100.0 |
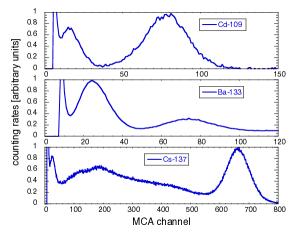
Fig. 2 shows the background-subtracted pulse height distributions for three of the seven sources. The background was determined by counting without the source. However, we found that the apparent threshold was higher with a source than without a source and it varied between sources. The response observed near the 10 keV threshold is due primarily to this source-related response, with a smaller contribution from imperfect background subtraction.
2.2 Measurements in neutron beta-decay apparatus
The apparatus for neutron beta-decay has been described elsewhere [6, 7, 8]. In brief, a neutron beam passes through the cylindrical bore of a superconducting magnet and gamma rays emitted during neutron beta decay are detected by an annular array of twelve 12 mm by 12 mm by 200 mm BGO crystals. As in the test dewar, each crystal is coupled to an APD with an active area of 13.5 mm by 13.5 mm. However, the electronic processing and spectrum analysis were different than that performed for the test dewar studies. The preamplifier output signals were directly fed into two 8-channel GaGe cards [15], which were set to digitize the signals with 40 ns per channel resolution in 80 s long traces. The decay time constant of the preamplifiers is 50 s. The amplitude of the digitized signals (see Ref. [8] for an example) were determined by fitting the signals to a template waveform. The template was a model waveform constructed from the average of preamplifier signals for gamma rays with a range of energies.
To test the detector response with radioactive sources, we employed a reentrant tube that allowed the sources to be outside the magnet’s vacuum chamber while illuminating the liquid nitrogen-cooled detector in a similar way as the photons from neutron decay. These tests were performed with the apparatus off the neutron beam line and with the magnetic field off. Pulse height spectra with 137Cs, 133Ba, 57Co, and 241Am sources are shown in Ref. [8], along with the results of modelling the detector response based, in part, on MCNP5 [18] predictions for the energy deposit spectrum in each BGO crystal. Nonproportionality was not included in the modeling. For this paper, we determined nonproportionality by comparing the location of emission lines from sources to those determined from Geant4 [16] and MCNP5 modelling with the assumption that the nonproportionality was 100 % for all energy deposits. A 137Cs source was used to provide the 662 keV reference line for lines from a 133Ba (nominally 31 keV, 81 keV, and 356 keV) and a 57Co source (122 keV and an X-ray escape peak at 43 keV).
An additional datum was obtained using x-ray escape from continuum background gamma-rays detected during operation on the neutron beam line. Although nonproportionality may depend weakly on the energy deposition process[17], in Ref. [4] the values obtained with escape peaks were the same within uncertainties as those obtained from direct sources. For a given BGO crystal, escape of Bi K x-rays from all the other crystals yields a peak at a mean energy of 78.7 keV. If the pulse height spectra from all the crystals are summed, this peak disappears because detection of the x-ray only occurs when the x-ray escaped from a different crystal. To improve the extraction of the peak location, we combined all the data from the 12 crystals but also subtracted off the summed spectrum. In this case, the magnetic field was 4.6 T. The gamma-ray energies and sources employed in the neutron radiative decay (RDK) apparatus are listed in Table 2.
| [keV] | source | [%] |
|---|---|---|
| 32.3 | 133Ba | 81.0 ( 2.0) |
| 42.7 | 57Co (escape) | 87.0 (2.0) |
| 78.7 | Bi escape | 94.0 (2.0) |
| 79.7 | 133Ba | 93.0 (1.0) |
| 121.9 | 57Co | 92.0 (1.0) |
| 356.0 | 133Ba | 98.6 (0.2) |
| 661.7 | 137Cs | 100.0 |
3 Results
Information on our results and those from past literature are summarized in Table 3. Whereas most results were obtained with a variety of radioisotopes, the work in Ref. [1] employed monochromatic gamma-ray beams from a synchrotron with resolutions varying from 2 eV at 9 keV to 20 eV at 100 keV. In Ref. [4] a photomultiplier tube (PMT) was used for measurements at room temperature and an APD [19] was used for measurements near liquid nitrogen temperature, with similar results being obtained for the nonproportionality. In addition to direct gamma ray lines, nonproportionality was determined using escape peaks, again with similar results.
| ID | source | [K] | opdet | crystal [mm] |
|---|---|---|---|---|
| [2], R | 295 | PMT | not stated | |
| [3], R | 295 | PMT | 10-20, 1-5 | |
| 1 | [4], R | 295 | PMT | 9, 4 or 9 |
| 2 | [4], R | 100 | APD | 9, 4 |
| 3 | [4], ER | 100 | APD | 9, 4 |
| [5], R | 3, 10, 30 | PMT | 20x10x5 | |
| 4 | [1], S | 295 | PMT | 5-10, 1 |
| 5 | test, R | 90 | APD | 12x12x200 |
| 6 | RDK, R | 90 | APD | 12x12x200 |
| 7 | RDK, E | 90 | APD | 12x12x200 |
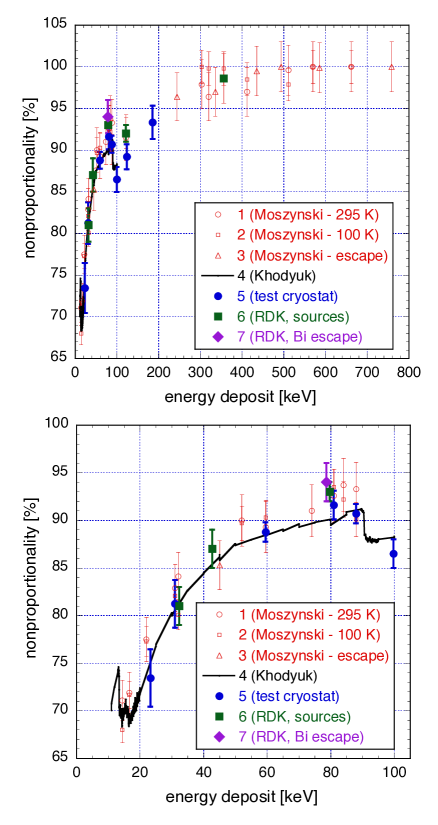
Fig. 3 shows data for nonproportionality in the response of bismuth germanate (BGO). Our results from the test cryostat and neutron beta-decay apparatus are listed in Tables 1 and 2, respectively. The combination of our data and prior published results include a variety of crystal sizes and sources, optical readout methods, temperatures, radiation sources, and analysis methods. Nevertheless, all of the results generally agree within a few percent. The results from our test cryostat data are closest to the results of Ref. [1], whereas the results from Ref. [4] and our RDK apparatus are typically a few percent higher, in particular just below the Bi K-edge at 90 keV. The single datum obtained at the bismuth K x-ray energy at a 4.6 T magnetic field is consistent within uncertainties with the nonproportionality values obtained at near zero magnetic field.
4 Nonproportionality at 6 keV
Ref. [2] reported a monotonic increase in with decreasing energy deposits in the range below the Bi L edge at 13 keV. Whereas the expected increase in the vicinity of the L-edge was reported in Refs. [1] and [3], was found to continue decreasing further below the edge region. This discrepancy motivated us to extend our nonproportionality measurements as low as possible in photon energy, hence we illuminated a 1 cm3 BGO crystal with 6 keV x-rays from an 55Fe source with an activity of 9 mCi. We obtained the best signal to noise ratio for observing these low amplitude pulses by operating the APD at between 5 V and 15 V below breakdown. For these data, the amplifier gain was 116, the shaping time constant was 6 s, and the lower level discriminator of the MCA was 13 channels, for a 1000-channel full range of 100 keV. Under these conditions, we obtained the background-subtracted pulse-height spectrum shown in Fig. 4. To avoid extremely low channels on the MCA, the nonproportionality was determined with respect to the 59.5 keV peak from the 241Am source and a correction was applied based on our nonproportionality value for this line. Because of the peak asymmetry, we fit the data to a gamma distribution[20] (see Fig. 4). Evaluation of the mean value yielded , which corresponds to 1.4 times greater than that would be obtained based on the observed peak location.
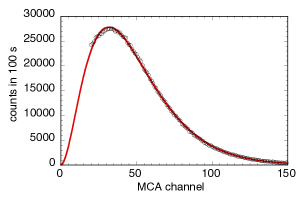
An asymmetric spectrum would be expected from Poisson statistics for a yield of only a few photoelectrons or less. In this case APD noise might mask the appearance of resolved peaks for specific photoelectron numbers. We modelled the pulse height spectrum using Poisson statistics and obtained the best results for a photoelectron yield of 2.6. However, an estimate of the photoelectron yield is not consistent with such a low value. For our large crystals we had estimated the photoelectron yield to be 1000 for 662 keV gamma rays[8]. For 6 keV and % this estimate corresponds to 9 photoelectrons, but the observed nonproportionality reduces the estimated yield to 6 photoelectrons. In addition, the small crystal employed for the 55Fe studies provided a higher yield. Hence the substantial asymmetry observed might indicate a pulse height distribution with a variance greater than its mean, due to APD noise. The impact of the value of the yield is on the probability of zero photoelectrons, which yields a small correction to the observed nonproportionality. Based on our expected yield the correction is negligible. However, we cannot discount the possibility that the yield is 2.6 photoelectrons, which would result in a probability of zero photoelectrons of =0.074. From these considerations we assign an asymmetric one-sigma uncertainty interval, hence our final value for the nonproportionality at 6.0 keV is . Our result falls midway between the values reported in Refs. [1] and [3]. In Ref. [3] it was suggested that the difference between their results and those of Ref. [2] could be related to the surface state of the investigated crystals.
5 Conclusions
Motivated by an experiment to study neutron radiative beta-decay, we performed new measurements of the nonproportionality in the light yield of BGO. For the energy range from 23 keV to 662 keV, these measurements were obtained in two different apparatus by illuminating long crystals at a temperature of 90 K with gamma rays from radioisotope sources and reading out the scintillation light with APDs. In addition one datum was obtained in a 4.6 T magnetic field based on the bismuth K x-ray escape peak produced by a continuum of background gamma rays. The combination of data taken under different conditions yields a reasonably consistent picture for BGO nonproportionality. An additional measurement using 6 keV X-rays from an 55Fe source was obtained with a small crystal. An asymmetric peak was observed, hence a value for the nonproportionality was obtained by extracting the mean value for a fit to a gamma distribution.
Acknowledgements
We thank I.V. Khodyuk and M. Moszynski for providing their numerical data for incorporation in the figures, and for their comments. We also thank Larry Lucas and Janna Shupe for loan of the 109Cd, 153Gd, and 235U sources. We acknowledge support from the Department of Energy, Office of Nuclear Physics, and the National Science Foundation.
References
- [1] I.V. Khodyuk and P. Dorenbos, IEEE Trans. Nucl. Science 59, 3320 (2012).
- [2] V.V. Averkiev, V.K. Lyapidevskii and G. Kh. Salakhutdinov, Pribory i Tekhnika Eksperienta 4, 80 (1990).
- [3] E.P. Sysoeva, O.V. Zelenskaya and E.V. Sysoeva, IEEE Trans. Nucl. Science 43, 1282 (1996).
- [4] M. Moszynski et al., IEEE Trans. Nucl. Science 51, 1074 (2004).
- [5] M.-A. Verdier, et al., Phys. Rev. B 84, 214306 (2011)
- [6] J.S. Nico et al., Nature 444, 1059-1062 (2006).
- [7] R.L. Cooper et al., Phys. Rev C 81, 035503 (2010).
- [8] R.L. Cooper et al., Nucl, Instrum. Meth. A 691, 64 (2012).
- [9] T.R. Gentile, M. Bales, U. Arp, B. Dong, and R. Farrell, Rev. Sci. Instrum. 83, 053105 (2012).
- [10] Rexon Components, Inc., 24500 Highpoint Rd., Beachwood, OH 44122. Certain trade names and company products are mentioned in the text or identified in an illustration in order to adequately specify the experimental procedure and equipment used. In no case does such identification imply recommendation or endorsement by the National Institute of Standards and Technology, nor does it imply that the products are necessarily the best available for the purpose.
- [11] Radiation Monitoring Devices, Inc., Watertown, MA 02472.
- [12] Model 2006, Canberra Industries, 800 Research Parkway, Meriden, Connecticut, 06450.
- [13] Quantum MCA8000, Princeton Gamma-Tech, Inc., C/N 863, Princeton, NJ 08542-0863.
- [14] http://www.nucleide.org/DDEP_WG/Nuclides/Cd-109_tables.pdf, and similarly for other sources.
- [15] Gage CompuScope 8289 (Octopus 12-bit CompuScope A/D card: 125 MS/s per channel, 8 channels, 128 MS memory), DynamicSignals LLC, 900 N. State St., Lockport, IL 60441.
- [16] S. Agostinelli et al., Nucl., Instrum. Meth. A 506 250 (2003).
- [17] I.V. Khodyuk, J.T.M. de Hass, and P. Dorenbos, IEEE Trans. Nucl. Science 57, 1175 (2010).
- [18] F. B. Brown, et al., A General Monte Carlo N-Particle Transport Code, Version 5 LA-UR-03-1987 (2003).
- [19] 16 mm diameter APD, Advanced Photonix, 1240 Avenida Acaso, Camarillo, CA 93012.
- [20] H.J. Gale and J.A.B. Gibson, J. Sci. Instrum. 43, 224 (1966).