Crystal growth kinetics in Lennard-Jones and Weeks-Chandler-Andersen systems along the solid-liquid coexistence line
Abstract
Kinetics of crystal-growth is investigated along the solid-liquid coexistence line for the (100), (110) and (111) orientations of the Lennard-Jones and Weeks-Chandler-Andersen fcc crystal-liquid interface, using non-equilibrium molecular dynamics simulations. A slowing down of the growth kinetics along the coexistence line is observed, which is mostly a temperature effect, with other quantities such as the melting pressure and liquid self-diffusion coefficient having a negligible impact. The growth kinetics of the two potentials become similar at large values of the melting temperature and pressure, when both resemble a purely repulsive soft-sphere potential. Classical models of crystallization from the melt are in reasonable qualitative agreement with our simulation data. Finally, several one-phase empirical melting/freezing rules are studied with respect to their validity along the coexistence line.
I Introduction
A central quantity for the understanding of crystallization processes from the undercooled liquid is the kinetic growth coefficient palberg2014 . The kinetic growth coefficient, , is defined as the constant of proportionality between the velocity with which the crystal-liquid interface moves and the interfacial undercooling, ,
| (1) |
with the melting temperature. Note that Eq. (1) is only expected to hold if the undercooling is sufficiently small. Magnitude and anisotropy of the kinetic growth coefficient play a dominant role in determining the morphology of the growing crystal bragard2002 ; langer1980 and are also essential parameters required for the continuum modelling of solidification processes bragard2002 .
Experimental measurements of the kinetic growth coefficient have been scarce, with the exception of a few studies on metallic systems willnecker_herlach89 ; rodway91 and white phosphorous (P4) glicksman67 . However, atomistic simulation techniques allen-tildesley87 ; binder2004 such as Molecular Dynamics (MD) provide detailed information about the microscopic structure and dynamics of the interface region. Thus, atomistic simulations can be used to test various analytical approaches to describe crystal growth such as the Wilson-Frenkel wilson1900 ; frenkel1932 and Broughton-Gilmer-Jackson jackson1982 ; jackson2002 model.
Different simulation techniques have been developed for the investigation of crystal growth kinetics jackson1982 ; jackson2002 ; broughton88 ; celestini2002 ; monk2002 ; hoyt-asta-karma2002 ; hoyt-asta-karma2003 ; hoyt-asta2002 ; amini2006 ; benet2014 ; turci-schilling2014 ; tepper-briels1997 ; briels2001 ; briels2002 . In the capillary fluctuation method monk2002 ; hoyt-asta-karma2002 ; hoyt-asta2002 ; hoyt-asta-karma2003 ; amini2006 ; benet2014 ; turci-schilling2014 , the kinetic growth coefficient is obtained from equilibrium MD simulations by analyzing the height fluctuations of the crystal-liquid interface at coexistence. Using this approach, has been computed for hard spheres amini2006 , metals hoyt-asta2002 , a Lennard-Jones system and the TIP4P/2005 water model benet2014 . A variation of the capillary fluctuation method has been proposed by Tepper and Briels tepper-briels1997 ; briels2001 ; briels2002 . In their approach, is extracted from the equilibrium fluctuations of the number of crystalline atoms in an inhomogeneous solid-liquid system.
Another widely used approach to obtain kinetic growth coefficients is the free solidification method (FSM) actamaterhoyt1999 ; hoyt-asta2002 which is based on non-equilibrium MD. Here, one simulates inhomogeneous systems where the crystal is separated from the liquid phase via two planar interfaces (two interfaces appear due to periodic boundary conditions). By monitoring the rate of change of the system’s volume with respect to time, the kinetic growth coefficient, , can be determined. This approach has been applied to various one- and two-component metals hoyt2004 ; hoyt-asta2002 ; kuhn2013 ; kerrache2008 ; xia2007 ; sunastahoyt2004 ; tymczak1990 ; gao2010 ; timan2009 ; timan2010 as well as Lennard-Jones systems huitema99 ; briels2001 . The estimated values of for metallic systems, obtained from FSM, have been shown to be in good agreement with those obtained for hard spheres from the capillary fluctuation method amini2006 .
For systems with a crystal face-centered cubic (fcc) phase, it has been suggested from the latter simulation studies that the diffusion-limited classical Wilson-Frenkel model of crystal growth has to be modified into a collision-limited growth model to explain the high crystal growth rates corresponding to the (100) orientation of the crystal-liquid interface. Moreover, the collision-limited growth model seems to be a good predictor of for the (110) interface of metallic systems hoyt-asta2002 , too. Only the (111) interface tends to follow the Wilson-Frenkel kinetics broughton88 .
Most of the above studies have been done under “ambient conditions”, i.e. at the melting temperature corresponding to zero pressure conditions. Little is known about the dependence of the kinetic growth coefficient on pressure and temperature along the coexistence line. In this work, we investigate the growth kinetics of the (100), (110), and (111) orientations of a fcc crystal-liquid interface for two different models, employing the FSM: (i) a force-shifted Lennard-Jones (fsLJ) potential and (ii) a purely repulsive Weeks-Chandler-Andersen (WCA) potential. For both models, systems at various pressures and temperatures along the coexistence line are studied. From the FSM simulations, the coexisting temperatures and pressures as well as the kinetic growth coefficients are obtained.
Our results indicate that the growth kinetics depends only weakly on pressure while it is significantly affected by a change of the melting temperature. For the fsLJ potential, there is an initial regime where the coexistence pressure changes by two orders of magnitude while the melting temperature remains essentially unchanged. In this regime, the kinetic growth coefficients are almost constant as a function of pressure. For both the fsLJ and the WCA models, however, an increasing melting temperature (with increasing the “melting” pressure ) is associated with a slowing-down of the growth kinetics. At high values of and , the kinetic growth coefficients in reduced units tend to reach asymptotic values which correspond to the ones found for hard spheres, though not identical. In our analysis, we discuss to what extent the collision-limited crystal growth model of Broughton, Gilmer, and Jackson (BGJ) is valid and relate the growth kinetics to the self-diffusion coefficient of the liquid, the entropy of fusion and the liquid and crystal coexistence densities. In this context, we also discuss empirical rules of melting and freezing loewen1994 ; monson2000 , namely the Lindemann lindemann1910 , the Raveché, Mountain and Streett rms1974 and the Hansen-Verlet hv6970 criterion.
In the next Section, we describe the two interaction potentials considered in this work. In Section III, we outline the FSM, followed by Section IV on the simulation details. The results are presented in Section V, and finally we come to the conclusions in Section VI.
II Interaction Potentials
Simulations are carried our for two different models that are derived from the Lennard-Jones (LJ) potential. This potential describes the interaction between two particles separated by a distance by the function
| (2) |
with and being two parameters setting respectively the microscopic energy and length scales for two neighboring particles.
The first model considered in this work is a force-shifted Lennard-Jones (fsLJ) model, defined by
| (3) |
with . The cut-off of the potential is set to .
The second model is a Weeks-Chandler-Andersen (WCA) potential, i.e. a LJ potential which is cut off at its minimum at and shifted to zero,
| (4) |
Thus, the WCA model is a purely repulsive potential. In the fsLJ model, only at very high coexistence pressures the repulsive part is expected to dominate kinetic properties and phase behavior and so we can study how attractions between the particles affect crystal growth along the coexistence line going from low to high coexistence pressures.
In the following, energies and lengths are expressed in units of and , respectively, and the masses of the particles are set to . Thus, thermal energy, (with the Boltzmann constant and the temperature), and pressure, , are expressed in units of and , respectively. Time is measured in units of , while the kinetic growth coefficient is reported in units of .
III Free solidification method (FSM)
A crystal in contact with its melt at a temperature below (above) the melting temperature (cf. Fig. 1) will grow (shrink) until the entire system crystallizes (melts). The FSM actamaterhoyt1999 ; hoyt-asta2002 ; kerrache2008 ; timan2009 ; timan2010 is an approach to compute the crystal growth (or melting) rate as well as the coexistence temperature at a given pressure . The starting point are standard isothermal-isobaric MD simulations at various temperatures and at a particular value of the pressure, , keeping the number of particles constant. From these simulations, the temperature dependence of the density of the crystal (in our case a fcc crystal) as well as the melt are determined. Gradually increasing the temperature of the crystal leads to melting at a temperature while the subsequent gradual reduction of the temperature leads to re-crystallization at a different temperature . Thus, hysteresis is observed, i.e. the heating and cooling curves do not follow the same path. Such “heating-cooling” plots indicate the region in which the melting temperature, , is located.
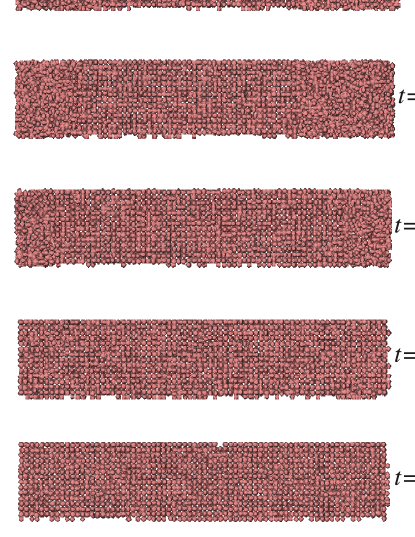
Now, the FSM scheme consists of the following steps kerrache2008 ; timan2009 ; timan2010 : First, atoms are arranged on a fcc lattice in an elongated simulation box of size with the desired orientation of the crystal pointing in direction and the length of the system along the direction being approximately five times that in and directions (cf. Fig. 1). At each temperature and pressure, the density of the fcc crystal is obtained from the aforementioned heating-cooling plots (Fig. 2). Then, at a given temperature and pressure the system is equilibrated in a ensemble sunastahoyt2004 (with , , and respectively the pressures along the , and directions) in the range in which hysteresis is observed. The reason for carrying out simulations in the constant pressure ensemble is to ensure that the crystal is free of any residual stress along the three Cartesian axes. Moreover, for maintaining constant pressure along the different Cartesian axes, simulations are carried out in the ensemble rather than in the ensemble since the simulation box is a cuboid with unequal lengths along the different Cartesian axes. After equilibration is reached, the average length of the simulation box in the and directions are determined.
After relaxing the crystal sample in the first step, two-thirds of the atoms in the middle of the box are fixed and the rest of the system is heated up to a high temperature, , to eventually melt it. In this step, the lengths of the simulation box in the and directions are fixed to the average lengths obtained from the previous ensemble run, and the simulation is carried out in the ensemble by varying only the length (i.e., maintaining constant pressure ). Here, corresponds to the area of the system (). In the third step, the temperature of the whole system is set back to the initial temperature in which the crystal was prepared, with the atoms in the middle of the region still fixed. This simulation in the ensemble runs for a short period, just long enough to cool the melted region to the desired temperature. Finally, all the particles are allowed to move and the simulation in the ensemble is continued.
In the steady-state, the length of the system, , varies linearly with time and one obtains the change of per unit time, , from the slope of . From and a mass balance equation, it is straightforward to obtain the interface velocity via huitema99
| (5) |
with and the bulk densities of the solid and liquid phase, respectively. Close to the melting temperature the interface velocity varies linearly with temperature. From a linear fit to the temperature dependence of the interface velocity, the kinetic growth coefficient as well as the melting temperature are obtained, cf. Eq. (1).
IV Simulation Details
To integrate the equations of motion, the velocity Verlet algorithm allen-tildesley87 is used. Pressure is kept constant by coupling the system to an Andersen barostat allen-tildesley87 ; andersen80 ; sunastahoyt2004 . The coupling parameter of the barostat (the mass of the piston) is set to for the runs to determine the “heating-cooling” curves and to for all the FSM simulations in the and the ensemble. To keep the temperature constant, the system is coupled to a stochastic heat bath by assigning every 200 time steps random velocities to the atoms sampled from a Maxwell-Boltzmann distribution. The reduced time step is taken to be for all the simulations.
To compute the density of the crystalline and liquid phases at coexistence and to determine the density-temperature hysteresis curves, simulations with particles are carried out at various values of the pressure in the interval for the fsLJ potential and in the interval for the WCA potential. Initially, the particles are placed on a fcc lattice in a cubic cell of dimensions . We equilibrate the system for 25000 time steps and then perform production runs for another 25000 steps. From the data collected during the production runs, the volume of the system is determined to obtain the equilibrium density. The temperature of the system is raised by a small step and the above procedure is repeated to obtain the density for the next higher temperature. This process is continued until the crystal melts to form the liquid phase. The same procedure is followed to obtain the bulk liquid equilibrium density by gradually lowering the temperature of the system in small steps and calculating the equilibrium density at each temperature.
For the FSM simulations of the fsLJ model, particles are placed in an elongated box of size . Systems containing , and particles are considered respectively for the (100), (110), and (111) orientation of the fcc lattice in direction. With the same relative lengths of the simulation box along the , and directions, simulations with , and particles are carried out for the WCA model along the (100), (110), and (111) orientation, respectively. At several temperatures in the hysteresis region (see Sec. III) crystals are equilibrated for time-steps in the ensemble. From the last time-steps, the average lengths of the simulation cell along the and directions is determined. and are fixed to this value to carry out simulations for the next step in the ensemble.
In the second step, the crystalline particles in the middle one-third of the box are fixed, while particles in the remaining region are equilibrated at a high temperature for time steps to melt the system. Then, keeping the crystalline region fixed, the liquid is cooled to the desired temperature in a short run of time steps. Finally, all the particles are allowed to move, performing a run over time steps from which the interface velocity is determined. Statistical errors were determined from independent realizations.
V Results
V.1 Heating-cooling plots
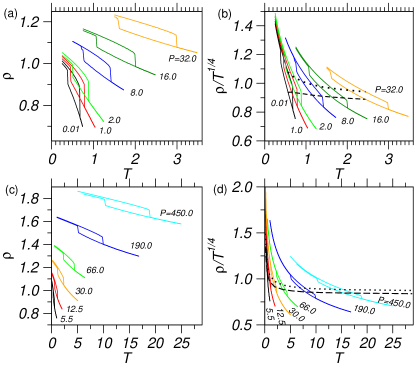
Figures 2a and c show heating-cooling plots of the density at different pressures for the fsLJ and the WCA model, respectively. With increasing pressure, hysteresis is observed in a larger temperature interval. As we shall see below (see Sect. V.5), this is associated with a gradual slowing down of crystal growth kinetics. By scaling the density by a factor , all the curves corresponding to the various pressures tend to fall in a similar range along the -axis (see Fig. 2b and d). Also, the coexistence values of the quantity for the crystal and liquid asymptotically reach a similar constant value for both the fsLJ and WCA model, indicating that the phase behavior of both systems at high temperature and pressure is similar. We discuss this point in more detail in Sect. V.3.
V.2 Interface velocity
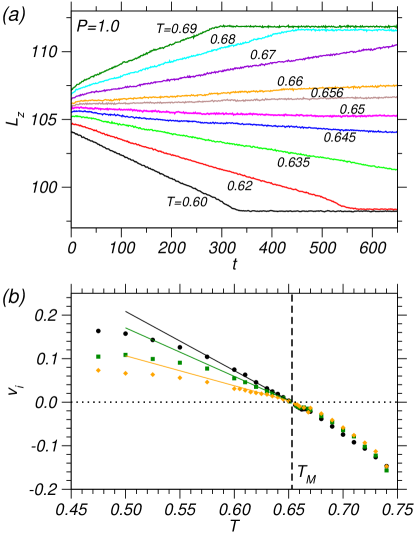
The behavior of the crystal-melt interface depends on the temperature at which it is simulated. The crystal will grow below the melting temperature while above it, melting will occur. Since the crystal density is higher than the melt, the length of the system along which the interface is oriented will increase during melting and shrink during crystallization. In Fig. 3a, we plot the length of the system along the direction, , versus time for different temperatures corresponding to the fsLJ potential at . The data is averaged over independent realizations. Figure 3a shows that after a transient period at the beginning, varies linearly with time when the steady state is reached and ultimately reaches a constant at long times, when the whole system has either crystallized or melted. Just prior to this, we find a non-linear regime where the crystallization and melting are much faster than in the linear steady-state regime, because one of the phases has shrunk to such a small size that the two interfaces interact with each other (see the two bottom-most curves in Fig. 3a).
Figure 3b shows as a function of temperature for the three different crystal orientations i.e. , and at . The melting temperature is dictated by thermodynamics and is expected to be identical for all crystal orientations. At small undercoolings, the system is in the linear response regime. Hence, around , the simulation data for can be fitted by a linear law , with at . From Fig. 3b, we find that for the (100) crystal orientation, vanishes around . For the (110) and (111) crystal orientations, approaches zero respectively at and .
V.3 Thermodynamic properties at coexistence
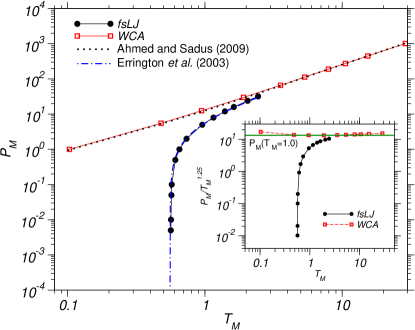
The FSM simulations were carried out at different pressures to obtain the respective melting temperatures. Figure 4 shows the phase diagram of the fsLJ system and the WCA potential along the plane. Our simulation data corresponding to the coexistence conditions is in very good agreement with that obtained previously using Gibbs-Duhem integration from a known melting temperature and pressure at a single coexistence point for the fsLJ torquato2003 and the WCA model sadus2009 . At low pressures, there is a significant difference between the coexistence curves of the two potentials on account of the different roles played by the term. Due to this attractive part of the fsLJ potential, the particles sit at the potential well at low pressures () and as a result the melting temperature stays almost the same even when the potential changes by two orders of magnitude (from to ). For , the melting temperature increases rapidly with the pressure as the repulsive part of the potential becomes dominant while the attractive term plays less and less of a role in determining the phase behavior. One can clearly identify these two regimes in the coexistence line corresponding to the fsLJ potential as shown in Fig. 4.
Figure 4 also shows that the coexistence curve of the WCA model is almost a straight continuous line in the whole considered range of melting temperatures. Moreover, at high values of the coexistence line of the fsLJ model seems to become identical to that of the WCA model. This behavior is expected because at high temperatures the phase behavior of both models is dominated by the repulsive interactions, in agreement with the findings in Refs. hoover1971 ; sadus2009 ; ahmad-sadus2009 .
It is interesting, therefore, to compare the coexistence behavior of the fsLJ and the WCA potentials with the inverse 12th-power soft-sphere potential, (). Inverse-power law potentials are fully determined by one parameter (here ) and coexistence is fully specified by a single quantity, hansen-liquid-theory2006 ; laird-davidchack2005 . As a consequence, the reduced melting pressure shows a power-law scaling with respect to the reduced melting temperature, . For , this relation reduces to , where is the pressure corresponding to . In the inset of Fig. 4, we plot the quantity as a function of the melting temperature for both the WCA and the fsLJ model. In case of the WCA potential (), this relation is satisfied for . For the fsLJ potential, at larger melting temperatures, this quantity tends to the same value as in case of the WCA potential i.e. . However, the melting temperature corresponding to this value of the pressure is around , indicating that for (or ) the phase behavior of the fsLJ potential approaches that of the purely repulsive inverse 12th-power soft-sphere potential.
In Fig. 2b and d, we have plotted the scaled density as a function of temperature that tends to approach a constant value in the high-temperature limit that corresponds to that of a soft-sphere potential. For the latter potential, the estimate of Hoover et al. hoover1971 for the crystal (liquid) coexistence value of is (), while for the fsLJ and WCA interaction potentials the coexistence values of the crystal (liquid) at the highest pressures considered are () and () at and , respectively. Thus, also with respect to the scaled density both the fsLJ and the WCA model approach the value obtained for the soft-sphere potential.
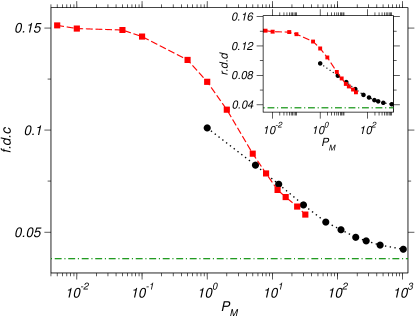
Along the coexistence line, we now discuss further thermodynamic properties, namely the fractional density change at freezing, , also known as the miscibility gap, the relative density difference at freezing, , and the entropy of fusion . Here, is the latent heat as obtained from the difference of the enthalpies of liquid and crystal at coexistence.
In Fig. 5, we show the ratios f.d.c. and r.d.d. (inset) as a function of the melting pressure for the two interaction potentials. Both the miscibility gap and the relative density difference at freezing decrease along the coexistence line. Data corresponding to the WCA potential are in good qualitative agreement with those obtained in an earlier work sadus2009 but the magnitudes of the f.d.c. and r.d.d. reported by us are slightly higher. At larger pressures the fsLJ data tends to attain similar values as those of the WCA potential though somewhat lower. The f.d.c. and r.d.d. ratios corresponding to the potential are and hoover1971 , respectively (indicated by the horizontal lines in Fig. 5). Figure 5 clearly shows that at large pressures both the WCA and fsLJ data converge to the same values as those of the potential.
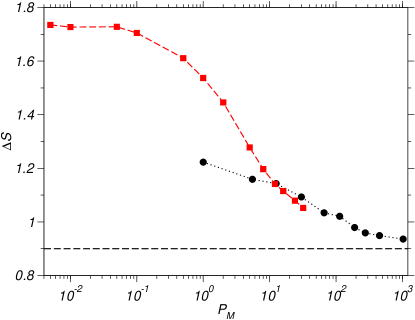
The entropy of fusion (see Fig. 6) decreases with increasing temperature and pressure for both interaction potentials in qualitative agreement with a previous work sadus2009 . This indicates that at lower melting temperatures there is a greater positional ordering of the solid phase as compared to that at higher temperatures. At the lower pressures, the entropy of fusion for the fsLJ potential approaches a constant value as the melting temperature changes little. At larger pressures, the values of converge to that of the potential, hoover1971 .
We have seen that with respect to the thermodynamic properties, the fsLJ and the WCA model become similar in the high-temperature limit where, in both cases, repulsive interactions dominate the phase behavior. Below, we show (Sect. V.5) that the crystal growth kinetics of the fsLJ and the WCA model also becomes similar at high temperatures/pressures.
V.4 Self-diffusion coefficient of the liquid
One of the classical models of crystal growth kinetics is the Wilson-Frenkel model wilson1900 ; frenkel1932 which describes crystal growth by an activated process, limited by the self-diffusion of the atoms in the liquid phase. Thus, this model predicts that the diffusion dynamics of the liquid strongly affects the growth kinetics. Therefore, we now analyze the self-diffusion coefficient of the liquid phase for temperatures and pressures along the coexistence line.
The self-diffusion coefficient, is computed from the mean-squared displacement of a tagged particle binder2004 , (with the position of the tagged particle at time ), via the Einstein relation, .
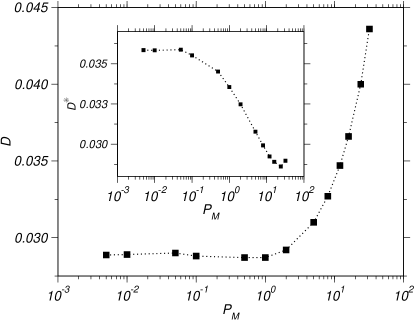
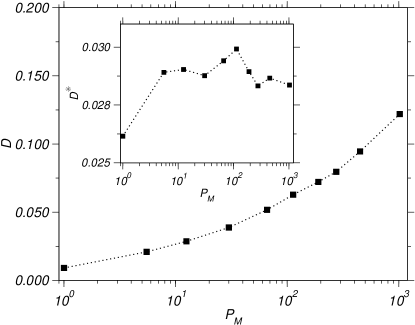
In Figs. 7 and 8, we display along the coexistence line for the fsLJ and the WCA model, respectively. As is evident from Fig. 7, for the fsLJ model remains unchanged in the pressure range , where the corresponding melting temperature changes very little. However, when the melting temperature significantly increases by about a factor of three the diffusion coefficient also increases by about 50%. For the WCA potential (Fig. 8), the diffusion constant increases with increasing pressure due to the change in all along the coexistence line. Overall, the increase in diffusion coefficient with increasing melting pressures (provided increases), might indicate that the growth kinetics become faster along the coexistence line. However, as reported below in Sect. V.5, the kinetic growth coefficient decreases at high pressures, indicating that the self-diffusion coefficient of the liquid does not play a significant role in determining the growth kinetics.
For comparing the fsLJ and WCA potentials, the scaled diffusion constant, (with being a natural MD scale), is shown in the insets of Figs. 7 and 8. for the fsLJ potential decreases with increasing pressure and approaches a value between and at large pressures. In case of the WCA potential, slightly increases at low pressures and then, in the pressure range , remains almost unchanged, also at a value between and . Thus, also with respect to the scaled self-diffusion coefficient similar values are obtained for the fsLJ and the WCA model at high temperatures/pressures.
V.5 Crystal growth kinetics
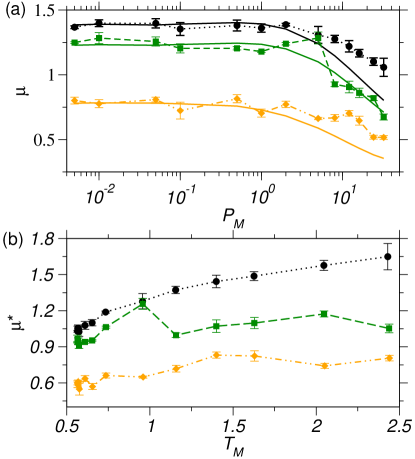
The kinetic growth coefficient is extracted from the slope of the linear fit to the interfacial velocity at small undercoolings. Our results for both the fsLJ and WCA model confirm observations of prior studies amini2006 ; hoyt-asta2002 regarding the magnitude of for the different orientations: . The data for the three different crystal orientations along the coexistence line are reported in Figs. 9a and 10a for the fsLJ and WCA model, respectively. For the fsLJ model, remains essentially constant in the pressure range where the melting temperature changes only weakly. For larger pressures, when the melting temperature increases rather sharply, the kinetic growth coefficient decreases, indicating this decrease to be of a thermal origin. Similarly, in case of the WCA potential, decreases with increasing pressure reflecting the variation of the melting temperature with respect to the coexistence pressure (Fig. 10a). At a pressure of , the values of for both models are already in good quantitative agreement.
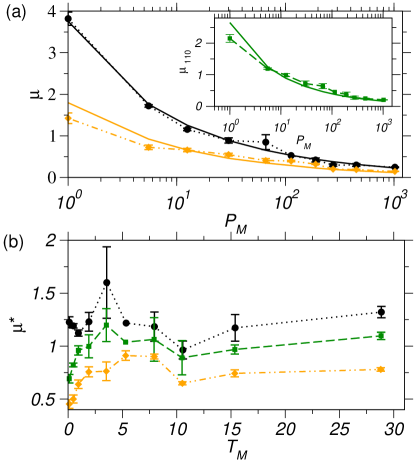
To compare the values of for the fsLJ and the WCA model with those of the hard sphere system, we have also computed the reduced coefficient, or, with , . It is to be noted that the phase behavior of hard spheres is purely entropy-driven and interfacial properties are solely determined by packing effects. In Figs. 9b and 10b, as a function of the melting temperature is shown for the fsLJ and the WCA model, respectively. In agreement with a recent simulation study pedersen2014 , for both models tends to approach a constant value in the high temperature limit. The hard-sphere values of , as obtained by Amini and Laird amini2006 , are , and for the (100), (110), and (111) orientation, respectively. The asymptotic values of the fsLJ and the WCA model in the high pressure/high temperature limit are close to these values, though not identical.
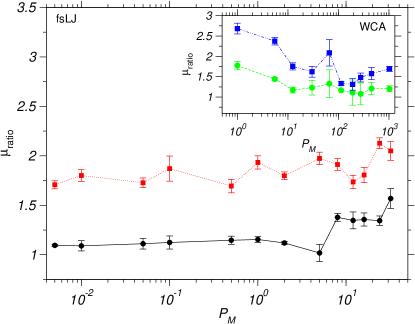
The ratios and reported in Ref. amini2006 for hard spheres are and , respectively. For a LJ system, a previous simulation study pedersen2014 reports the values for and for at . In Fig. 11, we plot and as a function of for the fsLJ model and in the inset for the WCA model. For the fsLJ model, we find that both ratios are lower than the hard-sphere and LJ values in the pressure range where the melting temperature hardly changes. At higher values of the melting pressure, both ratios tend to similar values as for the hard-sphere and the LJ system. The ratios and for the WCA model decrease respectively from high values of and at low pressures and then saturate at values slightly smaller than those for the hard-sphere and the LJ system. These results indicate that the specific nature of the intermolecular potential has a substantial effect on the magnitude and anisotropy of and cannot be ignored, even though entropic effects play a dominant role.
Now, we address the question to what extent classical models of crystal growth can predict the dependence of the interfacial velocity on undercooling. The WF model wilson1900 ; frenkel1932 assumes that crystal growth is an activated process which is limited by the self-diffusion of the atoms in the liquid phase. This model leads to the following expression for jackson1982 ; jackson2002 ; hoyt-asta-karma2002 :
| (6) |
where, is the self-diffusion constant of the liquid atoms, the interplanar spacing between adjacent crystalline layers, the mean free path of a liquid atom, the probability of a liquid atom to be attached to a crystal lattice site at the interface, and and respectively the differences in entropy and Gibbs free energy per particle between the crystal and liquid phases. The temperature is assumed to be below the melting temperature, . The thermodynamic driving force for the crystallization is described by the term .
The WF model has been shown to predict the crystallization rates of binary (metallic) systems fairly well jackson1982 ; nascimento2004 . For one-component systems, however, the WF model tends to underestimate kinetic growth coefficients. Therefore, Broughton, Gilmer and Jackson (BGJ) et al. jackson1982 ; hoyt-asta-karma2002 predicted an alternative collision-limited model,
| (7) |
The BGJ model differs from the WF model in that the prefactor depending on the self-diffusion constant of the liquid atoms is replaced by a term containing their thermal velocity such that in the BGJ model the limiting factor for crystal growth is the thermal velocity with which the atoms collide rather than the self-diffusion coefficient. Various works have compared these two theories to simulation and experimental results and it has been observed that the collision-limited model is an accurate predictor of (subject to an appropriate value for the fit parameter ), at least for the (100) and (110) orientation of one-component fcc systems hoyt-asta2002 ; sunastahoyt2004 ; celestini2002 choosing the fit parameters jackson2002 and (with the lattice constant). In simulations of LJ systems jackson1982 ; jackson2002 , however, the WF model has been shown to describe the interface velocity corresponding to the (111) orientation reasonably well.
At small undercoolings, is proportional to the undercooling, , and the entropy difference can be taken as independent of temperature. Hence, close to coexistence and . Inserting these expressions in Eqs. (6) and (7) and using the definition of , Eq. (1), one obtains the following expressions for corresponding to the WF model,
| (8) |
and the BGJ model,
| (9) |
Note that since we consider small undercoolings, we can replace the temperature in Eqs. (8) and (9) by the melting temperature .
Now, we compare the above predictions for with the simulation data along the coexistence line. For both the fsLJ and the WCA model, in Eq. (9) is chosen to be for comparison with results corresponding to the (100) and (110) crystal-liquid interfaces. The parameter is chosen to be (0.28) and (0.29) for the (100) and (110) orientations of the fsLJ (WCA) model, respectively. To compare the WF model, Eq. (8), to the simulation results for the (111) orientation of the fsLJ and the WCA model, the parameters and are chosen to be and , respectively. Note that the same values of these parameters are used for each point along the coexistence line.
Figures 9a and 10a show reasonable agreement between theory and simulation. Using the classical models, the decrease of the kinetic growth coefficient with increasing melting temperature can be understood in terms of the decrease of the thermodynamic driving force along the coexistence line, described by the term . The decrease of this term with increasing overpowers the increase of the remaining terms containing and leading to slower growth kinetics.
It is to be noted that the values of in Eq. (9), corresponding to the (100) and (110) orientations of the two potentials that leads to the best agreement with the simulation data, are very close, indicating that this parameter is independent of the orientation. In Eq. (9, corresponding to the different orientations are proportional to the interplanar spacing yielding the value . As shown in Fig. 11, results from simulations are in reasonable agreement with this value.
V.6 Freezing and melting rules
The FSM method yields simultaneously the coexistence line and the kinetic growth coefficient, . However, computational approaches such as the capillary fluctuation method monk2002 ; hoyt-asta-karma2002 ; hoyt-asta2002 ; hoyt-asta-karma2003 ; amini2006 ; benet2014 or the equilibrium fluctuation technique tepper-briels1997 ; briels2001 ; briels2002 require an accurate determination of the coexistence conditions for obtaining precise estimates of the kinetic growth coefficient. Computing the coexistence conditions at several state points to obtain an accurate phase diagram, is computationally demanding. To reduce the computational effort, it would be helpful to have a prior idea of the crystal-liquid phase coexistence region, to avoid carrying out fruitless simulations at regions far away from the phase boundaries. To this end, there have been a number of attempts to identify certain empirical rules obeyed by the individual phases at melting and freezing loewen1994 ; monson2000 . How accurately such rules are obeyed depends on the nature of the potential and the coexistence conditions. Here, we test the validity of three empirical rules for the two models studied in this work: (i) Lindemann’s melting rule lindemann1910 , (ii) the Raveché-Mountain-Streett freezing rule rms1974 and (iii) the Hansen-Verlet freezing criterion hv6970 .
According to Lindemann’s melting rule, a crystal melts when the root mean square displacement of crystalline atoms around their ideal lattice positions is approximately of the nearest-neighbour distance, . To test this rule, we compute the Lindemann ratio , given by
| (10) |
The values of , as reported from previous studies for different model potentials, range roughly from 0.1 to 0.2 ahmad-sadus2009 ; saija2006 ; sadus2009 ; agrawal-kofke1995 .
To compute and also the quantities involved in the other empirical rules, we have carried out simulations of the bulk crystal and liquid at the appropriate coexistence temperature and pressure for systems consisting of and particles for the WCA and the fsLJ model, respectively.
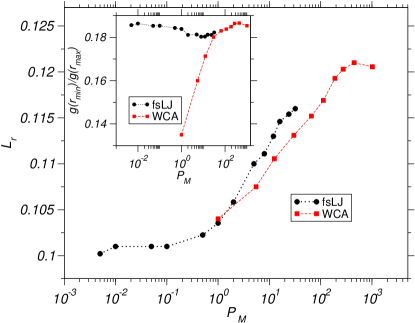
Figure 12 shows the variation of along the coexistence line. For both models, it increases from a value of about at low pressure to one of about at high pressure, indicating that is not invariant along the melting line, but the closeness of the reported values with Lindemann’s prediction support a qualitative validity of this rule.
The second empirical rule we test is based on the liquid structure and known as the Raveché-Mountain-Streett (RMS) freezing criterion. According to this rule, along the freezing line, the radial distribution function of the liquid obeys the following relation:
| (11) |
where, is the first non-zero minimum and the first maximum of the radial distribution function . In the inset of Fig. 12, we show the RMS freezing criterion along the coexistence pressure for the WCA and the fsLJ model. While quantitatively our results differ from the RMS rule, the data corresponding to the fsLJ model, which hover around at low pressures (between and ) and around at larger values of , point to a rough invariance of this quantity along the coexistence line. However, at low pressures (), corresponding to the WCA potential is much smaller than suggested by the RMS criterion, while at larger pressures, it saturates around value of about , close to the value obtained for the fsLJ model. A similar variation of the RMS freezing criterion along the coexistence line was also observed in an earlier work sadus2009 .
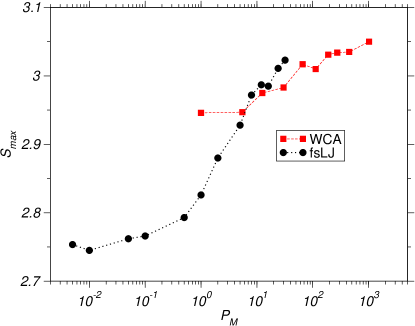
The Hansen-Verlet freezing rule states that the first peak of the liquid structure factor attains the value and remains invariant along the freezing curve. Hansen and Verlet postulated this rule based on observations corresponding to the LJ potential. Later, Agrawal and Kofke agrawal-kofke1995 reported a increase of this quantity along the coexistence line for the LJ potential. We computed the structure factor directly from the coordinates of the particles and not via a Fourier transform of the pair correlation function binder2004 . Our results (Fig. 13) for the two systems indicate a systematic increase of along the freezing curve. While corresponding to the fsLJ system increases from a minimum of to at the highest pressure, that for the WCA potential remains above the value predicted by the Hansen-Verlet freezing criterion at all the considered coexistence pressures. This indicates that the Hansen-Verlet criteria can at most be used as a rule of thumb principle to indicate how close the system is to the actual freezing temperature.
VI Conclusion
We have computed the crystal-melt kinetic growth coefficient from molecular dynamics simulation via the free solidification method. Our results are consistent with previous works as regards the magnitude and anisotropy of is concerned. The variation of the kinetic growth coefficient along coexistence indicates that the slowing down of the crystal growth is primarily a temperature effect. Changing the pressure by two orders of magnitude in case of the fsLJ potential does not change the magnitude of the kinetic growth coefficient in the coexistence region where the melting temperature remains almost unchanged.
Similarity of values between Lennard-Jones and hard-sphere systems indicate that packing effects play a dominant role in describing the growth kinetics. However, the specific nature of the interaction potential cannot be ignored. Classical theories of crystallization models predict values of in reasonably good agreement with simulation results, subject to an appropriate value of a fit parameter. In the high-temperature and high-pressure limit, the crystal growth kinetics of the fsLJ and WCA potentials are similar to each other. In this limit, the coexistence properties of the two systems approach that of the purely repulsive, inverse twelfth-power potential. Various melting and freezing rules have been investigated and while they roughly indicate the coexistence region, they are not quantitatively accurate.
Acknowledgments: The authors thank Roberto Rozas for useful discussions. RB thanks DAAD for financial support and DLR, Cologne, for computational and research facilities during the initial phase of this project. The authors acknowledge financial support from the German DFG in the framework of the M-era.Net project “ANPHASES”.
References
- (1) T. Palberg, J. Phys.: Condens. Matter 26, 333101 (2014).
- (2) J. Bragard, A. Karma, Y. H. Lee, and M. Plapp, Interface Sci. 10, 121 (2002).
- (3) J. S. Langer, Rev. Mod. Phys. 52, 1 (1980).
- (4) R. Willnecker, D. M. Herlach, and B. Feuerbacher, Phys. Rev. Lett. 62, 2707 (1989),
- (5) G. H. Rodway and J. D. Hunt, J. Cryst. Growth 112, 554 (1991).
- (6) M. E. Glicksman and R. J. Schaefer, J. Cryst. Growth 1, 297 (1967).
- (7) M. P. Allen and D. J. Tildesley, Computer Simulations of Liquids (Clarendon, Oxford, 1987).
- (8) K. Binder, J. Horbach, W. Kob, W. Paul, and F. Varnik, J. Phys.:Condens. Matter 16, S429 (2004).
- (9) H. A. Wilson, Philos. Mag. 50, 238 (1900).
- (10) J. Frenkel, Phys. Z. Sowjetunion 1, 498 (1932).
- (11) J. Q. Broughton, G. H. Gilmer, and K. A. Jackson, Phys. Rev. Lett. 49, 1496 (1982).
- (12) K. A. Jackson, Interf. Sci. 10, 158 (2002).
- (13) E. Burke, J. Q. Broughton, and G. H. Gilmer, J. Chem. Phys. 89, 1030 (1988).
- (14) F. Celestini and J.-M. Debierre, Phys. Rev. E 65, 041605 (2002).
- (15) J. Monk, Y. Yang, M. I. Mendelev, M. Asta, J. J. Hoyt, and D. Y. Sun, Modelling Simul. Mater. Sci. Eng. 18, 015004 (2010).
- (16) J. J. Hoyt, M. Asta, and A. Karma, Interf. Sci. 10, 181 (2002).
- (17) J. J. Hoyt, M. Asta, and A. Karma, Mat. Sci. Eng. Rep. R 41, 121 (2003).
- (18) M. Amini and B. B. Laird, Phys. Rev. Lett. 97, 216102 (2006).
- (19) J. J. Hoyt and M. Asta, Phys. Rev. B 65, 214106 (2002).
- (20) J. Benet, L. G. MacDowell, and E. Sanz, J. Chem. Phys. 141, 034701 (2014).
- (21) F. Turci and T. Schilling, J. Chem. Phys. 141, 054706 (2014).
- (22) W. J. Briels and H. L. Tepper, Phys. Rev. Lett. 79, 5074 (1997).
- (23) H. L. Tepper and W. J. Briels, J. Chem. Phys. 115, 9434 (2001).
- (24) H. L. Tepper and W. J. Briels, J. Chem. Phys. 116, 5186 (2002).
- (25) J. J. Hoyt, B. Sadigh, M. Asta, and S. M. Foiles, Acta Mater. 47, 3181 (1999).
- (26) D. Y. Sun, M. Asta, and J. J. Hoyt, Phys. Rev. E 69, 024108 (2004).
- (27) P. Kuhn and J. Horbach, Phys. Rev. B 87, 014105 (2013).
- (28) A. Kerrache, J. Horbach, and K. Binder, Europhys. Lett. 81, 58001 (2008).
- (29) Z. G. Xia, D. Y. Sun, M. Asta, and J. J. Hoyt, Phys. Rev. B 75, 012103 (2007).
- (30) D. Y. Sun, M. Asta, and J. J. Hoyt, Phys. Rev. B 69, 174103 (2004).
- (31) C. J. Tymczak and J. R. Ray, Phys. Rev. Lett. 64, 1278 (1990).
- (32) Y. F. Gao,Y. Yang, D. Y. Sun, M. Asta, and J. J. Hoyt, J. Cryst. Growth 312, 3238 (2010).
- (33) T. Zykova-Timan, R. E. Rozas, J. Horbach, and K. Binder, J. Phys.: Condens. Matter 21, 464102 (2009).
- (34) T. Zykova-Timan, J. Horbach, and K. Binder, J. Chem. Phys. 133, 014705 (2010).
- (35) H. E. A. Huitema, M. J. Vlot, and J. P. van der Eerden, J. Chem. Phys. 111, 4714 (1999).
- (36) H. Löwen, Phys. Rep. 237, 249 (1994).
- (37) P. A. Monson and D. A. Kofke, Adv. Chem. Phys. 115, 113 (2000).
- (38) F. A. Lindemann, Phys. Z. 11, 609 (1910).
- (39) W. B. Sreett, H. J. Raveché, and R. D. Mountain, J. Chem. Phys. 61, 1960 (1974); H. J. Raveché, R. D. Mountain, and W. B. Streett, J. Chem. Phys. 61, 1970 (1974).
- (40) J. P. Hansen and L. Verlet, Phys. Rev. E 184, 151 (1969); J.-P. Hansen, Phys. Rev. A 2, 221 (1970).
- (41) H. C. Andersen, J. Chem. Phys. 72, 2384 (1980).
- (42) J. R. Errington, P. G. Debenedetti, and S. Torquato, J. Chem. Phys. 118, 2256 (2003).
- (43) A. Ahmed and R. J. Sadus, Phys. Rev. E 80, 061101 (2009).
- (44) A. Ahmad and R. J. Sadus, J. Chem. Phys. 131, 174504 (2009).
- (45) W. G. Hoover, S. G. Gray, and K. W. Johnson, J. Chem. Phys. 55, 1128 (1971).
- (46) J.-P. Hansen and I. R. McDonald, Theory of Simple Liquids (Academic Press, London, 2006).
- (47) B. B. Laird and R. L. Davidchack, J. Phys. Chem. B 109, 17802 (2005).
- (48) U. R. Pedersen, F. Hummel, and C. Dellago, J. Chem. Phys. 142, 044104 (2015).
- (49) M. L. F. Nascimento, E. B. Ferreira, and E. D. Zanotto, J. Chem. Phys. 121, 8924 (2004).
- (50) F. Saija, S. Prestipino, and P. V. Gianquinta, J. Chem. Phys. 124, 244504 (2006).
- (51) R. Agrawal and D. Kofke, Mol. Phys. 85, 23 (1995); ibid. 85, 43 (1995).