On the Influence of Minor Mergers on the Radial Abundance Gradient in Disks of Milky Way-like Galaxies
Abstract
We investigate the influence of stellar migration caused by minor mergers (mass ratio from 1:70 to 1:8) on the radial distribution of chemical abundances in the disks of Milky Way-like galaxies during the last four Gyr. A GPU-based pure N-body tree-code model without hydrodynamics and star formation was used. We computed a large set of mergers with different initial satellite masses, positions, and orbital velocities. We find that there is no significant metallicity change at any radius of the primary galaxy in the case of accretion of a low-mass satellite of 109 M⊙ (mass ratio 1:70) except for the special case of prograde satellite motion in the disk plane of the host galaxy. The accretion of a satellite of a mass M⊙ (mass ratio 1:23) results in an appreciable increase of the chemical abundances at galactocentric distances larger than kpc. The radial abundance gradient flattens in the range of galactocentric distances from 5 to 15 kpc in the case of a merger with a satellite with a mass M⊙. There is no significant change in the abundance gradient slope in the outer disk (from kpc up to 25 kpc) in any merger while the scatter in metallicities at a given radius significantly increases for most of the satellite’s initial masses/positions compared to the case of an isolated galaxy. This argues against attributing the break (flattening) of the abundance gradient near the optical radius observed in the extended disks of Milky Way-like galaxies only to merger-induced stellar migration.
Subject headings:
galaxies: abundances – galaxies: evolution – galaxies: kinematics and dynamics1. Introduction
It is well known that the heavy element abundance in the disks of the Galaxy and other spiral galaxies decreases with increasing galactocentric distance. This radial metallicity gradient was revealed about 50 years ago through measurements of the metallicity in stars and H II regions (e.g., Mayor, 1976; Searle, 1971; Peimbert, 1979; Shields & Searle, 1978). The oxygen abundance gradient in nearby spiral galaxies traced by H II regions ranges from 0 dex kpc-1 to dex kpc-1 (e.g., Vila-Costas & Edmunds, 1992a; Zaritsky et al., 1994; Sánchez et al., 2014; Pilyugin et al., 2014). Estimations of the iron and oxygen abundance gradient in the Galaxy based on Cepheids and open clusters result in a slope of approximately dex kpc-1 (Andrievsky et al., 2002b, a; Bragaglia et al., 2008; Lemasle et al., 2008; Pedicelli et al., 2009; Yong et al., 2012). However, the origin of the gradient and its relation to other macroscopic parameters of galaxies are still open for discussion.
There are indications that radial metallicity profiles in the Milky Way and some giant spiral galaxies show a break within the optical radius , which corresponds the isophotal radius at a B-band surface brightness of 25 mag arcsec-2. The iron abundance profile in the Galaxy traced by open clusters is found to become shallower beyond 10–14 kpc by Bragaglia et al. (2008) and Yong et al. (2012). The earlier data on Cepheids confirm the flattening of the iron gradient in the outer Galactic disk (Andrievsky et al., 2002b, a; Lemasle et al., 2008), while recent measurements of an extended sample of Cepheids show less evident (if any) flattening of the gradient in the outer Galactic disk (Luck & Lambert, 2011; Lemasle et al., 2013). OB star observations also do not indicate an existence of a metallicity profile break in the outer Galactic disk (Daflon & Cunha, 2004). The radial distribution of gas phase oxygen and nitrogen abundances in the optical disks of the majority of spiral galaxies traced by H II regions can be well fitted by a single exponential profile (linear in the term of lg(X/H)) (Pilyugin et al., 2014) while possible profile slope changes are reported for some barred galaxies (Martin & Roy, 1995; Zahid & Bresolin, 2011; Scarano et al., 2011).
Far-ultraviolet and near-ultraviolet observations by the Galaxy Evolution Explorer (GALEX) satellite reveal that a large fraction of late-type galaxies in the local universe show significant star formation beyond their optical radii (Gil de Paz et al., 2007; Thilker et al., 2007). Those galaxies are referred to as extended ultraviolet disk (XUV-disk) galaxies. Spectra of a number of H II regions in the extended disks of five spiral galaxies were measured recently revealing flat gradients in the extended disks (Bresolin et al., 2009; Goddard et al., 2011; Bresolin et al., 2012; Patterson et al., 2012; Werk et al., 2011). Pilyugin et al. (2012) found the same radial gradient breaks for nitrogen abundances in those galaxies and noted that the change in the gradient slope is more distinct in the radial distribution of nitrogen than of oxygen abundances. Observations of OB stars in NGC 3621 also support the metallicity profile flattening in the XUV-disk obtained from the study of H II regions (Kudritzki et al., 2014). Thus, the abundance gradient is flatter in the extended disks () as opposed to the optical disks () in the case of a number of spiral galaxies.
Bresolin et al. (2012) have advocated that it is unlikely that in situ star formation could have produced and distributed enough heavy elements to enrich the interstellar medium in the extended disks to the presently observed values. Werk et al. (2010) have considered three plausible mechanisms that may explain the relatively high metallicity of the extended disks: radial redistribution of centrally generated metals, strong galactic winds with subsequent fallback, and a past interaction leading to the accretion of enriched gas. The last mechanism, however, cannot be the sole explanation (Werk et al., 2011).
The transport of the heavy elements from the inner to the extended disks is also suggested as a possible explanation of flat radial abundance gradients (Werk et al., 2011; Bresolin et al., 2012). Particularly, it was shown that the presence of a central bar and spiral structure may lead to rather strong radial migration of stars and gas in galactic disks (Friedli et al., 1994; Sellwood & Binney, 2002; Roškar et al., 2008; Schönrich & Binney, 2009; Minchev & Famaey, 2010; Minchev et al., 2013, 2014) and a strong flattening during galaxy evolution in the [Fe/H] radial profiles for the old stellar populations (Minchev et al., 2014). But while such a mechanism is quite effective in the inner disk, radial migration studies that are in line with or going back to the analytic prescription for radial migration strengths of Schönrich & Binney (2009) suggest very low migration for the outer disk in quiescent galaxies.
Radial migration can be also caused by the interaction and merging with other galaxies. Cosmological simulations demonstrate that minor mergers should be a frequent and common process during the lifetime of galaxies, in particular since z 1, and the number of satellites that fall on a Milky Way-like galaxy strongly increases with decreasing satellite mass (Kazantzidis et al., 2008). At the present day, we observe the strong interaction of the Milky Way with the Sagittarius dwarf galaxy (Ibata et al., 1994, 1995). The center of this dwarf spheroidal (dSph) galaxy with a mass of M⊙ is located nearly behind our Galactic center at a heliocentric distance of kpc (Monaco et al., 2004). A satellite with the mass of a few times 109 M⊙ can significantly heat the outer Galactic disk, excite the central spiral structure and create a warp that can induce significant streams in the velocity distribution (Shumakova & Berczik, 2005; Quillen et al., 2009). Bird et al. (2012) considered the dynamical evolution of a Milky Way-like galaxy with an accretion history motivated by cosmological simulations and concluded that satellite perturbations appear to be a distinct mechanism for inducing radial migration. Thus one may expect a considerable role of minor mergers in the chemo-dynamical evolution of galaxies during the last few Gyr.
So far the attention has been mainly focused on the behavior of the radial metallicity gradient during the last few Gyr under the “major merger” scenario, i.e., interactions between massive galaxies (Kewley et al., 2010; Montuori et al., 2010; Rupke et al., 2010; Perez et al., 2011), while less attention has been paid to the possible influence of stellar migration caused by a minor merger on the radial distribution of the metallicity in the disks of spiral galaxies. In this study we will carry out high resolution N-body/TREE-GPU simulations aimed at examining the influence of pure stellar migration caused by minor mergers (with a mass ratio of the mergers from 1:8 to 1:70) on the radial distribution of metallicity in the disks of large spiral galaxies out to 25 kpc. In particular, we will investigate the role of the initial orbit orientation and of the mass of the merged satellite in the formation of present-day metallicity gradients. We will explore whether satellite accretion can plausibly be responsible for the flattening of the metallicity gradient in Milky Way-like galaxy disks.
2. Model and Code Description
Our aim was to develop a simple model that can tell us how stellar migration caused by mergers may have affected the radial distribution of metallicity in the disks of a Milky Way-like galaxy. In order to see clearly the purely dynamical mixing effect (migration) and to reduce the number of free parameters in our model we adopt a number of simplifications: (1) our merger system is purely based on N-body simulations, without gas; (2) we do not assume star formation; (3) the initial dynamic and kinematic parameters of a Milky Way-like galaxy are assumed to be close to the Milky Way parameters at the present time; (4) the initial metallicity distribution of our model is based on the measured abundance distributions in spiral galaxies traced by H II regions and young stellar populations; and (5) we neglect the possible dilution of disk metallicity by satellite stars deposited in the disk of the host galaxy. In this sense the satellite is considered just as a dark matter sub-halo.
We consider galaxy evolution only during the last four Gyr since the initial conditions of our model are close to those at the present time. Cosmological simulations of the formation of a Milky Way-like galaxy support our assumption that the disk of a Milky Way-like galaxy remained quite stable during the last few Gyr (Bird et al., 2013). This approach leads us to a model with a strongly reduced number of degrees of freedom for the investigation of the influence of the migration of collisionless particles caused by minor mergers.
For our Milky Way-like galaxy we adopt the Kuijken & Dubinski (1995) “MW-D” model of a disk galaxy with some slightly changed parameters. In our model we represent the galaxy with 2 million disk particles with a total mass of 5.75 1010 M⊙, 0.4 million bulge particles with a total mass of 1.29 1010 M⊙ and 5 million of dark matter halo particles with a total mass of 9.89 1011 M⊙. We take the exponential scale length of the disk to be = 2.97 kpc, the disk scale height = 0.225 kpc, and the central radial velocity dispersion = 123 km s-1. With this choice of parameters the stellar surface density at the solar vicinity is 57 M⊙pc-2 and Toomre’s stability parameter (Toomre, 1964) is 2.6. We report the total list of our host galaxy model parameters in Table 1 and Table 2.
| Bulge cut-off potential, | -4.7 |
|---|---|
| Bulge velocity dispersion, | 1.29 |
| Bulge central density, | 125 |
| Halo central potential, | -6.7 |
| Halo velocity dispersion, | 1.45 |
| Halo potential flattening, | 1.0 |
| Halo concentration, | 0.1 |
| Characteristic halo radius, | 0.7 |
| Disk mass, | 1.1 |
| Disk scale radius, | 0.66 |
| Disk truncation radius, | 7.0 |
| Disk truncation width, | 0.5 |
| Disk scale height, | 0.05 |
| Number of bulge particles, | 4105 |
|---|---|
| Bulge mass, | 1.291010 M⊙ |
| Bulge particle mass, | 3.23104 M⊙ |
| Number of halo particles, | 5106 |
| Halo mass, | 9.891011 M⊙ |
| Halo particle mass, | 19.78104 M⊙ |
| Number of disk particles, | 2106 |
| Disk mass, | 5.751010 M⊙ |
| Disk particle mass, | 2.88104 M⊙ |
| Disk scale radius, | 2.97 kpc |
| Disk scale height, | 225 pc |
The initial distribution of the particles in the satellite galaxy (“perturber”) is given by a simple spherically symmetric Plummer model with particles and with an initial total mass from 109 M⊙ () to M⊙ (). The initial half-mass radius was chosen to correspond to one third of the power of the initial mass of the satellite from = 0.15 kpc to 0.31 kpc. In this way we keep the initial ratio of the tidal radius to the half-mass radius of the satellite galaxy roughly constant (in our case it was 25).
Oxygen was chosen as “metallicity indicator”. We adopted as an initial condition that all the particles at a given galactocentric distance have the same metallicity, which was taken from the radial abundance gradient relation. We assume the central oxygen abundance to be 12+lg(O/H) = 8.8 and the slope of the gradient to be dex kpc-1, i.e.,
| (1) |
where is galactocentric distance in kpc for the disk particles. These values are based on the measured abundance distributions in spiral galaxies (e.g., Vila-Costas & Edmunds, 1992b; Zaritsky et al., 1994; Maciel & Costa, 2010; Pilyugin et al., 2003, 2004, 2014; Sánchez et al., 2014). This simplification seems to be justified since detailed studies of the age-metallicity relation of stars in the Galactic disk (solar vicinity) show an almost constant metallicity for the last four Gyr, accompanied by substantial scatter (e.g., Haywood et al. (2013), their figure 9; Casagrande et al. (2011), their figure 18).
Thus, on the one hand, our particles can be considered as “stars” since an N-body simulation is used and the metallicity of the particle does not change during the evolution. On the other hand, they can be considered as “gas clouds” since the metallicities of all the particles at a given radius at the initial time are taken to be the same. It should be noted that since our simulations deal with a pure N-body problem without involving any chemical enrichment, our results can be applied to other elements as well, not only to oxygen. There is only one restriction: the process of chemical radial mixing must be done by objects that can represented as a “N-body particles”.
2.1. Code description
We ran all simulations using our version of the N-body TREE-GRAPE (GRAvity PipEline) code (Fukushige et al., 2005, section 4.1). We also ported the original GRAPE-based tree code to many different hardware platforms including the CPU (with multi-thread usage under the SSE or AVX instructions) and also to the recent NVIDIA Graphics Processing Unit (GPU) platform using the Compute Unified Device Architecture (CUDA). In order to efficiently use the current acceleration hardware (GPU), we employed a modified tree algorithm, originally developed by Barnes & Hut (1986), which was first used on GRAPE-1A by Makino (1991) and Fukushige et al. (1991).
On a typical desktop hardware (CPU: i5-2500K with 4 cores @ 3.3 GHz + GPU: GeForce GTX 570 with 480 cores @ 1.46 GHz) we get the results for the full self-gravity force calculation routine with the typical tree-construction parameters ( = 0.5, = 3500, (Fukushige et al., 2005, section 4.1.1)) for M particles with the initial Plummer distribution in 2 sec. Our speed is quite comparable to the most advanced and recent fully GPU tree code implementation (bonsai2: Bédorf et al. (2012a, b)), which does one full-force calculation on the same hardware for the same particle distribution and with the same opening angle in 1 sec. In the last years we already used and extensively tested our hardware-accelerator-based gravity calculation routine in a few of our galactic dynamics projects and get quite accurate results with a good performance (Shumakova & Berczik, 2005; Bien et al., 2008; Pasetto et al., 2010, 2011).
The current set of simulations was carried out with the GPU version of the code using local GPU clusters available at the authors’ institutions (ARI: kepler, MAO: golowood, NAOC: laohu).
We call the current version of our N-body code ber-gal0. The source code of the program is publicly available from the FTP site111ftp://ftp.mao.kiev.ua/pub/users/berczik/ber-gal0/ of one of the authors. In our production runs for the gravitational force calculation we use a very conservative opening angle = 0.4. A gravitational softening parameter = 40 pc was adopted for all the particles. We use the simple leap-frog integration scheme with a fixed time-step Myr to advance the particle positions and velocities during the calculation. One basic run covering up to 4 Gyr with million particles takes hours. The total number of models presented in the current paper is 34, so the total computational time was 78 days.
2.2. Disk stability
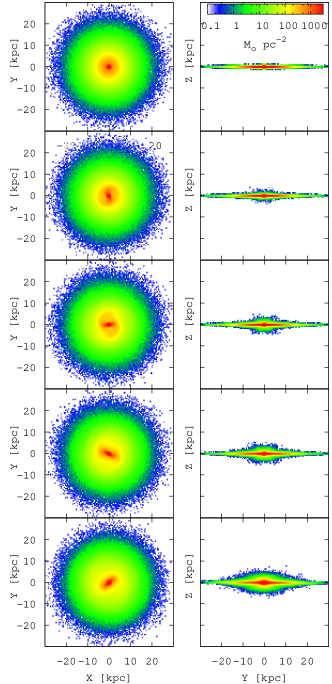
First of all, we computed the evolution of the host (Milky Way-like) galaxy without a satellite (no “perturber”) in order to test the stability of the structure and the radial oxygen abundance distribution during 4 Gyr of evolution. The first and second columns of Figure 1 show the column-density evolution of the disk+bulge components of the galaxy model at , 0.4, 0.8, 1.2, and 4 Gyr. The face-on column density maps (left column of Figure 1) show that the isolated galaxy forms a long-lived bar.
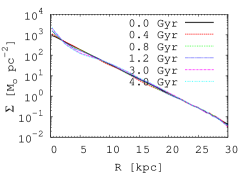
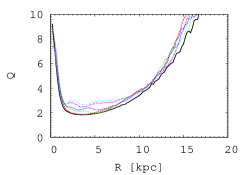
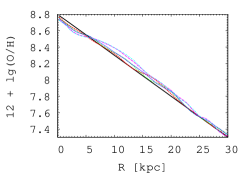
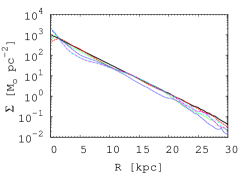
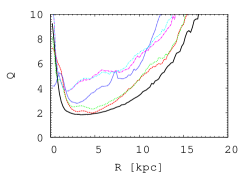
Changes in the disk’s radial surface density, Toomre’s stability parameter , and in the oxygen abundance profiles during the 4 Gyr of isolated host galaxy evolution are presented in the top panels of Figure 2. The radial surface density profiles of the disk show that the formation of a bar leads to radial mixing in the inner part of galactic disk. According to Toomre’s stability parameter , our disk model is stable against non-axisymmetric perturbations (see Fourier analysis presented on Figure 15) with a minimal value at a radius of 3.6 kpc for the initial isolated disk setup with an increase of the minimal value during the run.
Nevertheless, the variations of the disk’s radial surface density and radial metallicity profile during 4 Gyr of evolution of an undisturbed galaxy are small (top panels of Figure 2). The maximum value of changes in the oxygen abundance across the entire range of galactocentric distances also does not exceed dex during 4 Gyr of evolution of our undisturbed galaxy. This can be considered as evidence that the host galaxy model is sufficiently stable and can be used to study changes in the radial abundance distribution due to migration caused by the merging (interaction) with a satellite.
2.3. Stability against disk and code parameters
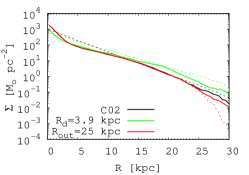
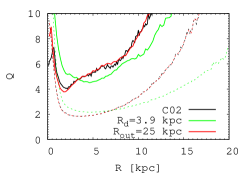
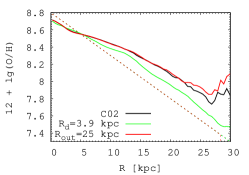
The top panels of Figure 3 show the influence of the variation of the disk parameters on the disk’s radial surface density (left column), Toomre’s stability parameter (middle column), and oxygen abundance profiles (right column). Profiles for model C02 (a galaxy with a basic disk scale radius kpc and disk truncation radius kpc, which merged with a satellite of a mass of M⊙ (black lines), and models with kpc (green lines) and kpc (red lines) are presented. The dotted lines indicate the initial profiles, and the solid lines show profiles at 4 Gyr of evolution. The initial slopes of the oxygen abundance gradient are in all cases –0.05 dex kpc-1. It is evident that increasing the disk scale radius by 30 increases also the surface density of the outer disk, which leads to a decrease of Toomre’s stability parameter in the outer disk, but makes it more stable against changes of the oxygen abundance induced by mergers. This behavior can be explained as follows. The level of the increase of the abundance in the outer disk depends on the ratio of the number of high-metallicity particles that migrated from the inner region of the disk to the number of particles in the outer disk. Since increasing the increases the number of non-migrated particles (surface density) in the outer disk, the increase the oxygen abundance in the outer disk is less for a disk with higher . A reduction of the disk size from 31.5 kpc to 25 kpc shows no appreciable changes in the oxygen abundance profile within the reduced disk radius, i.e., up to 25 kpc.
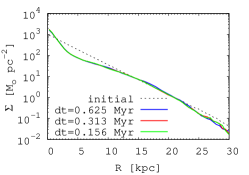
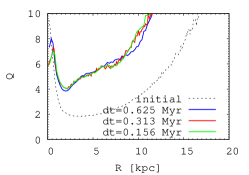
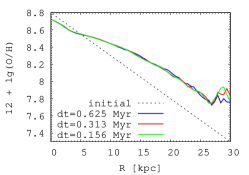
The bottom panels of Figure 3 show the stability of the disk’s radial surface density (left column), Toomre’s stability parameter (middle column), and the oxygen abundance profiles (right column) for different time steps in the simulation. Profiles for model C02 with Myr (blue line), Myr (red line), and Myr (green line) are presented. The dotted lines indicate initial profiles. The solid lines indicate profiles at Gyr.
3. Satellite initial orbits and velocity
We ran four sets of simulations with satellite masses ranging from 109 M⊙ to 9 109 M⊙ (mass ratios of 1:70 to 1:8). Each set consists of 7 runs with different initial positions of the satellite galaxy. The initial distance from the center of the host galaxy was taken to be 40 kpc for all the runs. The initial three-dimensional positions and velocity directions were chosen in such a way that the satellite orbit inclination is equal to the fixed angles , , , , , , and 180∘. The inclinations correspond to a retrograde orbital motion of the satellite. The initial absolute value of the satellite velocity for our runs is km s-1 (see discussion below). The parameters of the simulations are summarized in Table 4.
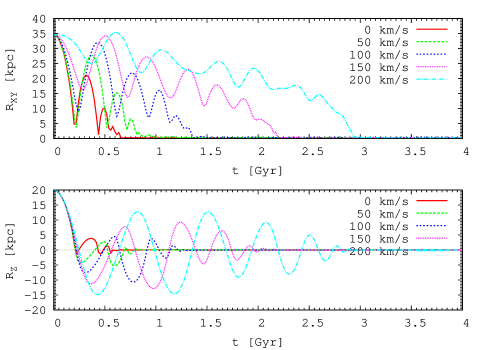
To check how the orbital elements affect the radial abundance distribution we ran a set of five simulations with an initial satellite velocity from km s-1 to 200 km s-1, with a fixed initial distance from the galactic center of 40 kpc, with a fixed initial orbital inclination , and with a fixed mass of M M⊙. The parameters of this set of simulations are summarized in the Table 3. The results are discussed below.
| Model | Mass [] | [km s-1] | (O/H)all | (O/H)inner | (O/H)outer |
|---|---|---|---|---|---|
| A00 | 0 | - | -0.04530.0010 | -0.03870.0017 | -0.05540.0007 |
| E01 | 6 | 0 | -0.04490.0007 | -0.04160.0008 | -0.05440.0010 |
| E02 | 6 | 50 | -0.04040.0008 | -0.03640.0007 | -0.05310.0006 |
| E03 | 6 | 100 | -0.03260.0006 | -0.02650.0007 | -0.04260.0007 |
| E04 | 6 | 150 | -0.03000.0008 | -0.02310.0008 | -0.04600.0014 |
| E05 | 6 | 200 | -0.02980.0007 | -0.02230.0004 | -0.04390.0018 |
Figure 4 shows the orbital evolution of satellites for this set of models. The top panel shows the evolution of distance from the host galaxy to the satellite in the disk plane. The bottom panel shows the evolution of satellite height above the host galaxy disk plane. The times needed for settling the satellite in the host galaxy center vary from Gyr (initial satellite velocity equals km s-1) to Gyr (satellite velocity km s-1).
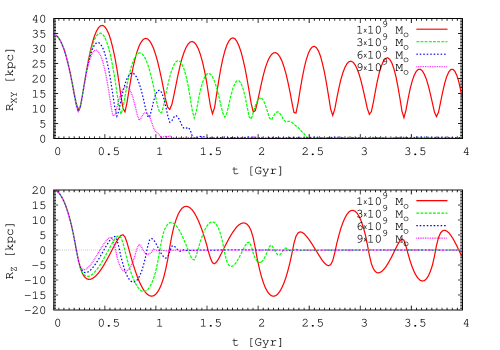
Figure 5 shows the orbital evolution of satellites in the models A02, B02, C02, and D02, which have the same satellite initial position kpc and kpc (initial orbital inclination ) and masses from M⊙ to M⊙. The top panel shows the evolution of distance from the host galaxy to the satellite in the disk plane. The bottom panel shows the evolution of satellite height above the host galaxy disk plane.
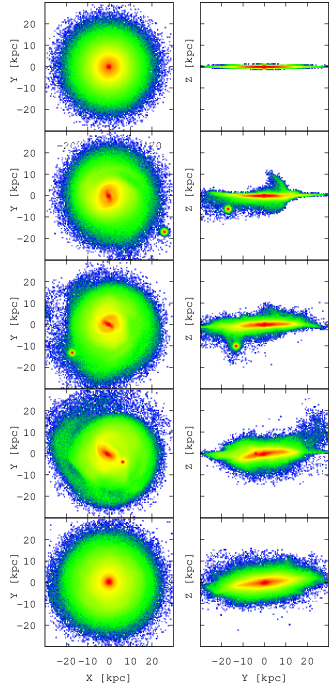
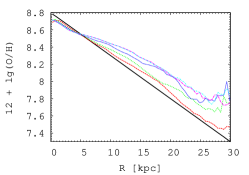
The two right columns of Figure 1 show disk+bulge+satellite column density for the model with a satellite mass of M⊙ (mass ratio 1:12), initial satellite position kpc and kpc (initial orbital inclination ) and velocity km s-1 at the times , 0.4, 0.8, 1.2, and 4 Gyr. For comparison, the two left columns of Figure 1 show the column density for the run without satellite. The bottom right panel of Figure 2 illustrates the evolution of the radial metallicity distribution in the host galaxy during the merger with the satellite. The solid black line shows the initial metallicity distribution. The dotted lines mark the metallicity distributions at different times up to 4 Gyr. The top right panel of the Figure 2 shows the evolution of the metallicity distribution in the galaxy without satellite.
The evolution of the metallicity distribution in the model C02 can be divided into two stages. During the first stage, for up to Gyr, the satellite moves along a semi-periodic orbit around the host galaxy, perturbing the disk of the host galaxy. These perturbations induce the radial migration of stars and, therefore, result in changes in the metallicity distribution across the disk, increasing the abundances in its outer region ( kpc). During the second stage, the satellite approaches the host galaxy and passes through denser regions. The rates of loss of both angular momentum and kinetic energy increase due to the intense dynamical friction (see, e.g., Just et al., 2011). This effect moves the satellite towards the disk and then into the center of the host galaxy: in model C02, the surface density defined by the disk particles at the end of the simulation ( Gyr) is more than 100 times larger than the surface density defined by the satellite particles for all disk regions except the innermost region ( kpc). The lines on the bottom right panel of Figure 2 show the radial abundance distributions in the host galaxy at the times , 3, and 4 Gyr. There are no significant changes in the oxygen abundances in the inner part of the disk ( kpc), but the abundances at large galactocentric distances increase by dex. The slope of the abundance gradient at galactocentric distances kpc becomes flatter.
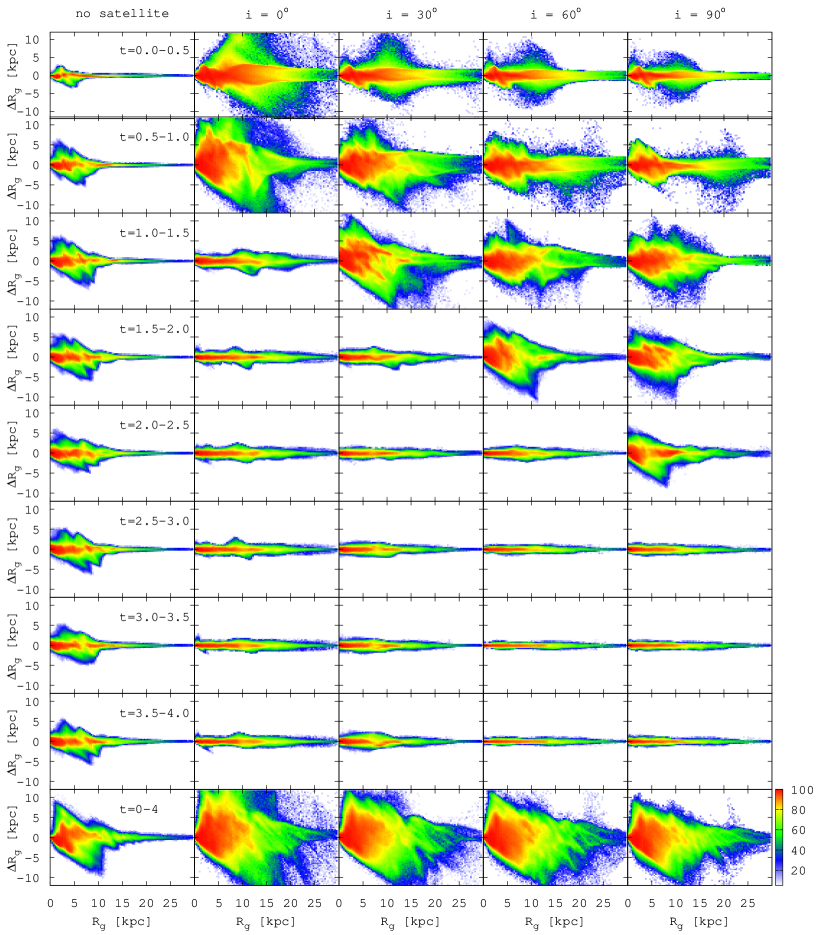
Figure 7 shows the angular momentum distribution evolution for models that have the same satellite initial position kpc and kpc (initial orbital inclination ) and mass M⊙), but different values of the initial velocity. Both axes are in kpc units due to the normalization of the angular momentum by the circular velocity in the disks. All rows except the last represent the successive changes in angular momentum within the time interval of Gyr. The last row represents the total cumulative changes of the angular momentum from 0 to 4 Gyr.
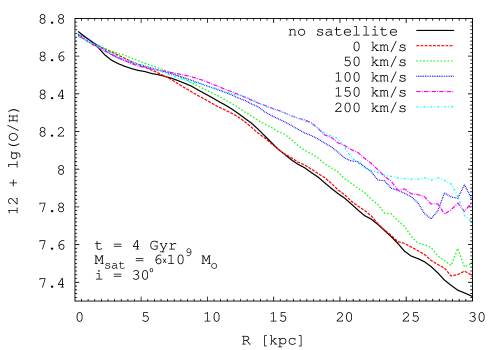
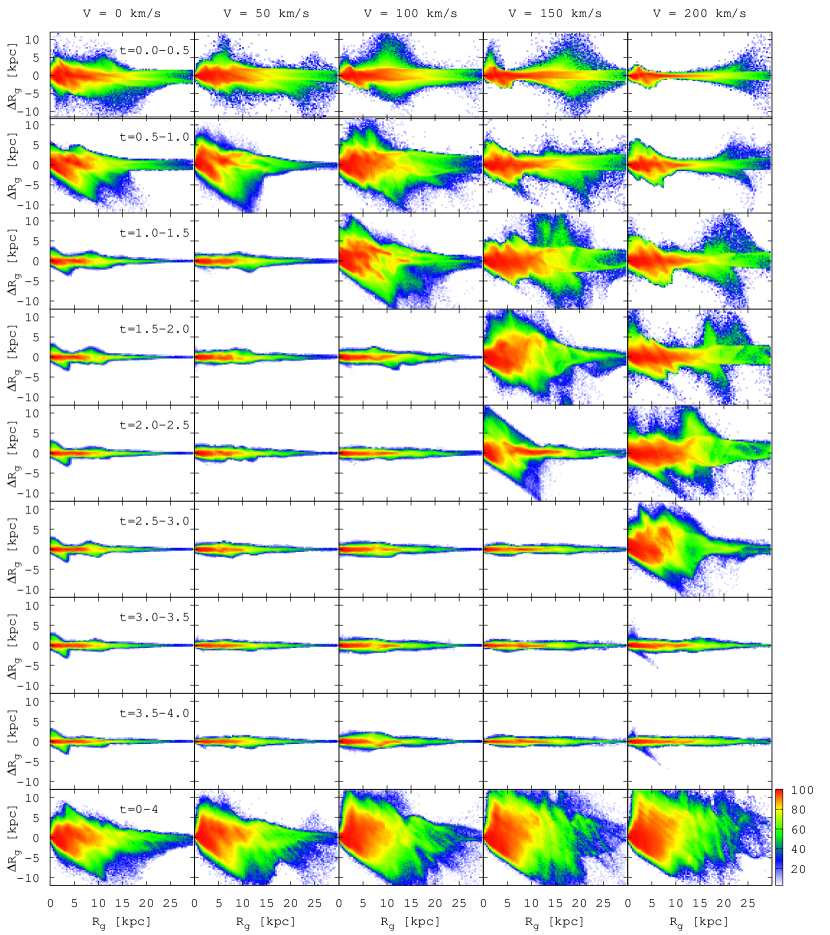
Figure 6 shows the radial abundance profile at Gyr. The solid black line is the model without satellite. The dotted lines represent models with satellites of different initial velocities. One can see in Figure 4 and Figure 7 that all the models undergo merging by Gyr, so we can compare the influence of the satellite’s initial velocity on the metallicity gradient as the result of the merging process. The largest influence on the metallicity gradient of the outer disk can be observed for the satellite initial orbital velocity of km s-1. A further increase of the satellite’s initial orbital velocity does not significantly change the behavior of the radial oxygen abundance profile of the outer part of the disk (Figure 6). Thus, we choose the satellite’s initial orbital velocity km s-1 as the basic setup for further investigation.
4. Results & Discussion
4.1. Radial metallicity distribution
Now we discuss the influence of the particle migration caused by the merger of satellite and host galaxy with different mass ratios and orbit orientations on the abundance distribution across the disk.
Figure 8 shows the radial abundance distributions at Gyr. The masses of the satellites are M⊙ (upper left panel), M⊙ (upper right panel), M⊙ (bottom left panel), and M⊙ (bottom right panel). The solid black line corresponds to the evolution of the model without satellite, the dotted lines show the host galaxy accreting satellites with different initial orbit inclinations. The comparison between the model without and with satellites shows that there are no significant changes ( dex) in the radial abundance distribution after 4 Gyr of evolution in the inner part of the disk of the host galaxy for all the satellite masses considered (Figure 8). In the case of the smallest satellite mass ( M⊙) (top left panel), there are no significant changes in the radial abundance distribution across the whole disk except for the case when the orbital inclination of the satellite . Accretion of more massive satellites causes a significant increase (up to dex) in the oxygen abundances at galactocentric distances kpc, as illustrated in the top right and bottom panels of Figure 8.
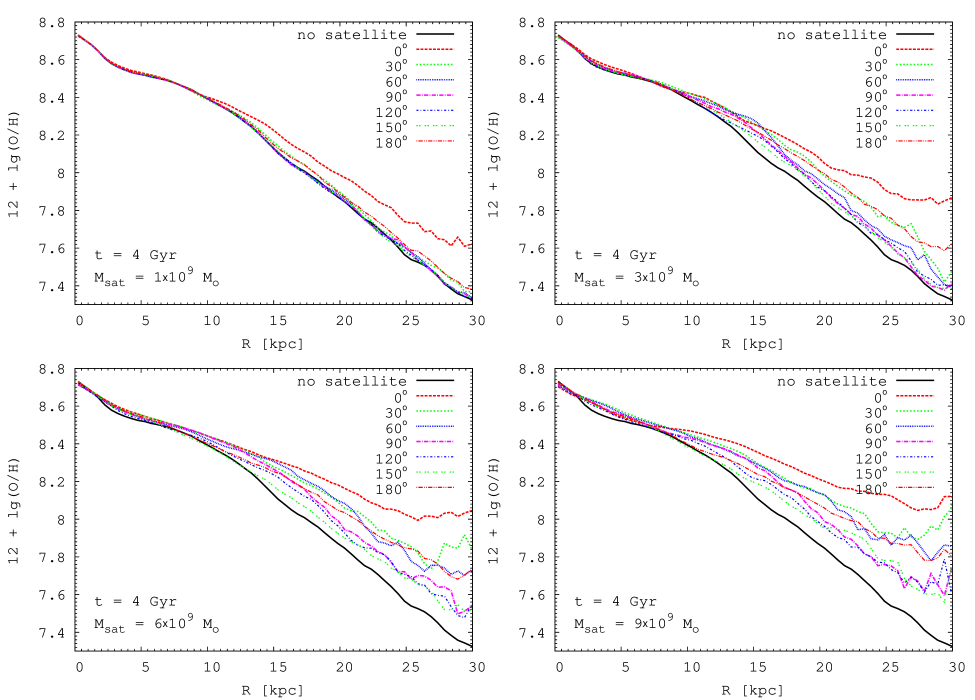
The accretion of a satellite with a mass of M⊙ or less with an orbit in the disk plane in prograde direction can lead to a significant increase of the metallicity in the outer regions of the host galaxy. It should be noted that the abundance redistribution due to merging strongly depends not only on the satellite mass but also on its initial orbital inclination. The maximum redistribution is caused by satellites with prograde orbits () in the disk plane of the galaxy. The minimum redistribution is caused by satellites with retrograde orbits with an initial inclination to .
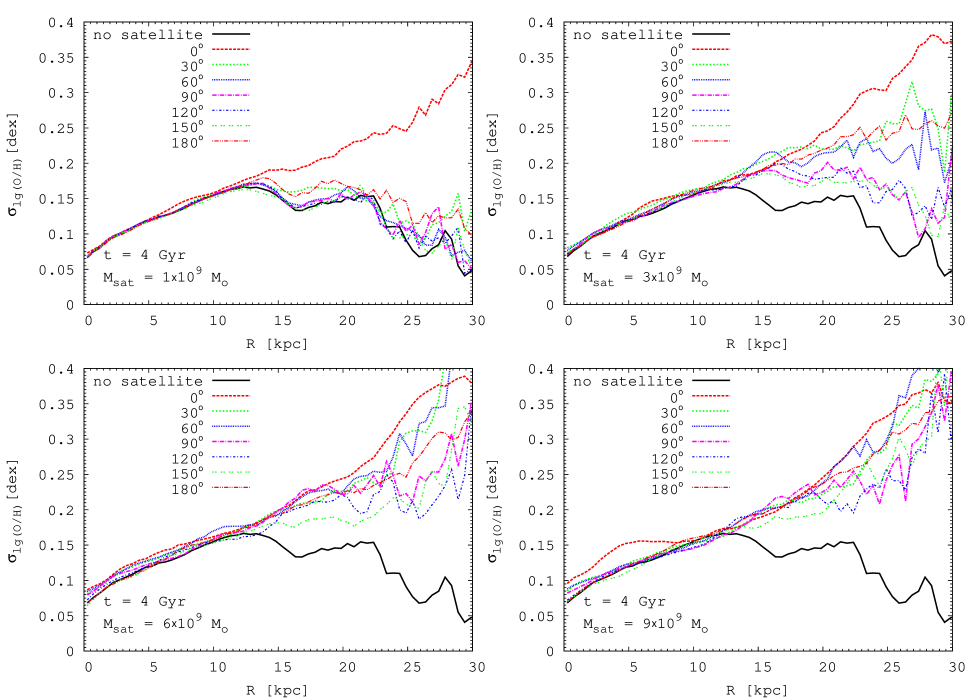
Figure 9 shows the mean deviation around the radial abundance trend (in radial cylindrical bins) at Gyr for models without (solid black line) and with satellite (dotted lines). Models with the four satellite masses M⊙ (mass ratio 1:70) (top left panel), M⊙ (mass ratio 1:23) (top right panel), M⊙ (mass ratio 1:12) (bottom left panel), and M⊙ (mass ratio 1:8) (bottom right panel) are presented. The scatter in the abundances at a given radius caused by radial migration of the particles in the model without satellite increases with galactocentric radius up to kpc and decreases beyond this radius. The scatter in metallicities at a given radius in the outer disk ( 15 kpc) significantly increases for most satellite initial masses/positions compared to the isolated galaxy case.
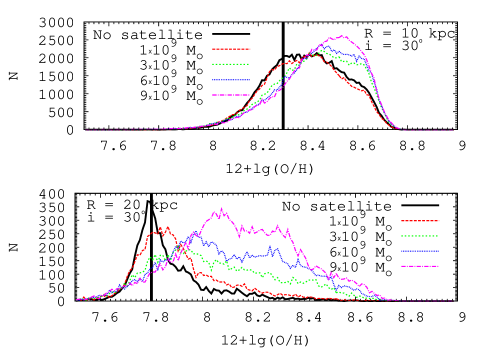
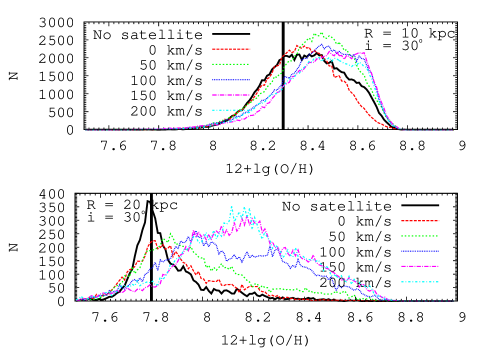
Figure 10 shows the abundance distribution histogram for particles at Gyr for the models A00 (without satellite) and A02, B02, C02, D02 (with satellites of different masses) at galactocentric radii of kpc (top panel) and kpc (bottom panel). The vertical black lines show the initial abundance distributions at these radii. It is clear that the accretion of a satellite with a mass M⊙ significantly shifts the abundance distribution at both galactocentric distances to higher values and the shift is larger at larger radii. A small fraction of particles with high abundances from the central region migrates to the outer disk region even in the case of an isolated galaxy. These particles produce an asymmetric particle abundance distribution with a high abundance tail (see the solid black line at the bottom panel in Figure 10). Figure 11 shows again the abundance distribution histogram for particles at 4 Gyr for galactocentric radii of 10 kpc (top panel) and 20 kpc (bottom panel) predicted by the models with a fixed initial satellite orbit inclination () and mass (Msat = 6 109 M⊙) but with different initial velocities from to 200 km s-1.
4.2. Radial metallicity distribution breaks
Our simulations provide radial metallicity distributions in the outer disk (up to 30 kpc) for a Milky Way-like disk galaxy. It gives us an opportunity to test whether the shallow abundance gradient observed in the outer disks of some spiral galaxies can be attributed to star particle migration caused by merging. The part of the disk with between 5 and 15 kpc will be referred to as the inner (optical) disk while the part of the disk between 15 and 25 kpc will be referred to as the outer (extended) disk. The innermost region kpc is not discussed here. The region beyond kpc is also excluded from our discussion since the number of particles there is not high enough for reliable estimations of metallicities.
A close examination of the radial metallicity distributions shows that the abundance distribution slopes slightly change with radius. To quantify the variations in the abundance gradient slopes we fit the abundance distributions at 4 Gyr with separate exponentials in the inner and outer disks for each simulation from Table 3 and Table 4. The obtained slopes are listed in Table 4. The first column gives the model number. Column 2 reports the satellite mass, column 3 lists the initial distance of the satellite, column 4 reports the initial satellite inclination, columns 5, 6, and 7 give the slope of abundance gradient in entire disk ( to 25 kpc), in the inner disk ( to 15 kpc), and in the outer disk ( to 25 kpc), respectively.
Inspection of Table 4 shows that the slopes of the abundance gradient at Gyr in the inner disk ( dex kpc-1) and in the outer disk ( dex kpc-1) of an isolated galaxy (model A00) are quite close to the initial slope of dex kpc-1. The slopes of the gradient in the outer (extended) disk in the majority of the models with satellites are close to that in the model of an isolated galaxy. In contrast, the slopes of the gradient in the inner disk in the majority of the models with satellites of masses M⊙ decrease. Assuming a mass-to-light ratio in the B band of (Flynn et al., 2006), the optical () radius of our host galaxy is kpc. Thus, the flattening of the gradient observed in extended ultraviolet disks (XUV-disk) of some spiral galaxies (Gil de Paz et al., 2007; Thilker et al., 2007) cannot be attributed to particle migration caused by the accretion of a low-mass satellite at least for Milky Way-like type galaxies.
| Model | Mass [] | [kpc] | [deg] | (O/H)all | (O/H)inner | (O/H)outer |
|---|---|---|---|---|---|---|
| A00 | 0 | - | - | -0.04530.0010 | -0.03870.0017 | -0.05540.0007 |
| A01 | 1 | 40 | 0 | -0.03750.0007 | -0.03030.0006 | -0.04660.0006 |
| A02 | 1 | 40 | 30 | -0.04390.0010 | -0.03610.0012 | -0.05730.0007 |
| A03 | 1 | 40 | 60 | -0.04490.0009 | -0.03870.0017 | -0.05350.0008 |
| A04 | 1 | 40 | 90 | -0.04510.0009 | -0.03850.0018 | -0.05270.0007 |
| A05 | 1 | 40 | 120 | -0.04540.0010 | -0.03860.0018 | -0.05380.0005 |
| A06 | 1 | 40 | 150 | -0.04550.0010 | -0.03890.0017 | -0.05580.0008 |
| A07 | 1 | 40 | 180 | -0.04340.0009 | -0.03710.0015 | -0.05330.0005 |
| B01 | 3 | 40 | 0 | -0.03150.0004 | -0.02740.0009 | -0.03530.0011 |
| B02 | 3 | 40 | 30 | -0.03640.0009 | -0.02620.0008 | -0.05190.0008 |
| B03 | 3 | 40 | 60 | -0.04000.0012 | -0.02570.0002 | -0.06030.0011 |
| B04 | 3 | 40 | 90 | -0.04160.0011 | -0.02970.0006 | -0.05960.0005 |
| B05 | 3 | 40 | 120 | -0.04190.0010 | -0.03490.0011 | -0.05920.0006 |
| B06 | 3 | 40 | 150 | -0.04270.0010 | -0.03470.0012 | -0.05670.0007 |
| B07 | 3 | 40 | 180 | -0.03650.0006 | -0.03140.0006 | -0.04660.0005 |
| C01 | 6 | 40 | 0 | -0.02650.0002 | -0.02400.0003 | -0.03100.0005 |
| C02 | 6 | 40 | 30 | -0.03260.0006 | -0.02650.0007 | -0.04260.0007 |
| C03 | 6 | 40 | 60 | -0.03310.0009 | -0.02420.0004 | -0.05160.0016 |
| C04 | 6 | 40 | 90 | -0.03850.0011 | -0.02700.0011 | -0.05760.0008 |
| C05 | 6 | 40 | 120 | -0.03910.0009 | -0.03020.0007 | -0.05460.0013 |
| C06 | 6 | 40 | 150 | -0.04110.0006 | -0.03630.0007 | -0.04900.0005 |
| C07 | 6 | 40 | 180 | -0.03420.0004 | -0.03000.0002 | -0.04310.0005 |
| D01 | 9 | 40 | 0 | -0.02280.0004 | -0.01540.0006 | -0.02470.0010 |
| D02 | 9 | 40 | 30 | -0.03020.0005 | -0.02430.0004 | -0.03620.0011 |
| D03 | 9 | 40 | 60 | -0.03160.0006 | -0.02560.0005 | -0.04290.0018 |
| D04 | 9 | 40 | 90 | -0.03700.0011 | -0.02390.0005 | -0.05700.0009 |
| D05 | 9 | 40 | 120 | -0.03800.0008 | -0.03020.0013 | -0.05050.0010 |
| D06 | 9 | 40 | 150 | -0.03720.0004 | -0.03650.0004 | -0.03950.0015 |
| D07 | 9 | 40 | 180 | -0.03250.0002 | -0.03030.0004 | -0.03610.0005 |
4.3. Particle migration
Bird et al. (2012) noticed that the processes of stellar migration induced by accretion of a population of dark matter sub-halos are distinct from those in an isolated galactic disk. They found that the migration probability of particles traces the radial mass distribution in the case of an isolated disk while in the perturbed disk this correlation is absent. Our simulations reveal that the migration probability of particles in a perturbed disk depends on the mass and orbital parameters of the merged satellite (Figure 12). The migration probability of disk particles correlates with disk surface density beyond kpc for the case of an isolated and some of the disturbed disks (see Figure 12 and top left panel of Figure 2 for a comparison with surface density). Such radial profiles of the particle migration probability are similar to the one assumed in the chemical evolution model of our Galaxy of Schönrich & Binney (2009). For the case of some other mass and orbital parameters of the merged satellite (e.g., when the satellite’s orbit lies in the disk plane) the migration probability of particles remains about constant at to 20 kpc as it found by Bird et al. (2012), but decreases with radius beyond kpc.
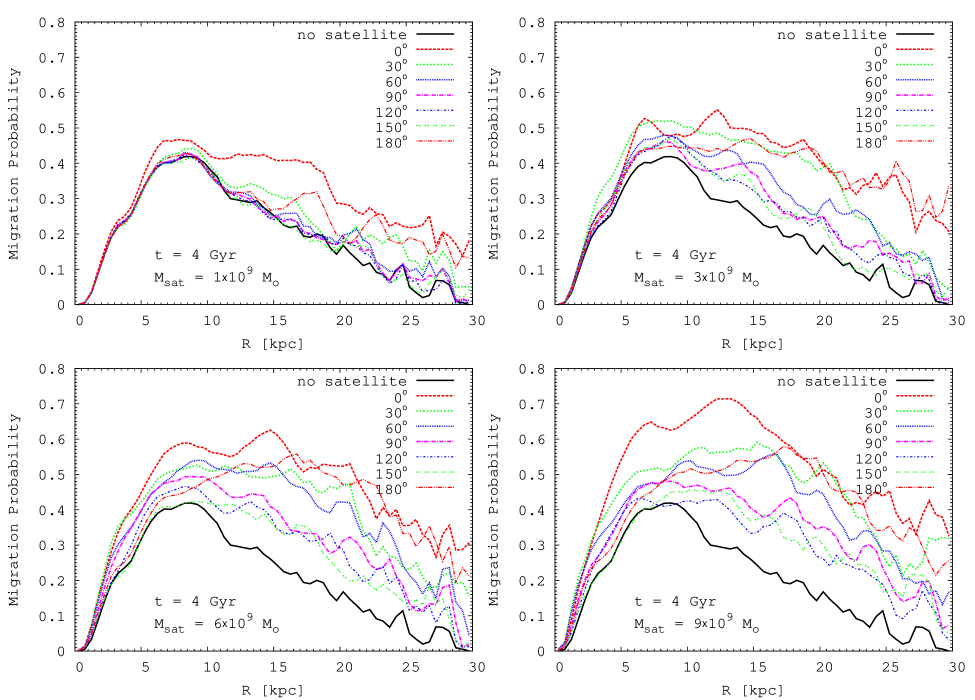
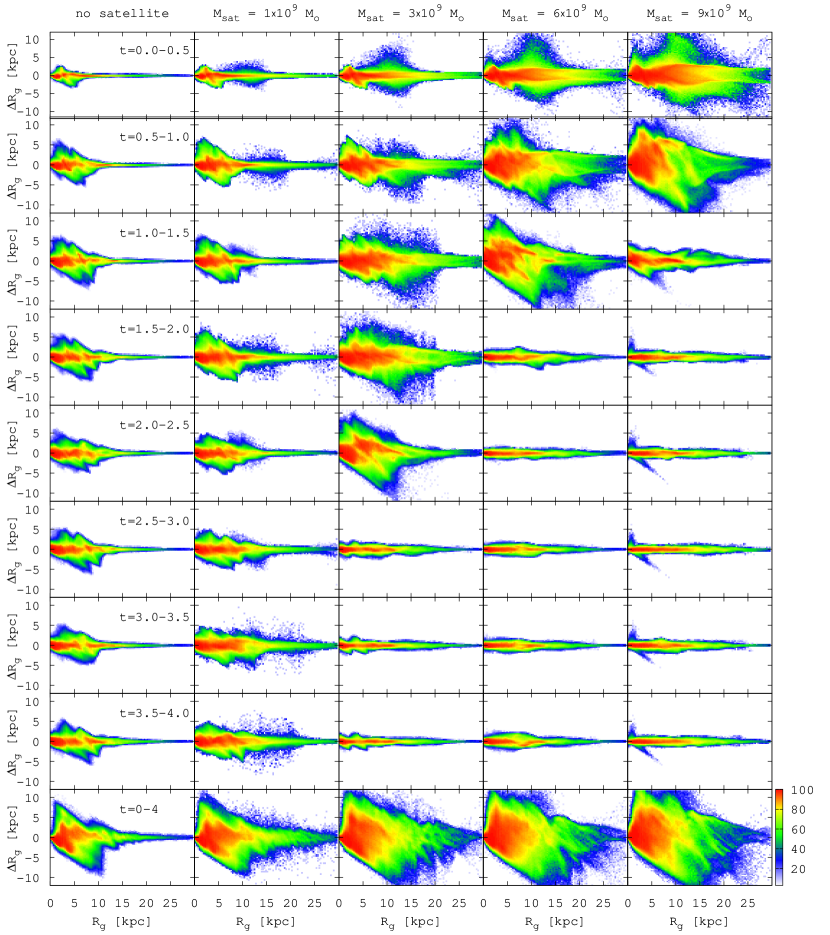
Figure 13 shows the angular momentum distribution evolution for models without satellite (A00) and with satellites of different masses from M⊙ to M⊙ (A02, B02, C02, D02). Both axes are in kpc units due to the normalization of the angular momentum by the circular velocity in the disks. All rows except for the last one represent the successive changes in angular momentum within the time interval of Gyr. The last row represents the total cumulative changes of the angular momentum from 0 to 4 Gyr. Figure 14 shows the same as the previous figure but for the angular momentum distribution evolution for models with a fixed satellite mass of M⊙ and for different initial orbital inclinations , , , and (models C01 – C04). When considering the angular momentum changes of disk particles after merging (bottom rows of Figure 13 and Figure 14) we find that the maximal changes in guiding radius decrease outwards even for models that show a fairly constant value of migration probability within to 20 kpc. Those migration patterns lead to the number of particles migrating to the outer disk region being higher than the number of those migrating in the opposite direction. Regarding metallicity profile changes this means an increase of the mean metallicity in the outer disk region as is evident from our metallicity profile plots discussed above. The comparison of angular momentum changes in short time bins of Gyr for isolated and perturbed disks (Figure 13 and Figure 14) indicate that the accretion of a satellite may result in the suppression of further changes of angular momentum of the disk particles . This can be attributed to the suppression of non-axisymmetric patterns induced by the central bar after merging (see discussion below).
Thus, the role of satellite accretion in inducing radial migration of the disk particles strongly depends on the orbit orientation and mass of the satellite. In general, the combined effects of spiral structure and bar patterns with satellite-induced migration mechanisms can produce very sophisticated migration patterns.
4.4. Fourier analysis
We calculate the discrete Fourier transform of the bulge+disk surface density. We divide the galactic disk in concentric rings and define the Fourier amplitude coefficient from to in each ring.
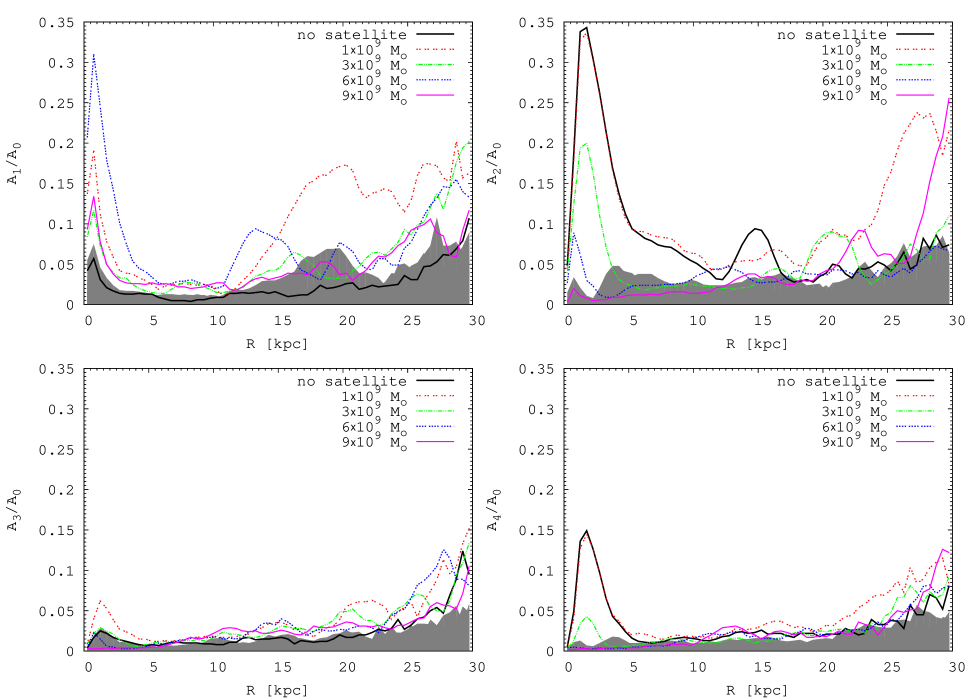
Figure 15 shows the radial dependence of the mean Fourier amplitudes /, /, /, and / from the bulge+disk surface density at a time bin near 4 Gyr (averaged from 19 snapshots at time intervals from 3.8 to 4.2 Gyr) for the model A00 (without satellite) and the models A02, B02, C02, and D02 (with satellites of different masses). The gray regions are estimates of the significance limits of the Fourier amplitudes, i.e., the standard deviation of the values of the Fourier amplitudes obtained from 19 snapshots at the mentioned time intervals from 3.8 to 4.2 Gyr. Since the standard deviations of the values of the Fourier amplitudes for the models A00, A02, B02, C02, and D02 have comparable radial profiles, we plot only the maximal value of the standard deviation of the presented models. In all cases halo and satellite particles were not taken into account. All Fourier amplitudes are normalized by the main axisymmetric component . High amplitudes of / in the central disk region clearly confirm the existence of the central bar. Our simulations show that the host galaxy bar strength (in the terms of their Fourier amplitudes /) becomes weaker for lower-mass ratios of the merged galaxies.
5. Conclusions
We investigate the dynamical interaction and merging of a Milky Way-like galaxy (host galaxy) with low-mass satellites (mass ratio 1:70 – 1:8) during the last four Gyr. We use more than 7.4 million N-body particles to study the dynamical evolution of such systems (2 million particles for the disk, 0.4 million for the bulge, and 5 million for the halo of the host galaxy and between 33000 to 300000 for a satellite). We examine the possible changes of the radial abundance gradient in the disk of the host galaxy caused by particle migration induced by the merger or interaction. The initial abundance distribution in the disk of the host galaxy is assumed to be an exponential (linear in (O/H) scale). We computed a large set of mergers with different initial configurations, i.e., with different satellite masses, positions, and orbital velocities. We consider the evolution of a system over the period of 4 Gyr without star formation.
We find that there are no significant metallicity changes at any radius due to particle migration in the case of the accretion of a low-mass satellite of M⊙ (mass ratio 1:70) except for the special case of prograde satellite motion in the disk plane of the host galaxy. In general, the change in the abundance distribution in the disk of the host galaxy depends not only on the satellite mass but also on the initial inclination of the satellite orbit. The largest changes take place if the satellite orbit lies in the disk plane of the host galaxy with prograde motion (), i.e., the satellite moves through the disk in the direction of the host galaxy rotation. The smallest (if any) changes take place if the satellite has an initial retrograde orbital motion with an orbital inclination to 150∘. Abundances at galactocentric distances larger than kpc can show a significant increase in the case of accretion of a satellite with a mass M⊙ (mass ratio 1:23).
The merger can result in a change of the slope of the abundance gradient. The radial abundance gradient within the central region of the disk of the host is rather weakly affected by a merger with a satellite of a mass up to M⊙. The radial abundance gradient flattens in the range of galactocentric distances from 5 to 15 kpc in the case of a merger with a satellite of a mass M⊙. There is no significant change in the abundance gradient slope in the outer disk ( 15 kpc – 25 kpc) in any merger while the scatter in metallicities at a given radius increases significantly for most of the satellite initial masses/positions compared to the isolated galaxy case. Assuming a mass-to-light ratio in the B band of (Flynn et al., 2006), the optical () radius of our host galaxy is 15 kpc. This argues against attributing the break (flattening) of the abundance gradient near the optical radius observed in the extended disks of Milky Way-like galaxies exclusively to merger-induced stellar migration.
Acknowledgments
We acknowledge the financial support by the Deutsche Forschungsgemeinschaft (DFG) through SFB 881 “The Milky Way System” at the Ruprecht-Karls-Universität Heidelberg, particularly through the subprojects A2, A5, and Z2. IAZ and PB acknowledge also the special support by the NASU under the Main Astronomical Observatory GRID/GPU computing cluster golowood project. The main part of the simulations presented here was performed on the dedicated GPU clusters hydra & kepler at the ARI, funded under the grants I/80 041-043 and I/81 396 of the Volkswagen Foundation and the grants 823.219-439/30 and /36 of the Ministry of Science, Research and the Arts of Baden-Württemberg, Germany. In addition, part of the code development work was conducted using the resources of the GPU cluster laohu at the Center of Information and Computing at the National Astronomical Observatories, Chinese Academy of Sciences, funded by the Ministry of Finance of People’s Republic of China under the grant ZDYZ2008-2. PB acknowledges support by the “Qianren” (Thousand Talent) special foreign experts program of China (Project P.I. R. Spurzem). This work was partly funded by the subsidy allocated to Kazan Federal University for the state assignment in the sphere of scientific activities (L.S.P.). We are grateful to the referee for his or her constructive comments which significantly improved the quality of the paper.
References
- Andrievsky et al. (2002a) Andrievsky, S. M., Kovtyukh, V. V., Luck, R. E., et al. 2002a, A&A, 392, 491
- Andrievsky et al. (2002b) —. 2002b, A&A, 381, 32
- Barnes & Hut (1986) Barnes, J., & Hut, P. 1986, Nature, 324, 446
- Bédorf et al. (2012a) Bédorf, J., Gaburov, E., & Portegies Zwart, S. 2012a, in Astronomical Society of the Pacific Conference Series, Vol. 453, Advances in Computational Astrophysics: Methods, Tools, and Outcome, ed. R. Capuzzo-Dolcetta, M. Limongi, & A. Tornambè, 325
- Bédorf et al. (2012b) Bédorf, J., Gaburov, E., & Portegies Zwart, S. 2012b, Bonsai: N-body GPU tree-code, astrophysics Source Code Library, ascl:1212.001
- Bien et al. (2008) Bien, R., Just, A., Berczik, P., & Berentzen, I. 2008, Astronomische Nachrichten, 329, 1029
- Bird et al. (2012) Bird, J. C., Kazantzidis, S., & Weinberg, D. H. 2012, MNRAS, 420, 913
- Bird et al. (2013) Bird, J. C., Kazantzidis, S., Weinberg, D. H., et al. 2013, ApJ, 773, 43
- Bragaglia et al. (2008) Bragaglia, A., Sestito, P., Villanova, S., et al. 2008, A&A, 480, 79
- Bresolin et al. (2012) Bresolin, F., Kennicutt, R. C., & Ryan-Weber, E. 2012, ApJ, 750, 122
- Bresolin et al. (2009) Bresolin, F., Ryan-Weber, E., Kennicutt, R. C., & Goddard, Q. 2009, ApJ, 695, 580
- Casagrande et al. (2011) Casagrande, L., Schönrich, R., Asplund, M., et al. 2011, A&A, 530, A138
- Daflon & Cunha (2004) Daflon, S., & Cunha, K. 2004, ApJ, 617, 1115
- Flynn et al. (2006) Flynn, C., Holmberg, J., Portinari, L., Fuchs, B., & Jahreiß, H. 2006, MNRAS, 372, 1149
- Friedli et al. (1994) Friedli, D., Benz, W., & Kennicutt, R. 1994, ApJ, 430, L105
- Fukushige et al. (1991) Fukushige, T., Ito, T., Makino, J., et al. 1991, PASJ, 43, 841
- Fukushige et al. (2005) Fukushige, T., Makino, J., & Kawai, A. 2005, PASJ, 57, 1009
- Gil de Paz et al. (2007) Gil de Paz, A., Boissier, S., Madore, B. F., et al. 2007, ApJS, 173, 185
- Goddard et al. (2011) Goddard, Q. E., Bresolin, F., Kennicutt, R. C., Ryan-Weber, E. V., & Rosales-Ortega, F. F. 2011, MNRAS, 412, 1246
- Haywood et al. (2013) Haywood, M., Di Matteo, P., Lehnert, M. D., Katz, D., & Gómez, A. 2013, A&A, 560, A109
- Ibata et al. (1994) Ibata, R. A., Gilmore, G., & Irwin, M. J. 1994, Nature, 370, 194
- Ibata et al. (1995) —. 1995, MNRAS, 277, 781
- Just et al. (2011) Just, A., Khan, F. M., Berczik, P., Ernst, A., & Spurzem, R. 2011, MNRAS, 411, 653
- Kazantzidis et al. (2008) Kazantzidis, S., Bullock, J. S., Zentner, A. R., Kravtsov, A. V., & Moustakas, L. A. 2008, ApJ, 688, 254
- Kewley et al. (2010) Kewley, L. J., Rupke, D., Zahid, H. J., Geller, M. J., & Barton, E. J. 2010, ApJ, 721, L48
- Kudritzki et al. (2014) Kudritzki, R.-P., Urbaneja, M. A., Bresolin, F., Hosek, Jr., M. W., & Przybilla, N. 2014, ApJ, 788, 56
- Kuijken & Dubinski (1995) Kuijken, K., & Dubinski, J. 1995, MNRAS, 277, 1341
- Lemasle et al. (2008) Lemasle, B., François, P., Piersimoni, A., et al. 2008, A&A, 490, 613
- Lemasle et al. (2013) Lemasle, B., François, P., Genovali, K., et al. 2013, A&A, 558, A31
- Luck & Lambert (2011) Luck, R. E., & Lambert, D. L. 2011, AJ, 142, 136
- Maciel & Costa (2010) Maciel, W. J., & Costa, R. D. D. 2010, in IAU Symposium, Vol. 265, Chemical Abundances in the Universe: Connecting First Stars to Planets, ed. K. Cunha, M. Spite, & B. Barbuy, 317–324
- Makino (1991) Makino, J. 1991, PASJ, 43, 621
- Martin & Roy (1995) Martin, P., & Roy, J.-R. 1995, ApJ, 445, 161
- Mayor (1976) Mayor, M. 1976, in IAU Symposium, Vol. 72, Abundance Effects in Classification, ed. B. Hauck, P. C. Keenan, & W. W. Morgan, 207
- Minchev et al. (2013) Minchev, I., Chiappini, C., & Martig, M. 2013, A&A, 558, A9
- Minchev et al. (2014) —. 2014, A&A, 572, A92
- Minchev & Famaey (2010) Minchev, I., & Famaey, B. 2010, ApJ, 722, 112
- Monaco et al. (2004) Monaco, L., Bellazzini, M., Ferraro, F. R., & Pancino, E. 2004, MNRAS, 353, 874
- Montuori et al. (2010) Montuori, M., Di Matteo, P., Lehnert, M. D., Combes, F., & Semelin, B. 2010, A&A, 518, A56
- Pasetto et al. (2011) Pasetto, S., Grebel, E. K., Berczik, P., Chiosi, C., & Spurzem, R. 2011, A&A, 525, A99
- Pasetto et al. (2010) Pasetto, S., Grebel, E. K., Berczik, P., Spurzem, R., & Dehnen, W. 2010, A&A, 514, A47
- Patterson et al. (2012) Patterson, M. T., Walterbos, R. A. M., Kennicutt, R. C., Chiappini, C., & Thilker, D. A. 2012, MNRAS, 422, 401
- Pedicelli et al. (2009) Pedicelli, S., Bono, G., Lemasle, B., et al. 2009, A&A, 504, 81
- Peimbert (1979) Peimbert, M. 1979, in IAU Symposium, Vol. 84, The Large-Scale Characteristics of the Galaxy, ed. W. B. Burton, 307–315
- Perez et al. (2011) Perez, J., Michel-Dansac, L., & Tissera, P. B. 2011, MNRAS, 417, 580
- Pilyugin et al. (2003) Pilyugin, L. S., Ferrini, F., & Shkvarun, R. V. 2003, A&A, 401, 557
- Pilyugin et al. (2014) Pilyugin, L. S., Grebel, E. K., & Kniazev, A. Y. 2014, AJ, 147, 131
- Pilyugin et al. (2012) Pilyugin, L. S., Grebel, E. K., & Mattsson, L. 2012, MNRAS, 424, 2316
- Pilyugin et al. (2004) Pilyugin, L. S., Vílchez, J. M., & Contini, T. 2004, A&A, 425, 849
- Quillen et al. (2009) Quillen, A. C., Minchev, I., Bland-Hawthorn, J., & Haywood, M. 2009, MNRAS, 397, 1599
- Roškar et al. (2008) Roškar, R., Debattista, V. P., Quinn, T. R., Stinson, G. S., & Wadsley, J. 2008, ApJ, 684, L79
- Rupke et al. (2010) Rupke, D. S. N., Kewley, L. J., & Barnes, J. E. 2010, ApJ, 710, L156
- Sánchez et al. (2014) Sánchez, S. F., Rosales-Ortega, F. F., Iglesias-Páramo, J., et al. 2014, A&A, 563, A49
- Scarano et al. (2011) Scarano, Jr., S., Lépine, J. R. D., & Marcon-Uchida, M. M. 2011, MNRAS, 412, 1741
- Schönrich & Binney (2009) Schönrich, R., & Binney, J. 2009, MNRAS, 396, 203
- Searle (1971) Searle, L. 1971, ApJ, 168, 327
- Sellwood & Binney (2002) Sellwood, J. A., & Binney, J. J. 2002, MNRAS, 336, 785
- Shields & Searle (1978) Shields, G. A., & Searle, L. 1978, ApJ, 222, 821
- Shumakova & Berczik (2005) Shumakova, T. A., & Berczik, P. P. 2005, Kinematika i Fizika Nebesnykh Tel, 21, 288
- Thilker et al. (2007) Thilker, D. A., Bianchi, L., Meurer, G., et al. 2007, ApJS, 173, 538
- Toomre (1964) Toomre, A. 1964, ApJ, 139, 1217
- Vila-Costas & Edmunds (1992a) Vila-Costas, M. B., & Edmunds, M. G. 1992a, MNRAS, 259, 121
- Vila-Costas & Edmunds (1992b) —. 1992b, MNRAS, 259, 121
- Werk et al. (2011) Werk, J. K., Putman, M. E., Meurer, G. R., & Santiago-Figueroa, N. 2011, ApJ, 735, 71
- Werk et al. (2010) Werk, J. K., Putman, M. E., Meurer, G. R., et al. 2010, ApJ, 715, 656
- Yong et al. (2012) Yong, D., Carney, B. W., & Friel, E. D. 2012, AJ, 144, 95
- Zahid & Bresolin (2011) Zahid, H. J., & Bresolin, F. 2011, AJ, 141, 192
- Zaritsky et al. (1994) Zaritsky, D., Kennicutt, Jr., R. C., & Huchra, J. P. 1994, ApJ, 420, 87