Coevolution Between Supermassive Black Holes and Bulges Is Not Via Internal Feedback Regulation But By Rationed Gas Supply Due To Angular Momentum Distribution
Abstract
We reason that, without physical fine-tuning, neither the supermassive black holes (SMBHs) nor the stellar bulges can self-regulate or inter-regulate by driving away already fallen cold gas to produce the observed correlation between them. We suggest an alternative scenario where the observed mass ratios of the SMBHs to bulges reflect the angular momentum distribution of infallen gas such that the mass reaching the stable accretion disc is a small fraction of that reaching the bulge region, averaged over the cosmological time scales. We test this scenario using high resolution, large-scale cosmological hydrodynamic simulations (without AGN feedback), assuming the angular momentum distribution of gas landing in the bulge region to yield a Mestel disc that is supported by independent simulations resolving the Bondi radii of SMBHs. A mass ratio of between the very low angular momentum gas that free-falls to the sub-parsec region to accrete to the SMBH and the overall star formation rate is found. This ratio is found to increase with increasing redshift to within a factor of , suggesting that the SMBH to bulge ratio is nearly redshift independent, with a modest increase with redshift, a testable prediction. Furthermore, the duty cycle of active galactic nuclei (AGN) with high Eddington ratios is expected to increase significantly with redshift. Finally, while SMBHs and bulges are found to coevolve on Myr time scales or longer, there is indication that, on shorer time scales, the SMBH accretion rate and star formation may be less correlated.
1 Introduction
There is mounting evidence that massive bulges in the nearby universe harbor central SMBHs of mass . The correlation between SMBH mass () and the bulge (BG) mass () or velocity dispersion () (e.g., Magorrian et al., 1998; Richstone et al., 1998; Gebhardt et al., 2000; Ferrarese & Merritt, 2000; Tremaine et al., 2002) suggests coevolution. Although alternative models for producing this observed relation are available (e.g., Ostriker, 2000; Adams et al., 2001; Colgate et al., 2003; Cen, 2007), the correlation is often construed as evidence for AGN feedback to regulate the growth of SMBHs and bulges. The idea that AGN feedback may alleviate problems in galaxy formation models (e.g., Kauffmann & Haehnelt, 2000; Croton et al., 2006; Somerville et al., 2008) further enhances its appeal. The three-dimensional hydrodynamic simulations successfully reproduced the observed / ratio (e.g., Di Matteo et al., 2005; Hopkins et al., 2006), providing the physical basis for this scenario.
This Letter has two goals. First, we make a qualitative examination of the implications of the observed relation between bulges and the central massive objects (CMOs), wherein the two follow a linear relation over four decades in mass. It is shown that neither the SMBHs nor the nuclear star clusters (NSCs) nor the stellar bulges could have played a dominant role in regulating the growth of any of the three components in the way of blowing away a significant fraction of gas already landed in the respective regions so as to produce the CMO-bulge relation. Second, an alternative model is put forth wherein the correlation between SMBH mass and bulge mass is dictated by the angular momentum distribution of the infalling gas. We successfully test this new scenario using ab initio Large-scale Adaptive-mesh-refinement Omniscient Zoom-In (LAOZI) cosmological hydrodynamic simulations.
2 Arguments Against Internal Regulation of the Central Components
With the ACS Virgo Cluster Survey of early-type galaxies spanning four decades in mass, Côté et al. (2006) and Ferrarese et al. (2006) find a transition at , where the brighter galaxies lack resolved stellar nuclei and SMBHs dominate the CMO mass, while fainter ones have resolved stellar nuclei that dominate the CMO mass. Furthermore, the logarithm of the mean nucleus-to-galaxy luminosity ratio in fainter, nucleated galaxies, () is indistinguishable from that of the SMBH-to-bulge mass ratio, (). A similar result is found by Wehner & Harris (2006) using a different data set. Turner et al. (2012) find an identical relation using early-type galaxies in the ACS Fornax Cluster Survey. We express the universal scaling relation between CMOs and bulges as
| (1) |
whereby with the transition between NSC and SMBH occurs at or stellar mass , and (Côté et al., 2006; Ferrarese et al., 2006; Wehner & Harris, 2006; Turner et al., 2012). One may express regulation of the growth of bulges as
| (2) |
where , and are the feedback strength coefficients per unit mass of the respective components exerted on the stellar bulge and the ejected gas mass is equal to ; is the velocity dispersion of the stellar bulge; is a parameter that absorbs uncertainties regarding the dynamics of concerned feedback processes, with for energy-conserving feedback (, and have units of energy per unit mass) and for momentum-conserving feedback (, and have units of momentum per unit mass). Note that a significant feedback regulation means .
Insights can be gained by asking the following question: Can the feedback from SMBH and NSCs conspire to regulate the growth of the stellar bulge, i.e.,
| (3) |
The single powerlaw relation between and across four decades in bulge mass can be understood, only if the negative feedback per unit stellar mass of the NSC and of the SMBH are approximately the same, , barring the unknown physical reason for the right hand side of Eq (3) - the required amount of notional feedback to regulate the bulge growth - to change character abruptly at .
Although having may be possible, it would render a negative answer to the question above (Eq 3), as follows. In the momentum driven regime, since the feedback from the nuclear cluster is subject to higher densities and shorter cooling timescales hence diminished strength in comparison to that in the stellar bulge, i.e., . In the energy driven feedback scenario, . Since , the supernova feedback from stars in the bulge would vastly exceed that from the NSC. This thus invalidates the statement that the NSC and SMBH provide the necessary feedback to regulate the growth of the bulge.
The only scenario left for the SMBH to regulate the bulge growth is to force and assume the feedback per unit SMBH mass, while constant at , to become negligible at about . In both the momentum (, Ostriker et al., 2010) and energy feedback scenario (, Faucher-Giguère & Quataert, 2012), the amount of momentum or energy per unit SMBH mass, , is ultimately proportional to the driving energy (, where is speed of light). Thus, there exists no known process to suddenly make drop to zero at some specific , while being constant otherwise.
If negative feedback is needed to internally regulate the bulge, the only alternative left is stellar feedback from bulge stars themselves, i.e.,
| (4) |
Under the assumption that the feedback strength from stars per unit mass () is constant, one obtains , which has the same dependence on as the predicted mass loading factors for both momentum () or energy () driven winds (e.g., Murray et al., 2005). Therefore, bulge self-regulation, if required, would be physically supportable and self-consistent. If bulge is self-regulated, then, under the assumption that , NSC may also be self-regulated. The correlation between and would then require that the mass loading factor for the SMBH is the same as for the NSC, i.e., , which is a fine-tuned outcome. In the absence of inter-regulation between CMOs and bulges, the proportions of the amount of gas feeding the nuclear and bulge regions must be proportional to the observed ratio.
3 An Alternative Scenario: Rationed Cold Gas Supply to Nuclear and Bulge Regions Over Cosmological Time Scales
Our arguments in the previous section indicate that the observed - correlation requires the same proportionality in the initial amounts of gas feeding the respective regions, averaged over the cosmological time scales. We test this scenario using direct cosmological simulations.
3.1 Simulation Characteristics
See Cen (2014) for a more detailed description of the ab initio LAOZI simulations. Briefly, we use the WMAP7-normalized (Komatsu et al., 2011) CDM model: , , , , and . A zoom-in box of size Mpc3 comoving is embedded in a Mpc periodic box. The maximum resolution is better than pc (physical) at all times. Star formation follows the prescription of Cen & Ostriker (1992). Supernova feedback from star formation is modeled following Cen et al. (2005) with feedback energy being distributed into 27 local gas cells weighted by the specific volume of each cell, to mimic the process of supernova blastwave propagation to channel more energy into the less dense regions. We exclude AGN feedback in order to ascertain the lack of need for it.
3.2 Construction of Gas Feeding Histories of Simulated Galaxies
Galaxies are identified using the HOP algorithm (Eisenstein & Hut, 1998) grouping stellar particles. Galaxy catalogs are constructed from to with an increment of and from to with , having a temporal resolution of Myr. For each galaxy at a genealogical line is constructed up to , where the parent of each galaxy is identified with the one at the next higher redshift with the most overlap in stellar mass. At each redshift, we compute the amount () and mean specific angular momentum () of gas in the central kpc region. To proceed, an ansatz is made: the gas mass with angular momentum lower than is . We use , which corresponds to a Mestel (1963) disc of surface density . is motivated by simulations of Hopkins & Quataert (2010, 2011) with resolution as high as 0.1pc. Figure 12 of Hopkins & Quataert (2010) shows that the evolved density runs of the gas discs, on average, follow the profile from 0.1pc to 1kpc. In all of the six individual cases with significant gas inflow, shown in Figures (2, 3) of Hopkins & Quataert (2011), the profile provides an excellent fit. We compute the 1-d stellar velocity dispersion within the effective radius for each galaxy in the simulation at any redshift and assume an SMBH of mass equal to (Tremaine et al., 2002). The Bondi radius is
| (5) |
and the specific angular momentum at is
| (6) |
The gas landing within is assumed to accrete to the SMBH, where at the disc has Toomre parameter below unity and is hence consumed by star formation. Expressing various parameters by their fiducial values, we have
| (7) |
(Eq 42, Goodman, 2003), where is radiative efficiency, luminosity in Eddington units, Mach number of the viscous disc at , and and opacity and electron-scattering opacity, respectively. Hence the feeding rate to the accretion disc that eventually accretes to the SMBH is
| (8) |
where the angular momentum at is for a Keplerian disc and is the free-fall time at kpc. For our analysis, we use
| (9) |
bearing in mind that uncertainties are at least on the order of unity. To see how uncertainty in affects results, we note, a 25% deviation in from unity causes in Eq (8) to change by a factor of , which can be compensated by adjusting each of the parameters in Eq (7) except by a factor of appropriately.
3.3 Results
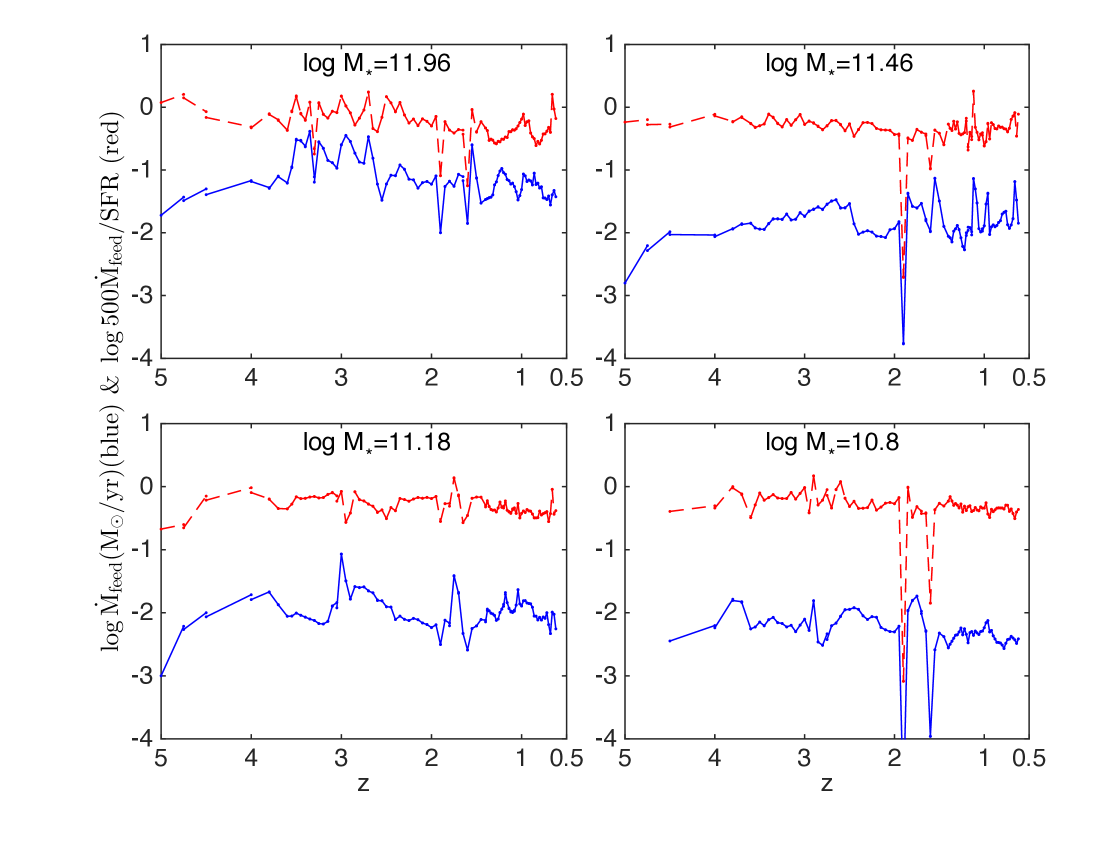
We define a ratio ( is the star formation rate) such that, if is about unity, the observed SMBH to bulge mass ratio of (e.g., Marconi & Hunt, 2003; Häring & Rix, 2004) would be borne out. Transformation from stellar disc(s) to a bulge is not addressed here. It is noted, however, that stellar discs formed from multiple gas inflows of inclined angles over the lifetime of a galaxy may be conducive to bulge formation. Note that is computed directly during the simulation, whereas the SMBH accretion rate is computed in post-processing by evaluating Eq (8). Figure 1 shows histories of (blue) and (red) for four random example galaxies. The most noticeable feature is that, without any intentional tuning, hovers close to unity with fluctuations of order unity.
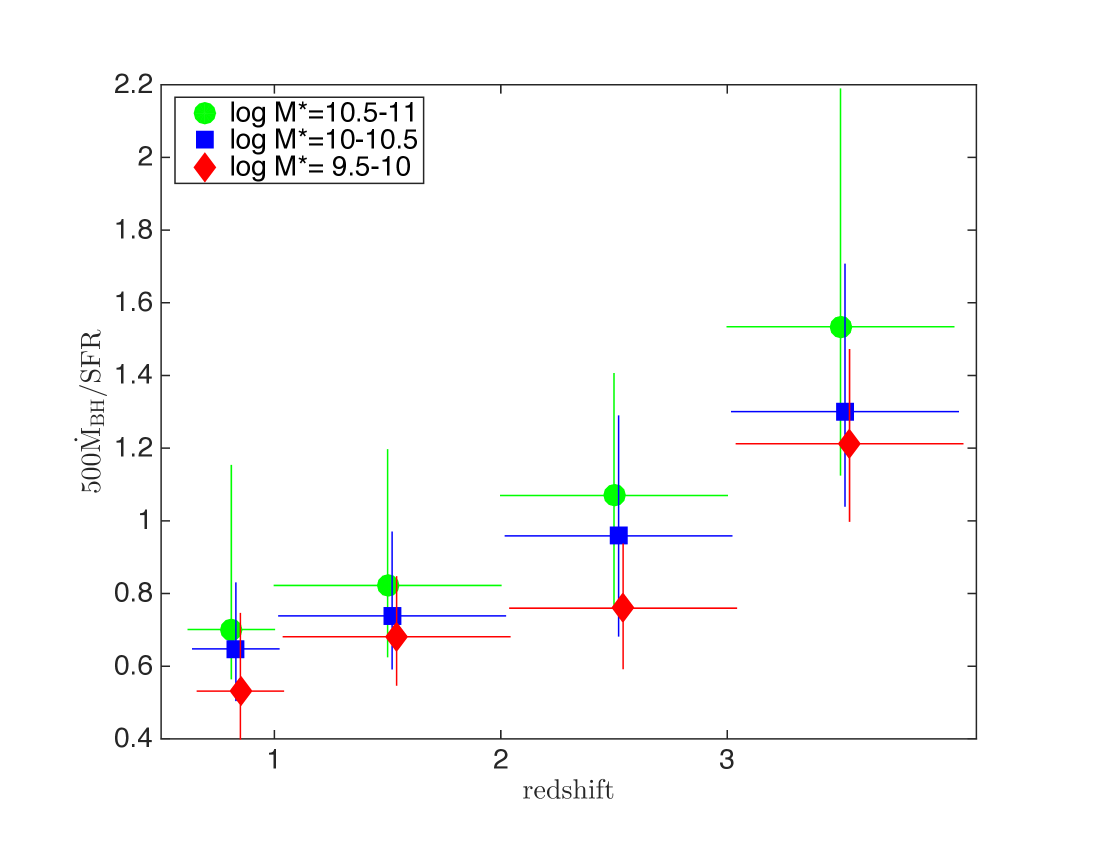
Figure 2 shows as a function of redshift. We see that increases with increasing redshift from at to at for galaxies with (green), with similar trends for other mass ranges. We highlight three implications. First, the observed SMBH to bulge ratio is readily achievable in a cosmological setting, with a slight tendency for more massive galaxies to have higher . This is due to the rationing of gas supply to the central regions of galaxies: a small amount of gas of the lowest angular momentum feeds the SMBH accretion disc, while the rest builds up the stellar bulge, with the demarcation line determined by the accretion disc stability condition. Note that our analysis is solely based on the angular momentum distribution of gas that has already landed in the central kpc region. The frequency of gas inflow events into the central regions and the mass distribution of events are computed directly in our simulations. Second, increases with increasing redshift, to within a factor of . The trend with redshift is expected in a cosmological context, because both the frequency and strength of galaxy interactions increase with increasing redshift, yielding overall inflow gas of lower angular momentum hence a larger at high redshift. Third, the smoothness of on cosmological time scales (Myr) suggests that the dispersion of is modest, around order unity, at all redshifts, consistent with the dispersion of the observed correlation locally (note that the comparison is made between computed and observed ). Future observations at high redshift may be able to test these predictions. Although is relatively smooth over cosmological time scales, the gas inflow rate varies up to an order of magnitude (Figure 1). The fluctuations in the inflow rate are caused by a variety of physical processes, including interactions between galaxies in close proximity, minor mergers and occasional major mergers. We have not studied in sufficient detail to ascertain whether secular processes play any major role.
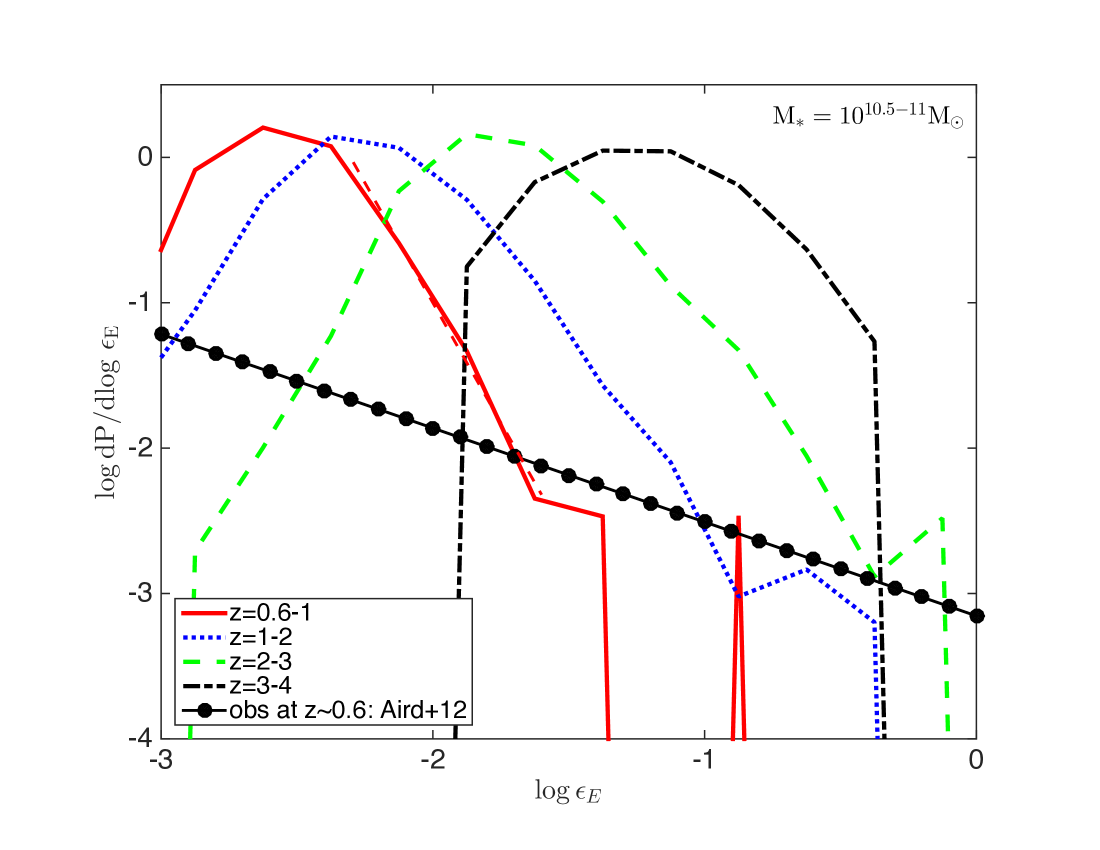
Is SMBH accretion rate directly dictated by the feeding rate from galactic scales? Figure 3 shows the probability distribution of feeding rate in units of Eddington rate as a function of Eddington ratio. The Eddington ratio is based on the assumed from the observed relation. At where comparisons with observations may be made, the computed distribution is steeper, computed slope versus observed. This indicates that accretion onto the SMBHs is “filtered" through physical processes operating on the accretion disc. This suggests that temporal correlation between AGN and star formation activities in individual galaxies below Myr is expected to be weak, in excellent agreement with observations (e.g., Hickox et al., 2014). A comparison between the distribution of the feeding rate to the accretion disc (red curve) and that of the observed Eddington ratio (black dots) suggests that at accretion discs around SMBHs spend most of the time accumulating gas, at feeding rate below Eddington ratio and that the apparent powerlaw distribution of Eddington ratio may be a result of superposition of AGN internal light profiles that are universal in shape (i.e., slope of ). We see that the computed feeding rate distribution shifts to the right dex per unit redshift, indicating that the duty cycle of luminous AGNs increases with redshift.
4 Conclusions
We have shown that, baring implausible physical fine-tuning, neither the central massive objects - SMBHs or NSCs - nor the stellar bulges can be regulated by blowing away the majority of gas that has already landed, to explain the observed CMO-bulge relation. This leaves us with only one viable option. That is, the ratio of feeding rate to the nuclear region to that to the bulge is proportioned cosmologically.
We test this scenario using high resolution, large-scale cosmological hydrodynamic simulations without AGN feedback. Our analysis finds a proportionality, , between the feeding rate of very low angular momentum gas that can free-fall to the sub-parsec region to accrete to the SMBH and the star formation rate in the galaxy. There is indication that this ratio increases with increasing redshift to within a factor of , suggesting that the SMBH to bulge ratio is nearly redshift independent, with a modest increase with redshift. We predict that the duty cycle of luminous AGNs increases with redshift. While SMBHs and bulges are found to coevolve on Myr time scales, there is indication that, on smaller time scales, the SMBH accretion and star formation may be less or not correlated, which is likely due to variations of AGN activities on smaller time scales dictated by physics of accretion disc.
While our analysis disfavor internal regulation in terms of blowing gas away with the required proportionality, “random" internal regulation by blowing some gas away without the said proportionality is not ruled out and in fact may be common, manifested as galactic superwinds or AGN winds. Nor do we disfavor feedback processes that control the overall amount of cold gas supply, termed "global feedback". Global feedback reflects the collective effects of stellar evolution (supernovae, winds, etc) and SMBH accretion (winds, radio jets, etc) as well as gravitational shock heating due to structure formation and photoionization heating, among others. They impact the thermodynamical state of the interstellar, circumgalactic and intergalactic medium. We emphasize that, even if global feedback controls the overall cold gas supply and its temporal distribution on cosmological time scales, it is not responsible for the proportional growth of SMBHs and galaxies.
An implication is that the distinction between forming a NSC or SMBH may hinge on the existence of a massive enough initial black hole seed. Thus, the demarcation bulge mass of is suggestive that only the progenitors of the massive enough galaxies have formed massive black hole seeds at some high redshift, with less massive galaxies seeded by NSCs or neither. Subsequently, those with initial massive black hole seeds are able to accrete the infallen gas and grow to SMBHs over time, whereas those without massive black hole seeds turn the infallen gas in the nuclear regions into stars to grow the NSCs. Let us suppose that CMOs of initial mass created at some high redshift in dwarf galaxies have migrated to the centers of larger galaxies to serve as central seeds. The rationed gas supply would then yield final . Thus, for those galaxies lacking significant, subsequent growth of the CMO, i.e., is not much greater than , the CMO-bulge mass scaling relation will be sublinear, which may explain the observed shallower scaling relation between NSCs and bulges at the low end of bulge mass (e.g., Erwin & Gadotti, 2012; Leigh et al., 2012; Scott & Graham, 2013; den Brok et al., 2014). Galaxies with a massive initial black hole seed may form a NSC as well, consistent with observations (e.g., Seth et al., 2008; González Delgado et al., 2008), although the stellar component in the vicinity of an SMBH may be altered by subsequent, additional processes, such inspiral of another SMBH (e.g., Milosavljević et al., 2002).
This study is related to Escala (2006, 2007), who studied gas accretion processes surrounding the SMBH; we explicitly avoid detailed accretion physics by focusing on the amount of mass that enters the “feeding" zone to the SMBH. This work reaches conclusions similar to that of Anglés-Alcázar et al. (2015) with respect to the ratio, with a contrasting difference on the role of feedback. While Anglés-Alcázar et al. (2015) requires that only a small fraction of the gas at subparsec scales is actually accreted by the SMBH, with the rest lost to winds and outflows, we suggest that the gas disc beyond the Toomre unstable radius is instead consumed by star formation, without requiring blowing away most of the gas by the SMBH.
I am indebted to an anonymous referee for the most detailed, cogent, critical yet civilized reports, which have immensely helped improve the presentation and clarify numerous issues. I thank Dr. Guangtun Zhu for very helpful discussion. This work is supported in part by grant NASA NNX11AI23G.
Conclusions
- Adams et al. (2001) Adams, F. C., Graff, D. S., & Richstone, D. O. 2001, ApJ, 551, L31
- Aird et al. (2012) Aird, J., Coil, A. L., Moustakas, J., Blanton, M. R., Burles, S. M., Cool, R. J., Eisenstein, D. J., Smith, M. S. M., Wong, K. C., & Zhu, G. 2012, ApJ, 746, 90
- Anglés-Alcázar et al. (2015) Anglés-Alcázar, D., Özel, F., Davé, R., Katz, N., Kollmeier, J. A., & Oppenheimer, B. D. 2015, ApJ, 800, 127
- Cen (2007) Cen, R. 2007, ApJ, 654, L37
- Cen (2014) —. 2014, ApJ, 781, 38
- Cen et al. (2005) Cen, R., Nagamine, K., & Ostriker, J. P. 2005, ApJ, 635, 86
- Cen & Ostriker (1992) Cen, R., & Ostriker, J. P. 1992, ApJ, 399, L113
- Colgate et al. (2003) Colgate, S. A., Cen, R., Li, H., Currier, N., & Warren, M. S. 2003, ApJ, 598, L7
- Côté et al. (2006) Côté, P., Piatek, S., Ferrarese, L., Jordán, A., Merritt, D., Peng, E. W., Haşegan, M., Blakeslee, J. P., Mei, S., West, M. J., Milosavljević, M., & Tonry, J. L. 2006, ApJS, 165, 57
- Croton et al. (2006) Croton, D. J., Springel, V., White, S. D. M., De Lucia, G., Frenk, C. S., Gao, L., Jenkins, A., Kauffmann, G., Navarro, J. F., & Yoshida, N. 2006, MNRAS, 365, 11
- den Brok et al. (2014) den Brok, M., Peletier, R. F., Seth, A., Balcells, M., Dominguez, L., Graham, A. W., Carter, D., Erwin, P., Ferguson, H. C., Goudfrooij, P., Guzman, R., Hoyos, C., Jogee, S., Lucey, J., Phillipps, S., Puzia, T., Valentijn, E., Verdoes Kleijn, G., & Weinzirl, T. 2014, ArXiv e-prints
- Di Matteo et al. (2005) Di Matteo, T., Springel, V., & Hernquist, L. 2005, Nature, 433, 604
- Eisenstein & Hut (1998) Eisenstein, D. J., & Hut, P. 1998, ApJ, 498, 137
- Erwin & Gadotti (2012) Erwin, P., & Gadotti, D. A. 2012, Advances in Astronomy, 2012, 4
- Escala (2006) Escala, A. 2006, ApJ, 648, L13
- Escala (2007) —. 2007, ApJ, 671, 1264
- Faucher-Giguère & Quataert (2012) Faucher-Giguère, C.-A., & Quataert, E. 2012, MNRAS, 425, 605
- Ferrarese et al. (2006) Ferrarese, L., Côté, P., Dalla Bontà, E., Peng, E. W., Merritt, D., Jordán, A., Blakeslee, J. P., Haşegan, M., Mei, S., Piatek, S., Tonry, J. L., & West, M. J. 2006, ApJ, 644, L21
- Ferrarese & Merritt (2000) Ferrarese, L., & Merritt, D. 2000, ApJ, 539, L9
- Gebhardt et al. (2000) Gebhardt, K., Bender, R., Bower, G., Dressler, A., Faber, S. M., Filippenko, A. V., Green, R., Grillmair, C., Ho, L. C., Kormendy, J., Lauer, T. R., Magorrian, J., Pinkney, J., Richstone, D., & Tremaine, S. 2000, ApJ, 539, L13
- González Delgado et al. (2008) González Delgado, R. M., Pérez, E., Cid Fernandes, R., & Schmitt, H. 2008, AJ, 135, 747
- Goodman (2003) Goodman, J. 2003, MNRAS, 339, 937
- Häring & Rix (2004) Häring, N., & Rix, H. 2004, ApJ, 604, L89
- Hickox et al. (2014) Hickox, R. C., Mullaney, J. R., Alexander, D. M., Chen, C.-T. J., Civano, F. M., Goulding, A. D., & Hainline, K. N. 2014, ApJ, 782, 9
- Hopkins et al. (2006) Hopkins, P. F., Hernquist, L., Cox, T. J., Di Matteo, T., Robertson, B., & Springel, V. 2006, ApJS, 163, 1
- Hopkins & Quataert (2010) Hopkins, P. F., & Quataert, E. 2010, MNRAS, 407, 1529
- Hopkins & Quataert (2011) —. 2011, MNRAS, 415, 1027
- Kauffmann & Haehnelt (2000) Kauffmann, G., & Haehnelt, M. 2000, MNRAS, 311, 576
- Komatsu et al. (2011) Komatsu, E., Smith, K. M., Dunkley, J., Bennett, C. L., Gold, B., Hinshaw, G., Jarosik, N., Larson, D., Nolta, M. R., Page, L., Spergel, D. N., Halpern, M., Hill, R. S., Kogut, A., Limon, M., Meyer, S. S., Odegard, N., Tucker, G. S., Weiland, J. L., Wollack, E., & Wright, E. L. 2011, ApJS, 192, 18
- Leigh et al. (2012) Leigh, N., Böker, T., & Knigge, C. 2012, MNRAS, 424, 2130
- Magorrian et al. (1998) Magorrian, J., Tremaine, S., Richstone, D., Bender, R., Bower, G., Dressler, A., Faber, S. M., Gebhardt, K., Green, R., Grillmair, C., Kormendy, J., & Lauer, T. 1998, AJ, 115, 2285
- Marconi & Hunt (2003) Marconi, A., & Hunt, L. K. 2003, ApJ, 589, L21
- Mestel (1963) Mestel, L. 1963, MNRAS, 126, 553
- Milosavljević et al. (2002) Milosavljević, M., Merritt, D., Rest, A., & van den Bosch, F. C. 2002, MNRAS, 331, L51
- Murray et al. (2005) Murray, N., Quataert, E., & Thompson, T. A. 2005, ApJ, 618, 569
- Ostriker (2000) Ostriker, J. P. 2000, Physical Review Letters, 84, 5258
- Ostriker et al. (2010) Ostriker, J. P., Choi, E., Ciotti, L., Novak, G. S., & Proga, D. 2010, ApJ, 722, 642
- Richstone et al. (1998) Richstone, D., Ajhar, E. A., Bender, R., Bower, G., Dressler, A., Faber, S. M., Filippenko, A. V., Gebhardt, K., Green, R., Ho, L. C., Kormendy, J., Lauer, T. R., Magorrian, J., & Tremaine, S. 1998, Nature, 395, A14+
- Scott & Graham (2013) Scott, N., & Graham, A. W. 2013, ApJ, 763, 76
- Seth et al. (2008) Seth, A., Agüeros, M., Lee, D., & Basu-Zych, A. 2008, ApJ, 678, 116
- Somerville et al. (2008) Somerville, R. S., Hopkins, P. F., Cox, T. J., Robertson, B. E., & Hernquist, L. 2008, MNRAS, 391, 481
- Tremaine et al. (2002) Tremaine, S., Gebhardt, K., Bender, R., Bower, G., Dressler, A., Faber, S. M., Filippenko, A. V., Green, R., et al. 2002, ApJ, 574, 740
- Turner et al. (2012) Turner, M. L., Côté, P., Ferrarese, L., Jordán, A., Blakeslee, J. P., Mei, S., Peng, E. W., & West, M. J. 2012, ApJS, 203, 5
- Wehner & Harris (2006) Wehner, E. H., & Harris, W. E. 2006, ApJ, 644, L17