Aashiyana: Design and Evaluation of a Smart Demand-Response System for Highly-stressed Grids
Abstract
This paper targets the unexplored problem of demand response within the context of power-grids that are allowed to regularly enforce blackouts as a mean to balance supply with demand: highly-stressed grids. Currently these utilities use as a cyclic and binary (power/no-power) schedule over consumer groups leading to significant wastage of capacity and long hours of no-power. We present here a novel building DLC system, Aashiyana, that can enforce several user-defined low-power states. We evaluate distributed and centralized load-shedding schemes using Aashiyana that can, compared to current load-shedding strategy, reduce the number of homes with no power by % for minor change in the fraction of homes with full-power.
1 Introduction
Demand response (DR) is a smart-grid technology allowing grid to communicate a demand decrease request to meet supply, against traditional supply-following load behavior, using indirect (pricing) or direct (through some control) signals. Utilities prefer Direct Load Control (DLC) as it gives guaranteed reduction but is difficult for user; pricing signals leave the customer in charge but have an uncertain and possibly time-delayed demand reduction [18]. Pricing signal can also result in secondary peaks due to behavioral shift [19].
We however argue that most DLC work has focused on over-provisioned grid systems of developed countries, with a focus on increasing revenue and reliability [22], but remains largely blind to the unique characteristics of highly-stressed grids of countries (like Pakistan, Nepal, and India) with a very large and nearly continuous supply-demand gap. As an example, for Pakistan, this gap can be as high as 6GW during summers, but stays around 1.2GW even during the winter months (2011-2012) [15]. The (largely national) utilities in these countries enforce periodic events of controlled blackouts, or load-shedding, to relieve this stress. Existing DLC mechanism, in trying to balance consumer comfort with some reduction employ fine-grained (in both time and amount of load-shed) load-control, especially at residential homes [8, 9]. Such DLC allows for control events, like changing HVAC set-points, or possibly for controlling the AC for a few hours a day with over-ride facility [8]. While these mechanism are quite useful in shaving off consumption peaks and preventing peaker plants from running (thus saving money), they are inadequate in their magnitude as well as flexibility for managing the large and continuous gaps that exist in highly-stressed grids.
We believe that the consumers in a highly-stressed grid — being acclimatized to frequent blackouts — are much more amenable to aggressive DLC mechanisms and thus willing to accept a wider-range of load-shedding policies. This demand reduction, however, will have to be done through some automated system as users cannot be expected to manually respond to any, potentially large, load reduction signal. We thus propose instrumenting homes with a system that provides utilities with transitions to several low-power states that map to user-specified appliances.
In this paper we design and evaluate a novel and practical home-level DLC system solution, Aashiyana, that can implement several user-configurable power-states of a home. This system is practical as it can retrofit into the existing wiring scheme of homes; is of low cost while controlling most appliances in a home; provides home consumers a flexible way to describe these lower-power states as a compact disconnectivity matrix requiring one-time configuration.
A question remains regarding incentives for power utilities to promote a proliferation of the Aashiyana DLC system when their current strategy of full blackouts is working? We believe that for national utilities with huge demand-supply gap, possibility of social unrest and potential political backlash (for example, road-blockades and tire burnings [2]) provides an impetus for government to explore alternate solutions. Aashiyana’s penetration enables flexible and fine-grained load-shedding policies that will reduce the underload wastage from the current strategy of coarse-grained, group-level shutoff while increasing social comfort within the same supply-side constraints; a push for such schemes will thus come top-down for socio-political reasons. A bottom-up push will come as consumer penetration of Aashiyana homes increases, and people observe the increased comfort level of their neighbors.
A serendipitious benefit of our DLC mechanism would be to actually reduce the load on the grid by removing the need for battery backups, extensively used already in countries with a stressed grid. These backup solutions use inefficient battery storage to transition into a single “low-power” state, but have shown to exacerbate the supply-demand gap that leads to greater penetration of battery backup and even greater stress — a death spiral for these grids [20, 21]. Our power-control system will provide an exact substitute for these backups, but with no inefficiency since it gets its (lower) power directly from the grid.
The contribution of this paper are the following. We present the design and implementation of Aashiyana: a novel home-level DLC system that can retrofit into wiring system to enforce different power-states for a home, with the set of appliances allowed in each state defined by individual home-owner (Section 5). This provides a first, to the best of our knowledge, practical DLC mechanism for the dynamics of load-shedding of a highly-stressed grid. We propose two different DLC strategies that can be implemented now over a smart-grid and leverage any penetration level of Aashiyana to improve the social utility without requiring increased supply (Section 7) Finally, we build a custom simulator to model a stressed grid and evaluate our DLC algorithms using the flexibility offered by Aashiyana to show that for 90% penetration we can decrease by >80% the fraction of homes with no power, without significantly decreasing (in some case actually increasing) the fraction of homes with full-power (Section 8).
2 Background to Load-shedding
In this section we provide an overview to the power grid architecture and players in the power system in Pakistan, and how the demand-supply gap is monitored and converted in load-shedding schedules. While the exact details might vary across different countries, this description will give the overall flavor of the problem.
2.1 Electrical Power System in Pakistan
In Pakistan, power sector is primarily state owned, with some private sector responsible for generation. These generation units (GENCOs) work with the National Power Construction Corporation (NPCC), a central body which monitors the power grid, to asses the overall demand and operate power plants accordingly. NPCC, based on a survey done during a time with no supply shortage, decides on the allocated split of power generation across the ten major (state owned) distribution companies (DISCOs).
2.2 Current Load-shedding Schemes
Pakistan has, due to several socio-political reason, become a country which faces a nearly year round supply-demand imbalance situation [15]. Whenever demand exceeds supply, a large segment of consumers (forming a group/zone) is shutdown to reduce the overall load on the grid. The task of enforcing blackouts is accomplished at two levels: by the DISCOs and in the extreme case the NPCC.
NPCC has an estimate of generation based on their dispatch request for the upcoming 24 hrs. According to that estimate, each DISCO is allocated a certain budget (based on a ratio previously determined) and asked to not exceed that threshold, whatever might be the actual demand.
DISCOs also have an estimate of consumption from their allocated area. If this estimate is greater than their share, they initiate a schedule of load shedding across collection of feeders clustered into a zones or groups. They implement a time-disjoint blackout schedule across these groups, and increase the number of hours until they meet their quota. It is fine if DISCOs to under/over-use slightly beyond their quota, as long as the over all grid remains stable. However, if the grid is becoming unstable due to overuse, the NPCC has the nuclear option of shutting down the 132kV line to the offending DISCO(s) and restore balance to the grid. In the rest of the paper, to simplify the analysis, we consider the case of a DISCO with a particular quota as representative of this more complex load-shedding strategy.
3 Related Work
The vast majority of research in demand response has considered the issue to shifting peak demand to allow for flattening such peaks. There is, to the best of our knowledge, no work that evaluates how such algorithms will work when applied to a grid where there is a continuous demand-supply gap. Our work proposes a fine-granularity DLC mechanism that is practical and leverages the conditioning of consumers to to full blackouts in countries with highly-stressed grids. We divide our related work which focus on two different areas: grid-assisted DLC mechanisms and home-consumption changing systems.
Utilities have, for a long period of time, experimented with DLC mechanisms to share peak loads [8, 9]. These systems in the US and Canada, respectively, give consumers rebates for installing equipment to control a specific high power device (like A/C or heating units), for few hours a day. This granularity of control and load-reduction, even with high penetration, can not meet a sustained supply-demand gap in giga-watts that is typical for the highly stressed grids of countries our work targets. Perhaps the most similar work to ours is [22, 5]. Keshav and Rosenberg [22] propose a smart-grid where consumers contend to turn on appliances (proactive) or close the last appliance turned on that induces instability (reactive). iDR [5] proposes a theoretical framework that generates a signal for DR with the appropriate amount of reduction required from a consumer, such that the overall utility is maximized. Both these work do not have a practical system designed to implement their DR mechanisms, and specifically do not consider the large and continuous demand-supply gap of highly stressed grids.
The second area of research focuses on designing appliance or home level power reduction — while considering the comfort and ease of home owners [3, 11, 23, 4]. Both Yupik [3] and n-Plug [11] propose adding smart plugs to a few (deferable) appliances, whose usages patterns are monitored to present appropriate slack when a grid-stress event (demand peak) is indicated, using prices in Yupik and frequency in n-Plug. Smartcap [4] uses programmable switches or smart-appliances to control background appliances using a least-slack-first algorithm to flatten any peak. Srikantha et al. [23] evaluate how peaks can be flattened if the elastic component is allowed to be programmatically controlled. All these work seek to flatten load such that user prefernces are minimally affected; they fail to leverage (as they do not consider the problem domain) the experience of consumers in highly stressed grid that consequently face full blackouts for 12hrs a day [15]. Furthermore, these are all primarily peak-shifting algorithms; for a highly-stressed grid there is a permanent peak.
To summarize, to the best of our knowledge, no work has yet considered a) the practical concerns of cost and usability for large scale DLC in homes and b) leveraged the potential readiness of consumers in highly stressed grids for wildly different modes of demand management i.e. several levels of fixed power budgets.
4 Goals and Challenges for a Practical Home-level DLC Solution
We propose to explore flexible and fine-grained load-shedding strategies by enforcing multiple power states inside a home. To achieve such control and enable a common house to implement multiple power states, we needed to add into the existing electrical infrastructure. However, for practicality and usability concerns, we define three important goals that we want such a power-control system to achieve. To achieve this, we identified three important goals for implementation of Aashiyana.
- Low Deployment Cost (G1)
-
We want to control the power state of homes using a system that costs around ($250-$300). This price range corresponds to the cost of a battery backup, which provides a very low-power state from stored energy, that people are already comfortable purchasing. This is a challenge since making individual devices intelligent (using intelligent plugs or power strips [11, 3, 1]) is quite an expensive proposition.
- User-friendly Configurations (G2)
-
To ensure an acceptance of a power-control system, the ease with which a user can configure the system is essential. This can also correspond to a visual representation of the benefit for performing these configurations.
- Multiple Communication Strategies (G3)
-
In order to handle different mechanisms for load-shedding, we want our designed system to support several communication capabilities. Thus we would like homes within a neighborhood to communicate and also a grid-scale rendezvous mechanism for a centralized algorithm.
We next use these goals in guiding the design of Aashiyana: a prototype power control system that can retrofit111An abundance of smart-appliances is not a sound assumption in the target countries of interest. into the wiring structure of a home, and provide utility companies with an ability to reduce demand to guaranteed levels while providing consumers a way to easily configure their homes for each power level.
5 Aashiyana: A practical system to implement power control
Aashiyana is meant to be a user configurable system to enforce demand response that is acceptable to both utilities as well as consumers. Our major focus is, inline with the goals above, to design and system that can enforce a consumption budget at each home, while allowing the users the ability to flexibly configure devices running at each demand reduction level. We first describe the major design decisions for Ashiyana and then the architectural components of our demand-management solution.
5.1 Design Decisions for Aashiyana
A first design decision was to select the location and granularity of appliance control within a home. The overarching constraint in this decision was the cost constraint. For granularity we decided to restrict control to the level of switching devices on-or-off. Instrumenting any greater level of smartness would require significantly larger cost and configuration complexity.
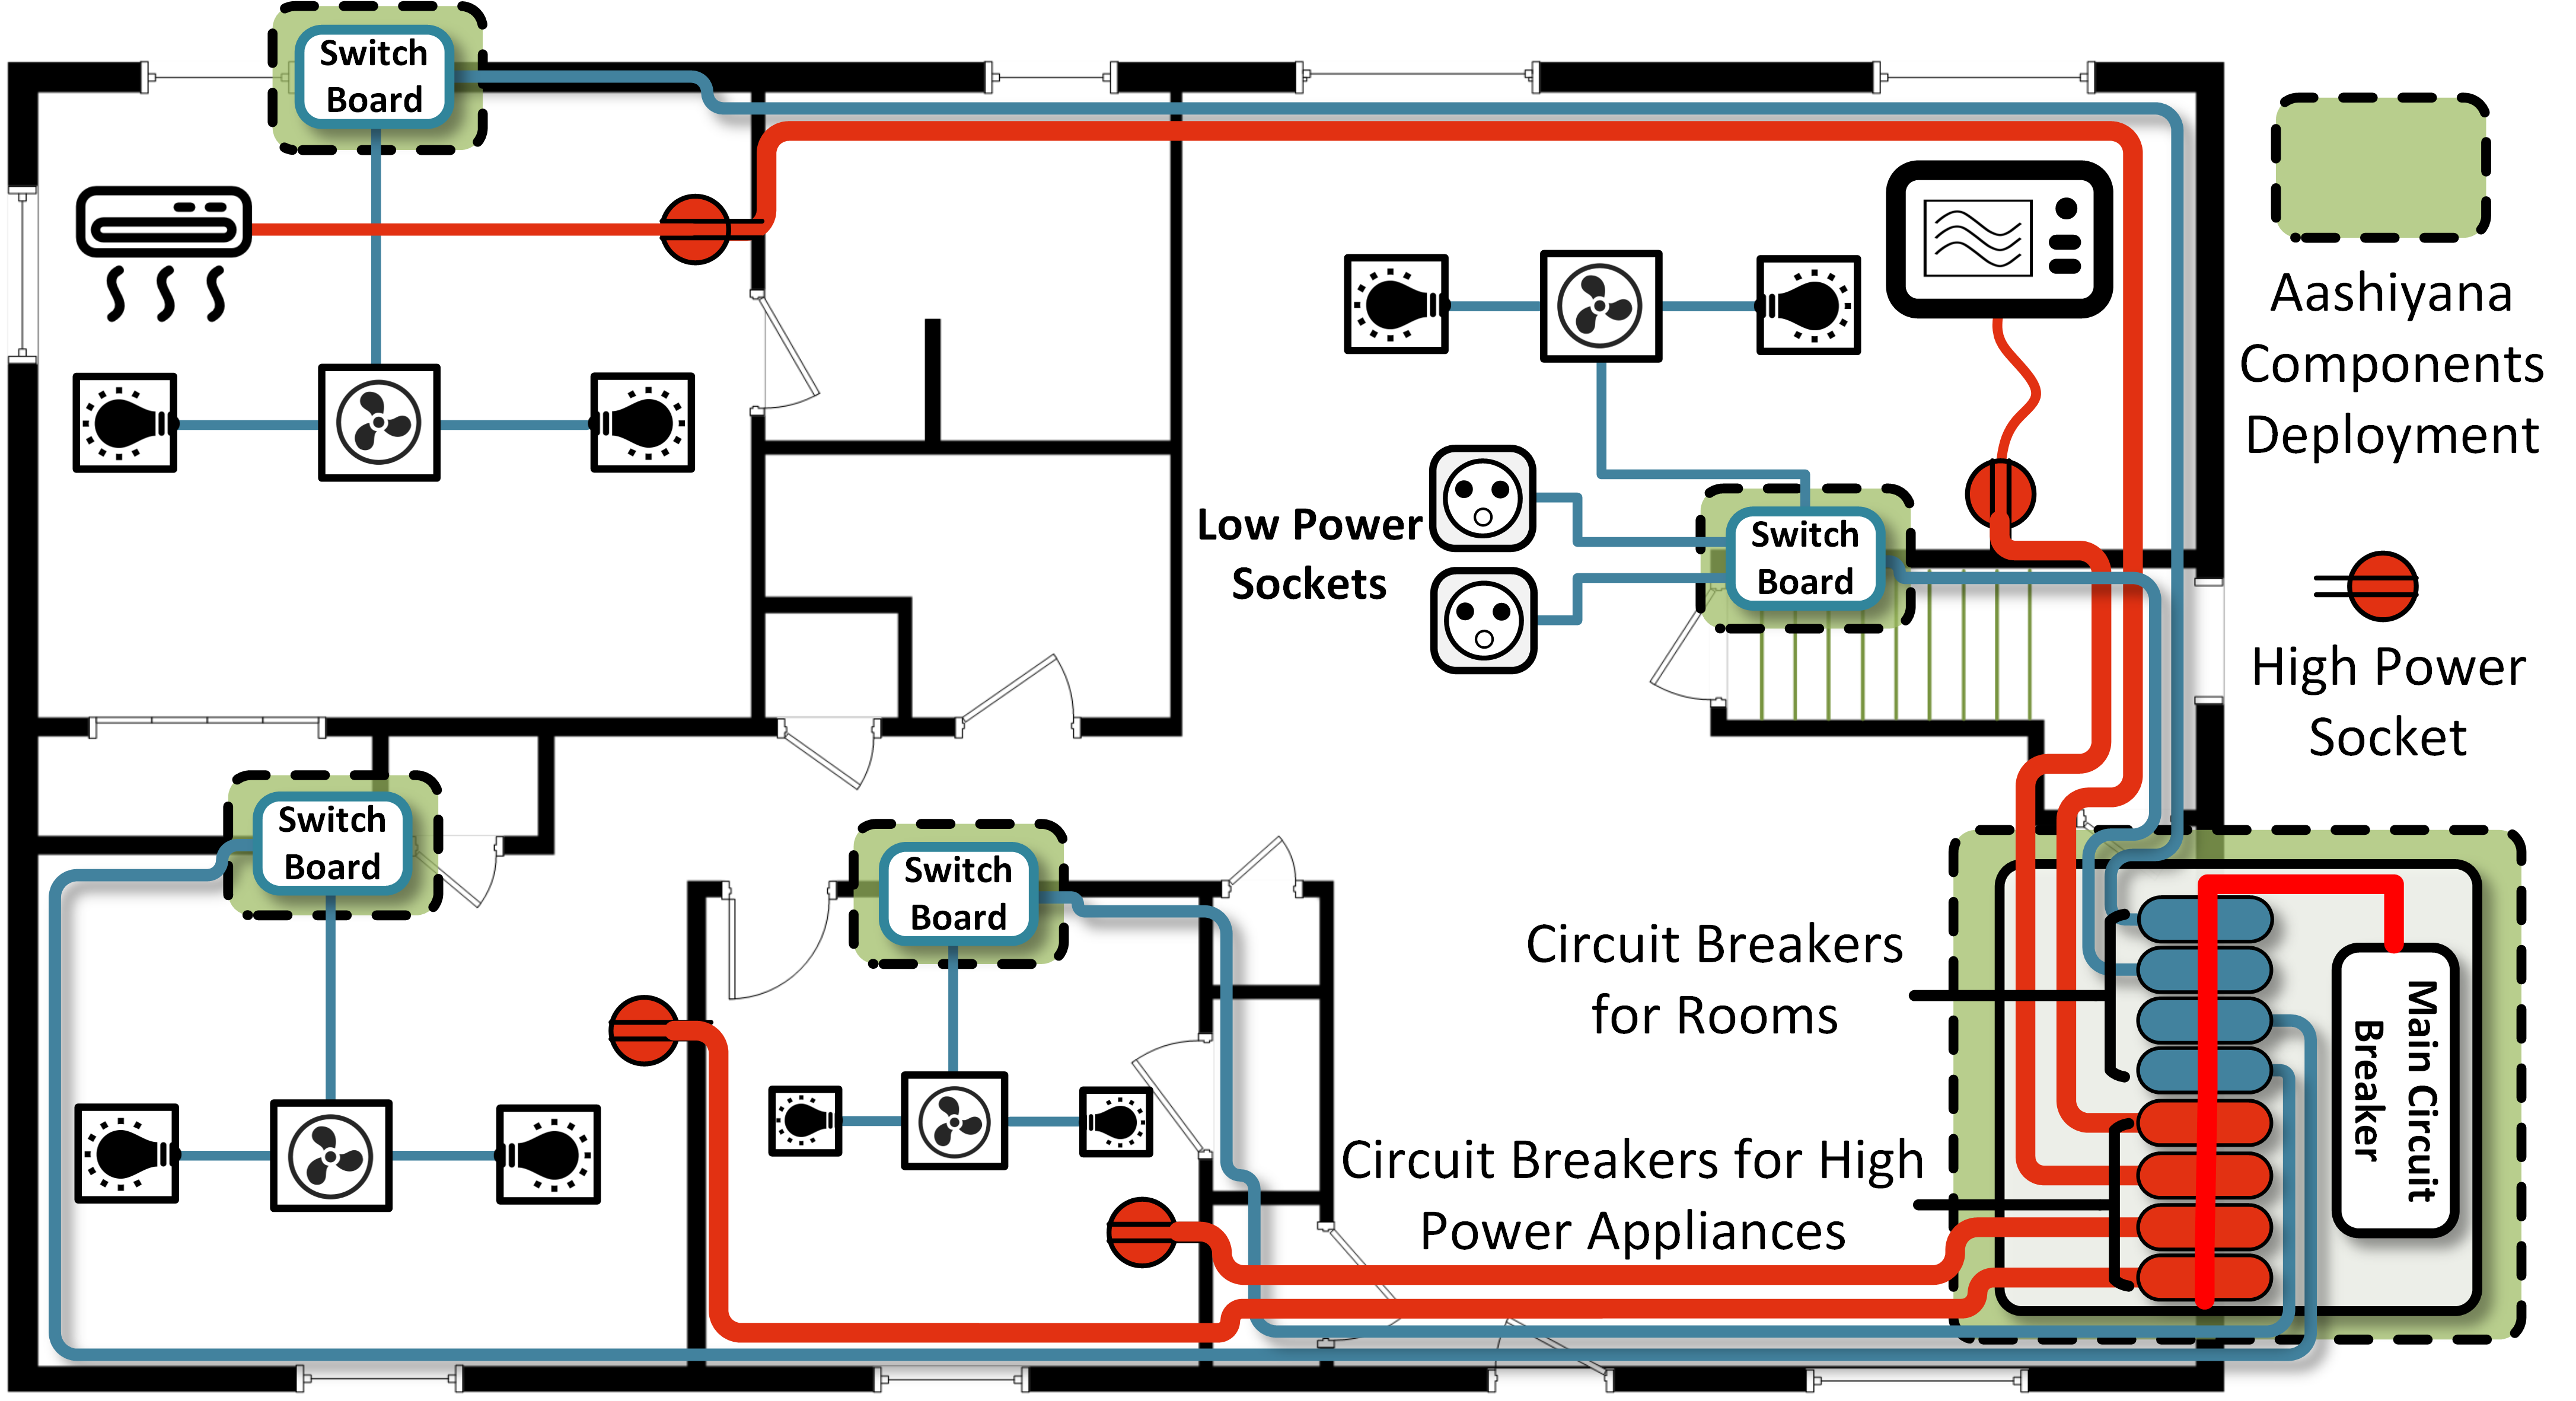
We decide on locating our two control components at the main distribution board and at the level of switch boards installed at each home, in light of the traditional wiring structure for Pakistan (Figure 2). These locations provides us sufficient control as the high-power device sockets (separate in each room for A/C, Refrigerators) are accessible from the main distribution board, while individual sockets as well as fixed appliances like fan, and lights for each are accessible from a switch box. The choice of these location, and our custom board design, leads to a price point of around $300 for a four room home (details in Section 6).
We next decided to restrict the power consumption of our homes to five levels. Level 5 and Level 1 represent the current two modes of unrestricted222limited to meter rating power consumption and full disconnection, respectively. Level 4-2 represent power consumption that is 75%, 50%, and 25% of full rated capacity. We restrict ourselves to just three configurable level to ensure ease-of-use (G2) as a user will have to supply, for each level and possibly even different time-of-day or week, a matrix of control points that will be disconnected (which we call a Disconnectivity Matrix (DM)).
Finally, we also decide on using existing building automation and IoT frameworks, like [7, 6] to enable a ease of application development and a robust rendezvous mechanism. While it is conceivable to have built a custom system to provide redirection and web service accessibility, the development overhead and reliability concerns tilted us in favor of our final decision.
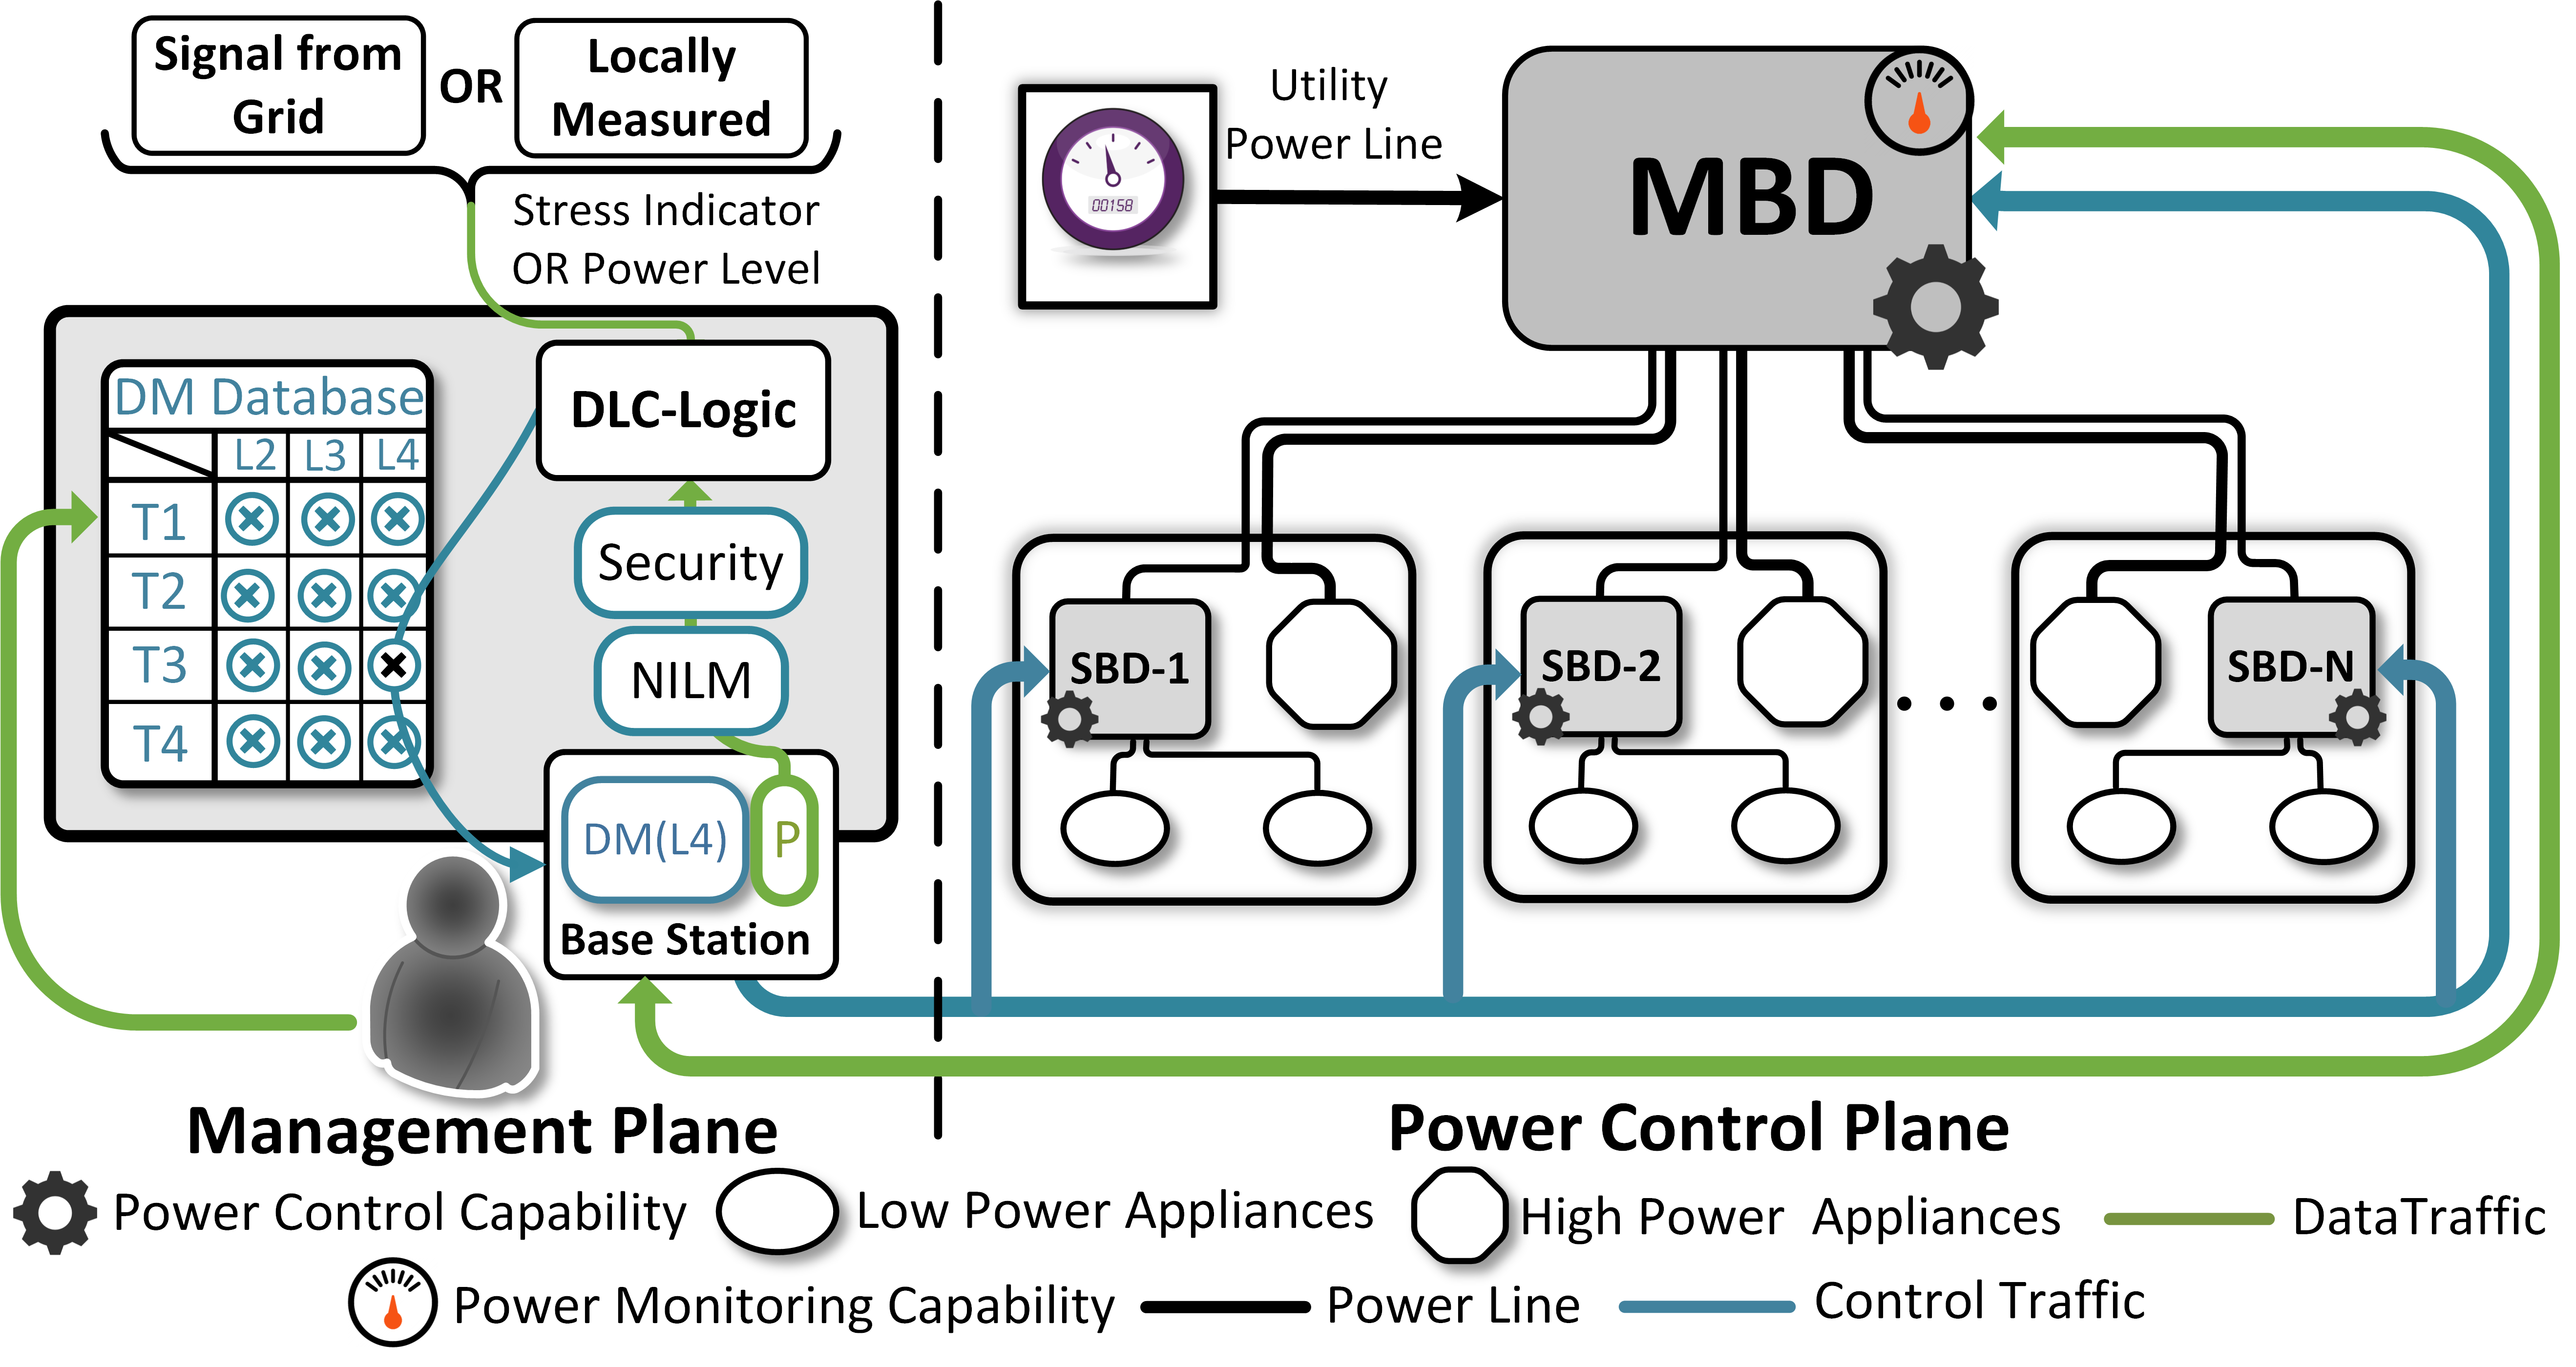
To better explain the architecture of Aashiyana, we split it into two planes (Figure 1): Management Plane and the Power Control Plane. While the home management plane implements the logic to trigger different power-levels, the power control plane enforces these states. We assume an external grid management plane that is (optionally) responsible for providing the demand-reduction signal to homes that implement Aashiyana. We detail the components in these planes next.
5.2 Power Control Plane
The power control plane consists of components that enable the enforcement of different power-states of a home. As we already argue in previous section, we have decided to control the on/off state of appliances at the level of switch boards and the main distribution board. For this purpose, we need two different control components:
- Main Board Device (MBD)
-
This component is primarily responsible for controlling all heavy appliances from one location. This control is possible from the main distribution box where, as per current wiring strategy, each high power sockets is connected via separate (higher rating) wires and circuit breakers (c.f. Figure 2). The MBD can similarly control power supply to every room as a single wire goes to the switch box of each room, and distributed to individual appliances from there. A final purpose of the MBD is to monitor the power consumption at each room level to provide monitoring ability to prevent overuse at room level. We can increase the observation granularity to socket or appliance level by using NILM techniques in the management plane, aided by state info about switches in each room. We do not use per switch power monitoring to keep the system-cost down (G1).
- Switch Board Device (SBD)
-
This component is located inside the switch board for each room, which terminates the direct line coming from the main distribution box. It is responsible, much like MBD, to control the wires distributing from this sockets. As shown in Figure 2, some wires go to hard-wired devices like fans and lights, while the rest go to individual sockets. We thus will have to infer devices connected to the sockets, while the hard-wired devices can be one-time configured.
Both these components communicate their data (power, state) to the home management plane through some IoT-based communication technology. We describe this plane next.
5.3 Management Plane
The Management Plane represents the brains behind the power-management of Aashiyana. This plane consists of a DLC-logic module as well as Base-station component that enables the communication using the IoT technology (802.15.4, Z-wave, power-line) used by the MBD and SBD.
This plane is first responsible saving user preferences in the form of a database of disconnectivity matrix (DM) for each power-state. It collects consumption data from the control plane and provides this information to users for easy selection (in line with G2) of a DM that meets a given power budget.
A second, and most important, function is to appropriately respond to a grid-stress signal. Thus, any DLC algorithm is implemented through the selection of the appropriate power-state by the DLC-logic present within this plane. Once the power level is selected the appropriate DM is used to send commands to the control plane in order to switch off power to selected points.
A final responsibility of the management plane is to perform cross device power monitoring. This capability is needed, as discussed above, to perform NILM across the SBDs. Similarly, tamper-detection and prevention strategies will also be implemented at this central location.
5.4 Grid Management Plane (optional)
The demand-reduction process initiated by the management plane requires an indication of grid-stress. While this detection can occur in a fully distributed manner at each home (by, for example, sensing frequency [11]), we expect the utilities to have some demand-response logic based on the current supply-demand gap. This logic is represented by the optional Grid Management Plane (not shown in Figure 1).
Using the Aashiyana system, the utilities now have the option to specifying five power-states (as described in Section 5.1), instead of the current two states of uninhibited consumption or a full blackout. We reiterate that these different power states are acceptable for consumers where black-outs are a regular occurrence (highly-stressed grids), but might not be equally palatable for consumers where such events are unthinkable.
6 Aashiyana: Implementation and Evaluation
In this section we present our working prototype of an Aashiyana system. We first discuss the lab-prototype home we built to emulate the wiring scheme of a home, followed by the implementation details of the hardware devices, as well as the software and communication stack to implement out system. We end the section with evaluation of the latency, reliability, and power consumption for our system.
6.1 Prototype Home
Figure 2 shows the wiring of a typical home with two types of wires going to each room from the main distribution box. The first type are the high-rating wires that go to special sockets used to connect high power devices in each room. The second type of wires terminates in each room at the switchboard level and spreads around to fixtures (fans and lights) as well as sockets. We replicate this wiring, by enlisting a professional electrician, in a prototype and scaled-down four room home (Figure 3). This home has a main distribution board with circuit breakers for each room and high power appliances. A smart-meter, courtesy of microtech [17], is installed to observe energy consumption at the home level. However, due to a proprietary protocol, we are currently using the current-cost power meter to obtain this consumption data.
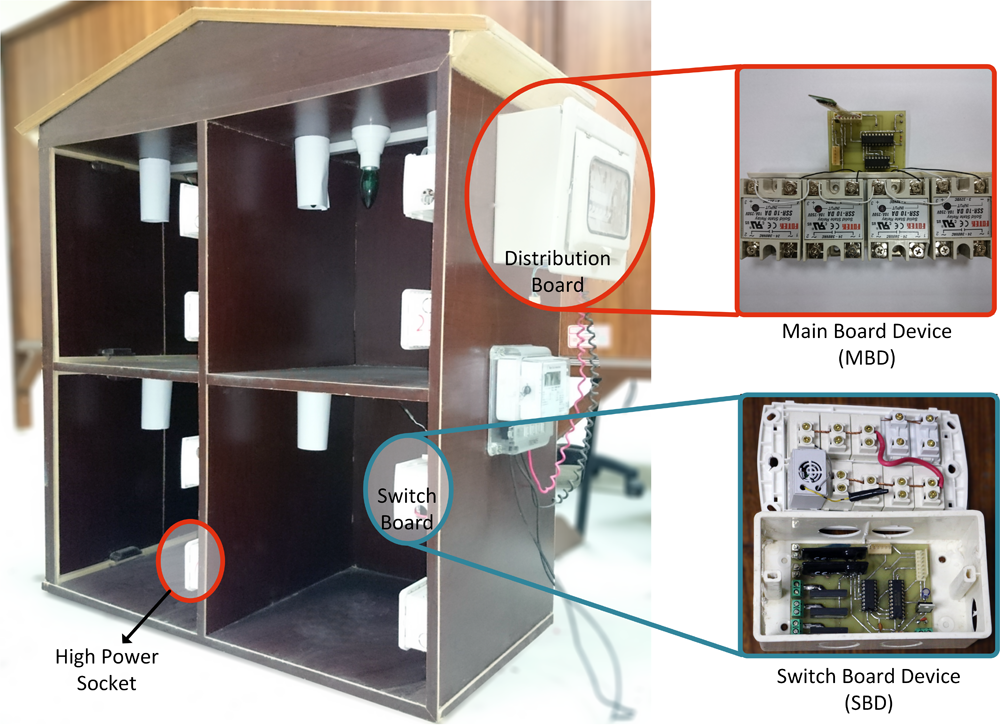
6.2 Hardware Devices
The Main Board Device (MBD) located inside the distribution box of the home consists of three major components; a communication module, a processing unit and controlling relays. We had wi-fi, PLC, and RF as candidates for communication technologies. Keeping in mind our cost constraints, we opted for a CC2500 RF module, having cost of $3.95, for this purpose. We use msp430 launchpad modules($2.80 each) for our processing needs. We chose Solid State Relay (SSR) over Electromagnetic Relay (EMR) due to its longer life and noiseless operation despite its slightly higher cost. Four high rating (25A @ 220V, $7.94 each) SSRs are used to control the high power sockets. We also design our PCB board to ensure that the MBD fit within the space constraints of the main distribution board.
The Switch Board Device (SBD) is similar to the MBD with a primary difference in number of relays and their ratings. The SBD has five outlets with three of them for fixed appliances (fans and lights) and two power sockets. We used 1A rating SSR ($5.18) for the three (known rating) appliances and 5A ones ($14.56) for power sockets with variable load. We assume room level control by shutting off all relays of an SBD.
The Base Station is responsible for implementing the control-decisions of the management plane and send them to the MBD and SBDs using the communication protocol over the CC2500 RF chip. This chip is coupled with a micro-controller, currently an mbed, but is being replaced with our msp430 option for cost savings.
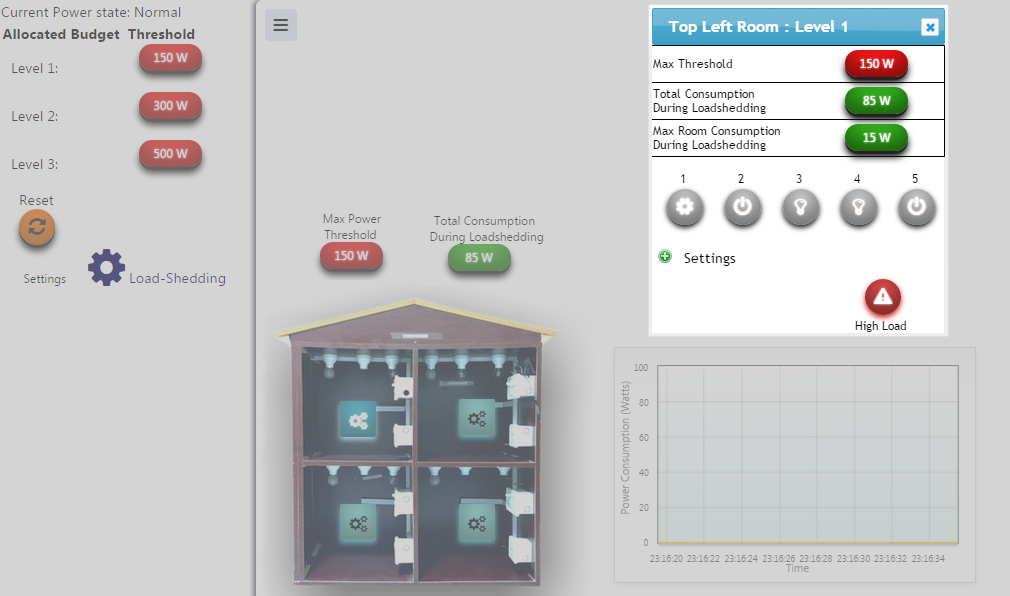
6.3 Software Components
We decided to use Microsoft Research’s Lab-of-Things (LoT), an open source platform that enables seamless integration of home-automation systems into a coherent framework by requiring vendor specific drivers. It further provides a cloud-based rendezvous mechanism and a relayering feature, allowing seamless NAT traversal capability so that applications built are accessible from anywhere. We wrote a LoT application for Aashiyana system which implements a the disconnectivity matrix when it receives the external stress signal. User interface (UI) of the application (Figure 4) is developed as an HTML5 web-application, and is useful to input the disconnectivity matrix as well as view status from any internet connected device. Currently, we use a dedicated laptop as a home hub but target a low-cost tablet supporting .NET framework for around $65 [13].
To integrate our hardware system to the LoT framework, we custom wrote the device driver and scout for our Aashiyana system. Device scout is responsible for discovery of Aashiyana control devices. The device drivers then allow the application to view each control point as a role that can be mapped to a particular disconnectivity matrix. These device driver talk with the base station through a serial port, and the base station uses its communication stack to coordinate with the SBDs and MBD. Our current implementation thus, besides implementing different power states, also provides LoT roles that allow users to switch on or off specific devices as an additional feature.
The communication stack has a discovery part (used by the LoT scout code) in which the base station scans for all home-id specific devices in the vicinity at bootup and stores their addresses in a table. Each devices is assumed to have a unique ID assigned (starting from 1) and a disconnectivity matrix is converted into a command to switch off corresponding relays at each control device. This command is sent as a broadcast message, where the relay state is represented by bits in a byte. We thus use just first five bits (corresponding to 5 relays) of a byte. Each device extracts the information byte corresponding to its device ID and implements the state described by the binary values in that byte.
We require an acknowledgment from every device for reliability. The ack contains the current state of the relays on that device allowing the LoT application to have an accurate view of the home-power state. The base-station retries three times if ack from any device is not received. If the receiver fails to respond altogether, the base station send a nack status to the application to potentially show an error message. We prevent collision between the acknowledgment by implementing time-disjoint slots of 5ms based on the unique device IDs. The base station timeout is 21ms to cater for the five devices in our prototype home.
6.4 Practical Evaluation of Aashiyana
We now evaluate the practicality of our system by measuring three important and practical parameters: power-level switching delay, communication reliability, and power consumption.
6.4.1 Switching Delay
Since the purpose of Aashiyana is to have a system that can help attain balance with the demand-supply gap, its reaction time has to be on the order of reaction delays for a grid stability. A power grid requires an instantaneous matching of supply with demand: regulating reserves333Regulating Reserve is the capacity of generators to supply energy within an economic dispatch interval in response to the grid frequency variations., however, are typically employed to manage the time until load-following reserves can come online. A typical grid has around five minutes of this stability time, but can also reach up to an hour in some cases [10].
We thus would like to ensure that our system responds to stress signals at least an order-of-magnitude quicker than this stability time to allow allow grid-balancing using any iterative demand response algorithm (with possibly multiple round-trip delays). In order to compute this delay, we measure the time from selection of a particular Disconnectivity Matrix (DM) to when the corresponding state is implemented. We measure this delay in two parts, using different experiments.
First, we observe the latency introduced by the Lab-of-Things framework in processing this request. We randomly generate DM at a delay of around 1 minute, use the LoT logger module to time-stamp (at msec granularity) the entry into our implementation code, as well as the exit from the driver for our base-station (just before writing to the base-station serial port). Over one thousand samples, we observe typical delay of around 1-2 msec, but occasionally (due to OS context switching) a worst case delay between 5-8 msec.
The second part of delay is measured from the instant the base-station receives the DM until a control device (SBD or MBD) switches off a relay. To measure this delay, we time-stamp on the base station the time when we receive the first byte of control data (including the DM) from the serial port (operating at 9600 baud rate), to the time when the target device switches off the relay. This switching event is detected by connecting the GPIO output controlling the relay back to an extra port on base-station. Notice that we ignore the acknowledgement time from this measurement since as soon as the relays have switched the load on grid has been appropriately reduced. However, for cases where the control packet is lost, timeouts are added into the average response time. We find the average the delay over 120 measurements, when sending a control packet containing the DM, to be around 28 msec.
Thus the average delay for our system (shown in Table 1) to respond to a stress signal is around 30 msec, if we consider internet-network latency of around 200msec; our response time is more than two-orders-of magnitude faster that the grid stability time.
6.4.2 Communication Reliability
We now assess the reliability of the communication between the base station and switching devices, since loss of control packets will impact the over all grid stability. This reliability is a function of communication range, hence we assess the packet reception rate (PRR) for our system over different range. Table 1 shows 94% PRR, over 100 iterations, at the range of 50m. While not currently implemented, we believe the a mesh network that provides 99% reliability (like CTP [12]) is best suited to provide guarantees over such lossy links.
6.4.3 Power Consumption
Finally, we observe the power consumption of our prototype system. We need this value to be a nominal amount so as to best manage the limited budget assigned to a home. We measure that an SBD consumes 0.4W, with all five appliance on, but consumes 0.1W with devices off, during a load-shedding event. An MBD, with higher rating relays, consumes 0.36W and 0.1W during these two states. Thus for a four room home, the total power cost in implementing L5 is 1.96W, while L0 requires 0.5W.
| Latency |
|
5ms | ||
|---|---|---|---|---|
|
28ms | |||
| Total | 33ms | |||
| Reliability | Distance (m) | PRR | ||
| 10 | 100 | |||
| 25 | 98 | |||
| 50 | 50 | |||
| Power & Cost | Power (W) | Cost ($) | ||
| MBD | 0.36 | 40 | ||
| SBD | 0.40 | 53 | ||
| Home Hub | 3 | 65 | ||
| Total (4 room) | 5 | 317 |
With these values, the power of our Aashiyana prototype, if all devices are operating, will be an additional 2 watts and much less when a lower power-level is enforced.
7 Utility and DLC algorithms
We now lay out new load-shedding strategies that are made possible with an Aashiyana home that can operate at different power-levels. We note that currently load shedding is implemented at group level where all homes under the feeder belonging to a group are set to L1 (no power). Since Aashiyana system will be introduced incrementally, we consider different load-shedding (aka DLC) policies under varying Aashiyana Penetration (AP) levels.
In order to evaluate the benefit of different strategies we first model the social utility for a home to operate at different power-levels. We then propose two different load-shedding algorithms to manage the varying demand supply gap.
7.1 Utility Function for Different Power-levels
We base our utility function definition on two observations. First, for a consumer whose home is shifted to any restricted power state (L4-L1), the loss of utility is large. The second, and mirror observation, is that for a consumer who is currently accustomed to having complete shut-off any power to run basic appliances is appreciated. Representing these state changes with two specific thresholds and , respectively, and considering a linear utility variation between them we define our utility function as:
Different values of threshold correspond to different utility interpretation that we will evaluate in the next section.
7.2 Load-Shedding Algorithms
Given the above utility function, we believe that DLC algorithms for load-shedding can provide much greater utility as opposed to the classical option of completely shutting off power. We propose two different algorithms, one central and the other distributed that try to maximize the utility offered to the customers. Our algorithms enforce reduction at an hour-long granularity, and we ensure (unless impossible) that customer are not successively put into a any load-shedding state. Similarly, we limit Aashiyana homes to L2, leaving L1 (full shutoff) as a final resort, using an emergency signal. We also only use additive backoff; any increase (multiplicative or additive) to meet extra supply made available due to reduction were deemed too prone to oscillations. With a grid trying to meet its demand, it thus appears that only decrease in demand, returning to full level at the end of an hour, is the appropriate response.
It is important to note here that utility companies, predominantly state owned in countries requiring load-shedding, will be motivated to decrease the discomfort (and thus potential for unrest) by promoting the deployment of Aashiyana-like systems. Consumers, however, will be motivated when they see their neighbors with the system installed having greater utility. While they can buy and install local backups (that have fixed and recurring cost), our system can be deployed at a similar cost but fewer power units consumed (no losses of a battery backup), for the same effective utility.
7.2.1 Distributed DLC Algorithm
In our distributed algorithm, the power throttling level is stochastically generated inside the DLC logic. However, due to a variable Aashiyana Penetration (AP), the grid utility is still involved to fully shut-off non-Aashiyana homes. The only information external information required is the stress level on the grid, communicated either by the utility or by locally sensing supply frequency [11]. We define this stress level as ; where is the current supply while is the actual (unfulfilled) demand. Intuitively this is the fraction of actual demand not currently being met, and thus the fractional amount to be shed. We propose an iterative algorithm, where in the first iteration an Aashiyana homes run a stochastic algorithm (Algorithm 1) to determine their new power state. This state is selected as a function of the and a Distribution Profile (DP) characterizing the relative percentage of homes that we would want to stay in L4, L3, and L2. If, after this load reduction, at the start of second iteration444each iteration is set to be 1 sec, sufficient for an Aashiyana response and grid stability. , the demand is still not met, the typical feeder-level group of non-Aashiyana homes are completely cutoff from the grid. Only if the demand is still not met, the Aashiyana Homes run the same algorithm. To ensure utility maximization, we make homes already in a back-off state to use their original (iteration 1) stress level, where they reduce consumption to the next power-level, while all other homes that did not back-off earlier use a much lower value for their threshold.This, ping-pong, demand reduction continues until demand meets supply.
7.2.2 Centralized DLC Algorithm
Our centralized algorithm (Algorithm 2) assumes that the utilities have a full view of the current consumption of each home. The utilities (DISCOs in Pakistan) already have feeder-level groups established in which they cyclically implement their current load-shedding. In our case, they now refine this process by picking the first group and computing the savings by shutting-off all non-Aashiyana homes. With the demand-supply gap () still positive, the DISCO starts computing energy savings by reducing consumption level of Aashiyana homes, by considering highest consumption homes first, to any level (chosen equally-likely) below their current consumption555Thus if consumption of a home is above 75% of its meter rating, either of L4, L3, or L2 can selected.. They choose another home only if the , and if cycling through all Aashiyana home still doesn’t satisfy demand, the next group is selected and the process continues until demand is met. Once this decision is made centrally, the control decisions are then communicated directly (and at once) to every home: Aashiyana homes are communicated the selected level that bypasses the DLC logic shown in Figure 1, while other homes are completely shut-off by their smart-meters.
8 Evaluation of large-scale DLC using Aashiyana
We now evaluate the benefits of our proposed large-scale DLC algorithms. After explaining the evaluation setup, we compare the performance improvement in utility compared to a baseline case using the current schedule based load-shedding.
8.1 Evaluation setup
In order to best evaluate across a comparative behavior, we use an evaluation setup employing a custom event-driven simulator implemented in C++.
8.1.1 Modeling consumption of homes
We model the individual appliance level data as a distribution by using the appliance consumption information from the UK-DALE [14] and REDD [16] dataset. We remove the outliers in the UK-DALE power consumption data-set by removing values greater than three stdev. We apply the Kernel Density Estimation (KDE) technique on this power consumption data to obtain the cumulative distribution function (CDF) estimate, modeling a devices consumption in a stochastic manner. We then use inverse transform sampling to obtain a stochastic power consumption value for every device, averaged over a full hour.
We have three class of homes A, B and C with 7, 10, and 13 set of appliances respectively. We implement the five power levels in the simulator as a function of different maximum rating for each class — class A has 500W, class B has 750W, and class C has 1000W. Power level 1 is full shutoff (no appliance) while power level 5 allows all appliances of that home type to be turned on. We setup disconnectivity matrix for each class of home for every intermediate level to attain 75%, 50%, and 25% consumption of their maximum rating.
8.1.2 Simulator overview
Our custom event-driven agent-based simulator that operates at the granularity of a second. The agents in our simulators include generators, distribution utilities, a central body (like NPCC) and home agents to simulate the electrical grid. In the simulator we implemented the connectivity hierarchy of the DISCO to consumers in the grid. We have different Grid stations, feeders, transformers, and homes forming a tree hierarchy in the simulator. The power consumption of different appliances in a home vary every hour based on their observed CDF. Central body checks the supply-demand gap every second and generates an event to reduce the gap based on the selected algorithm. On reception of the DLC signal, homes having Aashiyana system will be restricted to limited set of appliances according to their respective assigned power level while non-Aashiyana home will be shut-off completely. The signal of centralized DLC and turning of non-Aashiyana is applied to a group of ten feeders in the grid. We allows these setting to be input as a configuration file to the simulator to set the number of home agents, CDF data path, load-reduction policy, Aashiyana penetration (AP), total number feeders groups, and the generation capacity. We plan to make the code for our simulator open source as we believe it will be a great resource for the community to build and run large-scale simulation studies for smart-grid power systems.
8.1.3 Assumptions
We assume lossless transmission and distribution in the grid. We also assume the utility have a list of all homes, whether they have Aashiyana installed or not. We assumed there is no latency in reception of DLC signal and and that its response is implemented within a second.
8.2 Traditional Load-shedding and Under-load Wastage
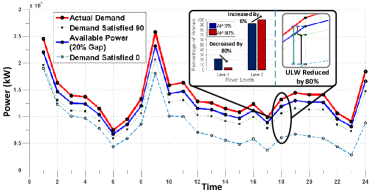
We first show the running of our simulator with traditional load-shedding strategy (selecting group of feeds to blackout, or at L1). Figure 5 shows the scenario where we have a 20% demand supply gap. We can see that there are several locations where the demand satisfied by implementing cyclic load-shedding, leads to something below the available generation capacity. In these scenarios, the governor control on generator side leads to less power being generated than the capacity online. This is what we call under-load wastage (ULW), and it not only produces energy less efficiently across our ensemble of generators, but allows fewer people to have power than is possible. While we evaluate the algorithm in detail next, the Figure 5 (inset) shows that (for hour 18) our algorithms can be efficient by reducing ULW from 1.12MW to just 0.2MW. This reclaimed energy allows not only a decrease in the number of home with no power (L1) by 80% but also an increase by 6% in the fraction of homes with full power (L5).
8.3 Distributed Algorithm
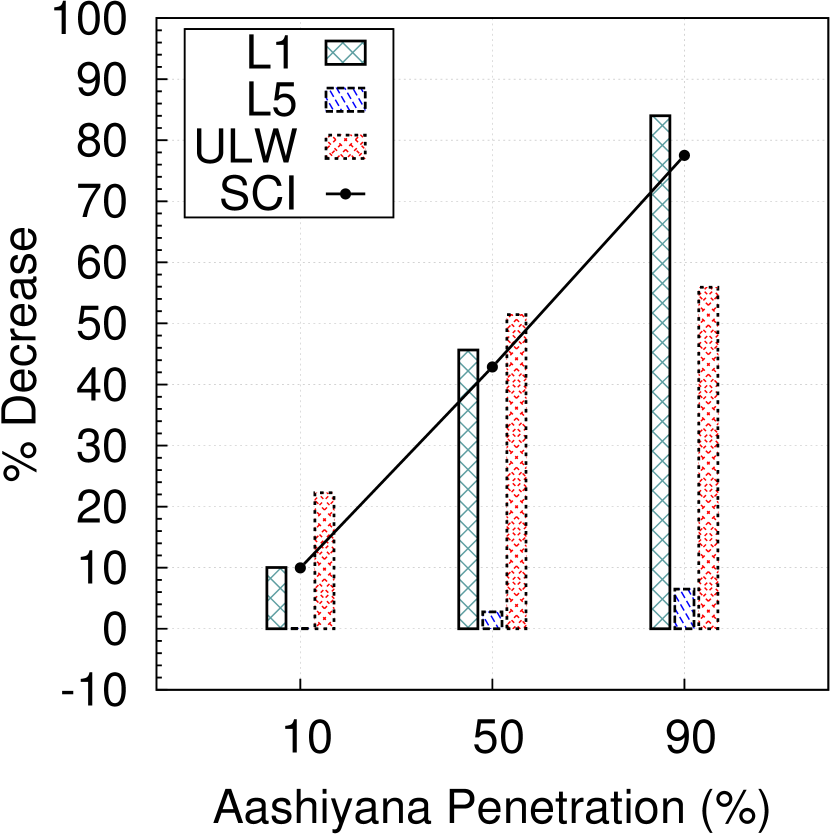
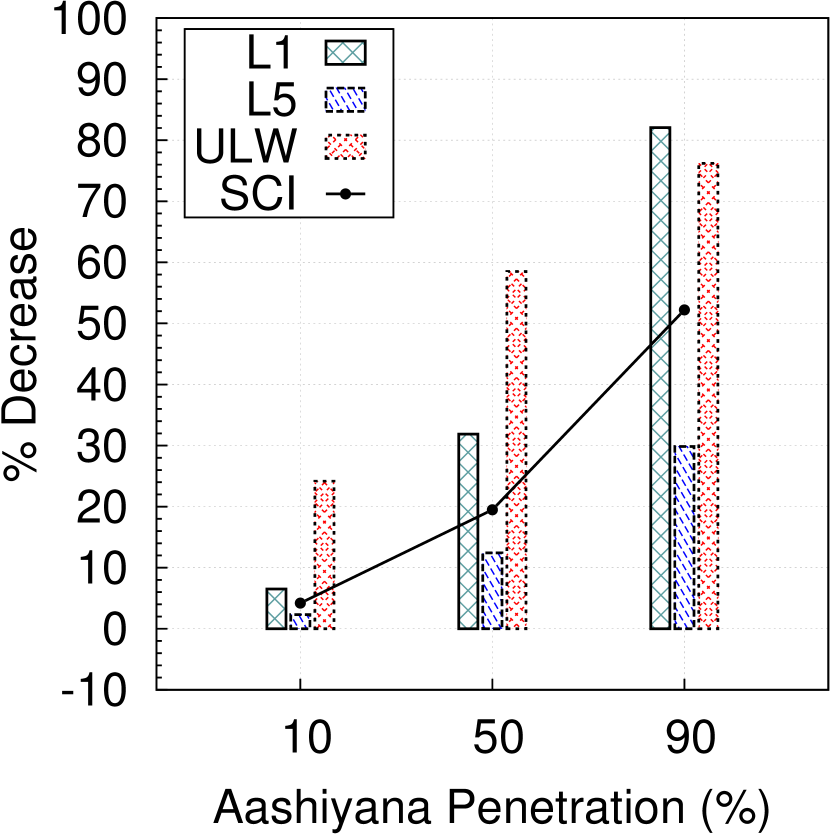
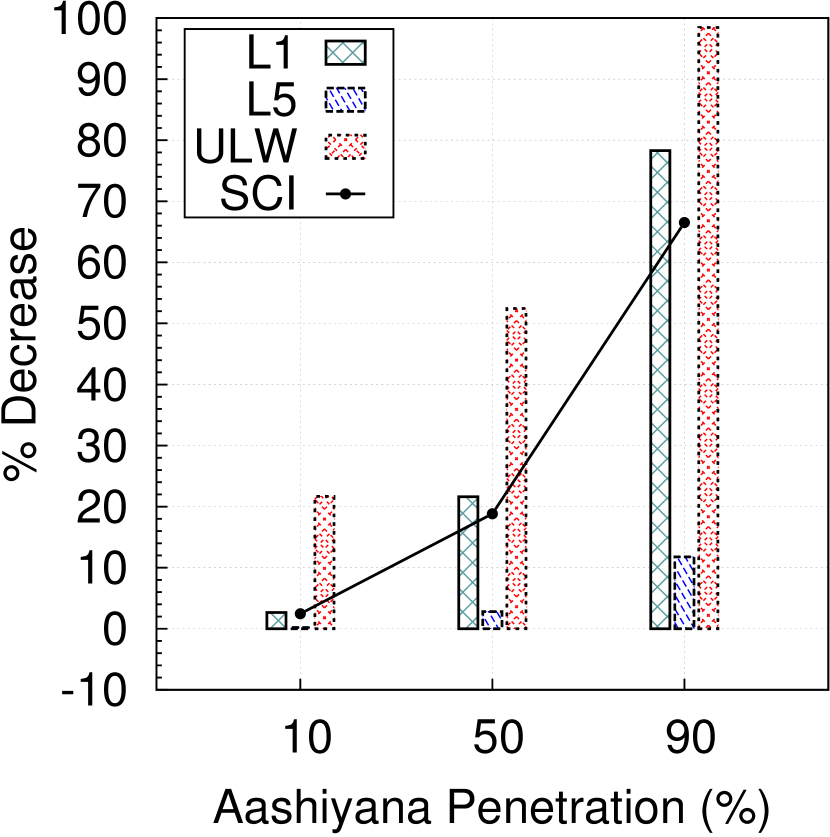
Having established that for a static supply case, our distributed algorithm allows for increased social comfort by significantly reducing the number of homes with no-power (L1) for a slight decrease in homes with full-power (L5), we now consider a case where the supply demand gap is a consistent percentage of actual demand. For this purpose, we vary this gap as 10-40%, and observe the percentage decrease, over a 24hr period and compared to no Aashiyana penetration (AP) (i.e. traditional load-shedding), in homes that are in L1 and the concomitant decrease for L5 at different AP levels.
Figure 6 show the result of averaging 10 simulation runs for each experimental setting (% gap, AP level). As is quite evident, the fractional decrease of homes in L1 always greater than (by more than 100%) the corresponding decrease in L5. This difference, corresponding to increase in social comfort, is understandably greatest at the highest AP level with the social comfort index (SCI666SCI is defined as the magnitude of difference between the fractional decrease in L1 and fractional decrease in L5.) percentage points for 90% AP, thus clearly indicating the benefit of wide-scale adoption. We notice that as the demand-gap increases, the improvement in SCI decreases. This is so since large gap will necessarily demand a lots of homes to be load-shed, thus necessitating more homes to go below L5.
8.4 Centralized algorithm
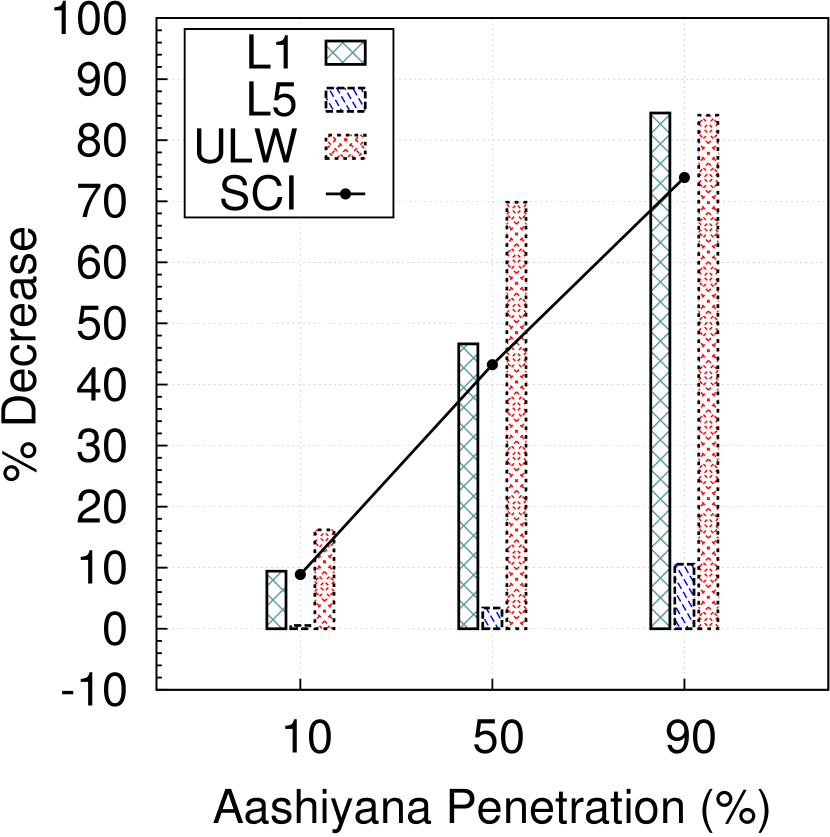
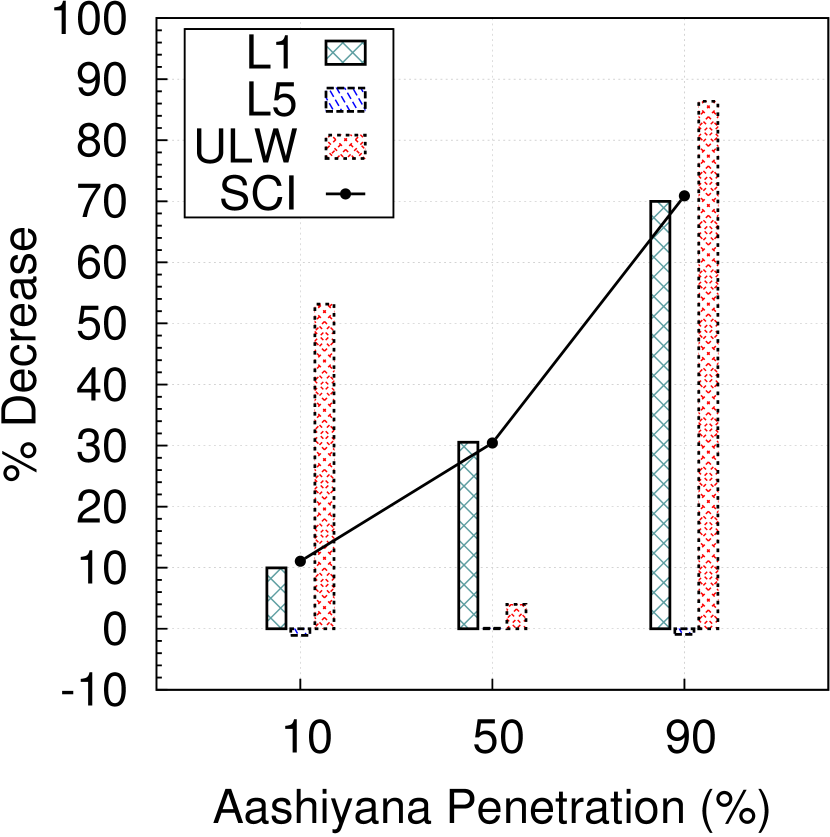
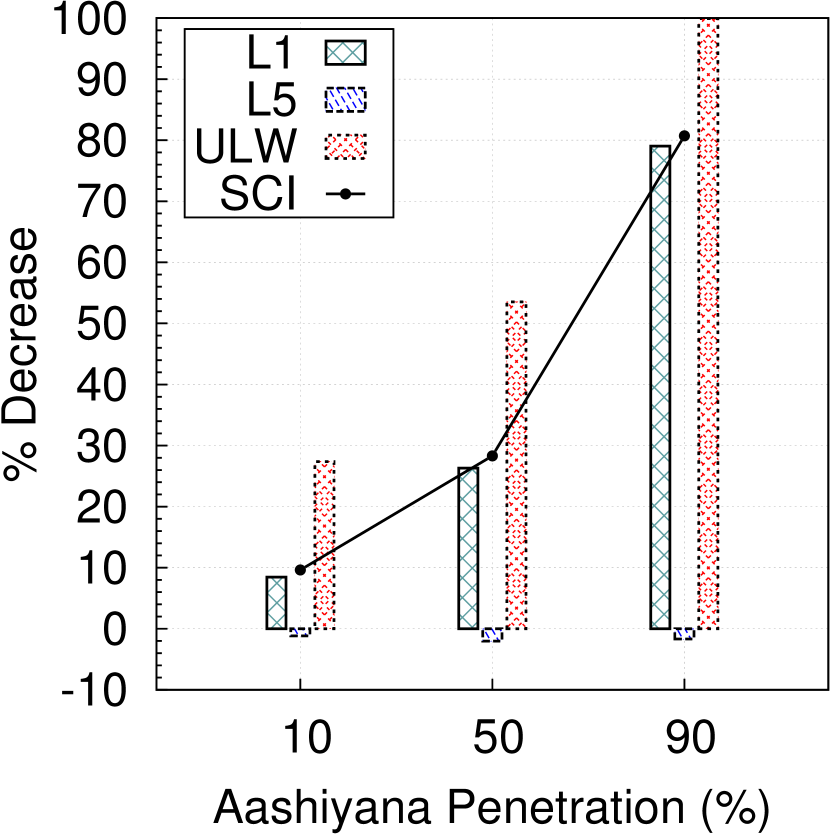
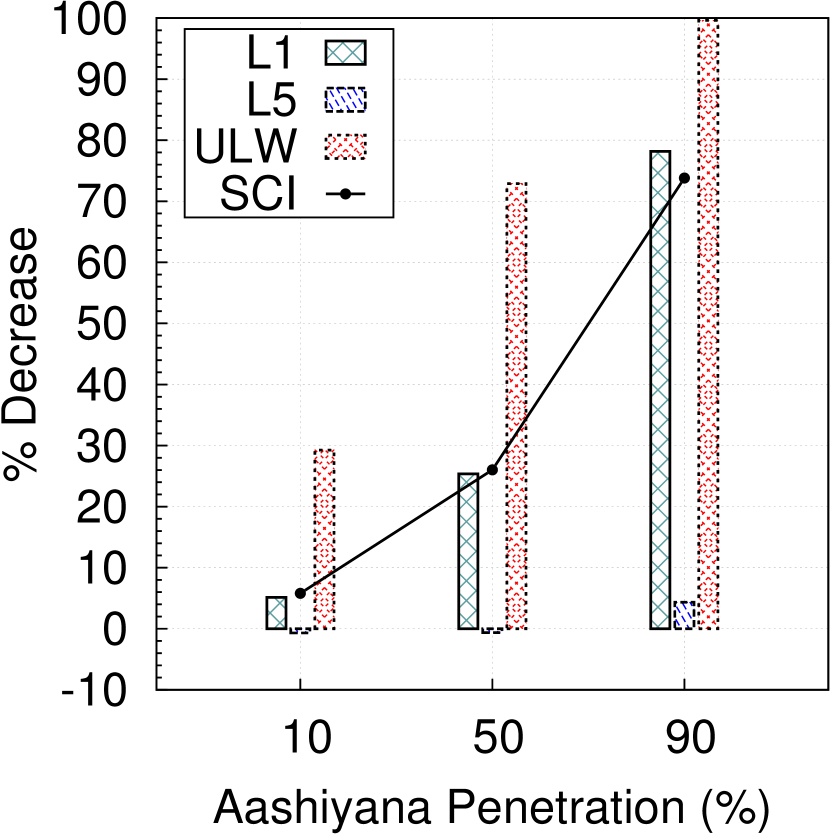
Our centralized algorithm has a holistic view of the energy consumption status. We therefore expect that, while the trends will be similar to those for our distributed algorithm, it will be more efficient by reducing the amount of ULW and should thus help increase (SCI).
Figure 7 shows the results for our centralized algorithm. We observe that, as before, most improvements are when we have the highest Aashiyana penetration, and that it decreases with increasing gap. Further, we can confirm that with a more informed strategy, the centralized approach obtains greater ULW savings, thus we have 99% less wastage (0.019 MW vs 3.3 MW) for 90% AP at 20% gap. Moreover, it is interesting to observe that in certain cases, the fraction of homes in L5 actually increase (negative decrease). Such a scenario is purely win-win since now, for the same supply-demand gap, we have not only decrease the fraction of homes that get no-power, but were also able to increase the fraction of homes with unrestricted power!
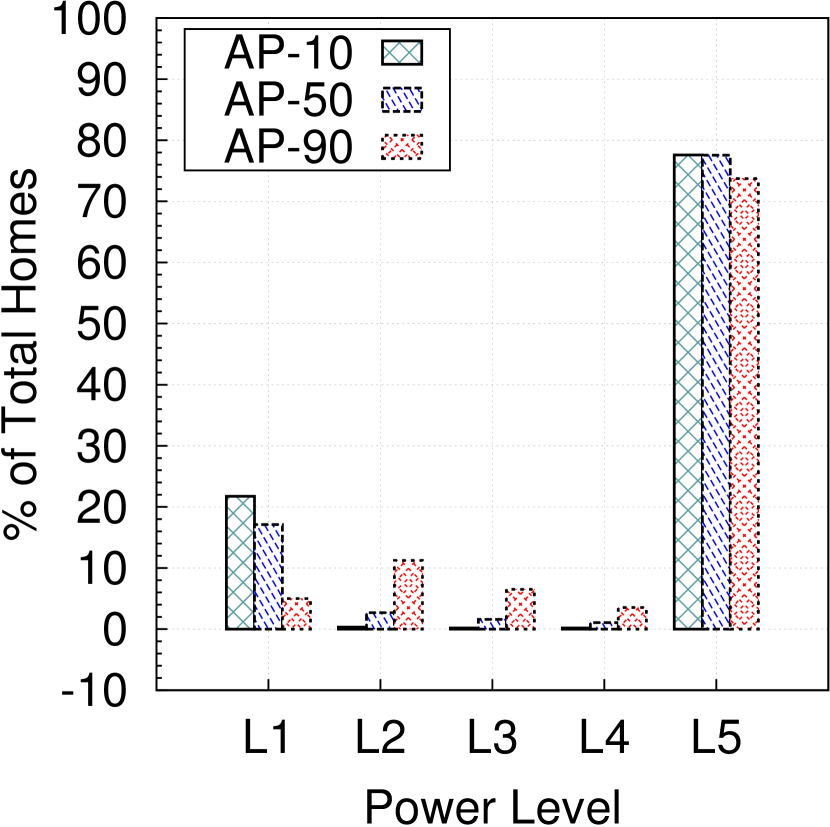
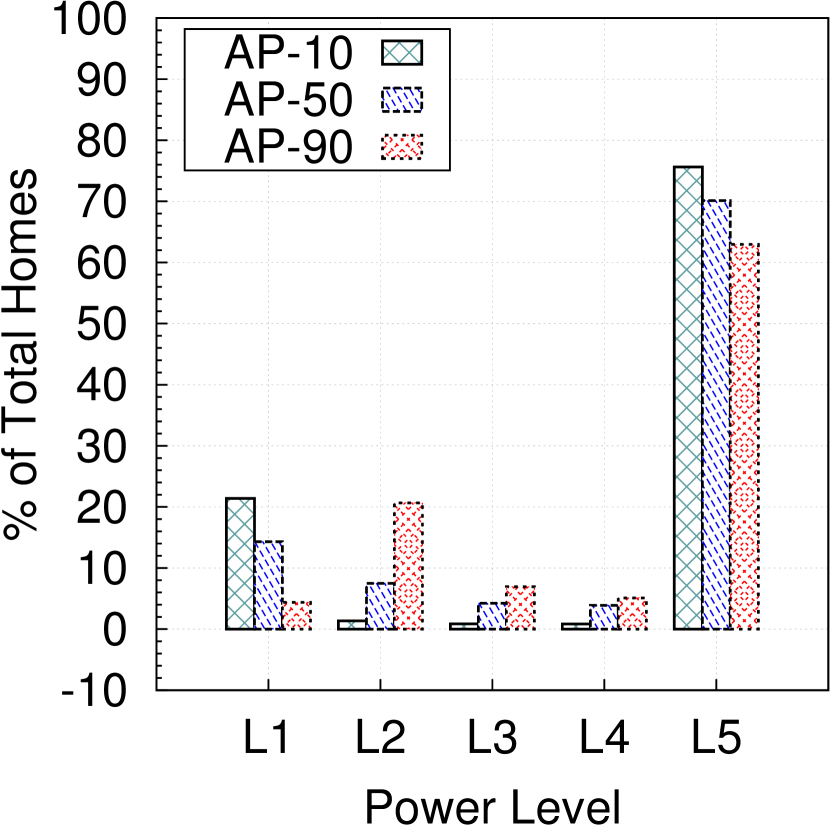
8.5 Discussion
We note that between are two algorithms, the centralized approach is consistently better at reducing the under-load wastage, and provides better SCI at higher AP. However, the SCI values for the distributed case are slightly better at lower penetration. We believe this is so because SCI show distribution for only two possible levels. Figure 8 shows this distribution for homes for the same gap, but after different algorithms have run. We observe that the distributed algorithm results in distributing savings to lift nodes from no-power (L1) into a low-power state. The centralized algorithm instead, results in more homes with full-power and fewer are taken out from L1. Using nearly any sensible definition of utility we see that the centralized approach always results in marginally better utility for the population (around 6% for ).
We note however that the distributed algorithm can still stay close to this utility value thus effectively managing grid-stress. To our mind, since distributed mechanisms are robust to individual failures, and their low complexity allows quick implementation, exploring a distributed approach to manage stress is a promising direction. It is also worth exploring if increasing the number of levels is beneficial; we do caution that more levels decrease the user-friendliness of the system since the user has think about and configure a disconnectivity matric for each state.
9 Conclusions
We present here a novel and practical DLC system, Aashiyana, that enables several different low-power states for homes within the context of highly stressed grids. We design and implement this with practical incentives for the utilities (decreasing social unrest) as well as consumers (low-cost, lower hours with no-power, greater utility), all without having to increase the supply side equation. We propose two types of algorithms that utilize this ability of guaranteed budget reduction at different levels that allow for more efficient reduction in gap with reduced amount of underload wastage. We show that, compared to current load-shedding strategy, for the same supply-demand gap, we can reduce homes with no power by % while not significantly impacting the fraction of homes with full power.
Acknowledgements
We want to thank Dr. Mukhtar Ullah for helping design the stochastic model of appliance consumption and Zaafar Ahmed for supporting in generating graphs.
References
- [1] Aeotec smart strip. website http://aeotec.com/z-wave-power-strip.
- [2] Dawn news - violent protests in lahore, multan against loadshedding. website http://www.dawn.com/news/1121213.
- [3] T. Bapat, N. Sengupta, S. K. Ghai, V. Arya, Y. B. Shrinivasan, and D. Seetharam. User-sensitive scheduling of home appliances. In Proceedings of the 2Nd ACM SIGCOMM Workshop on Green Networking, GreenNets ’11, pages 43–48, New York, NY, USA, 2011. ACM.
- [4] S. K. Barker, A. K. Mishra, D. E. Irwin, P. J. Shenoy, and J. R. Albrecht. Smartcap: Flattening peak electricity demand in smart homes. In S. Giordano, M. Langheinrich, and A. Schmidt, editors, PerCom, pages 67–75. IEEE, 2012.
- [5] V. Chandan, T. Ganu, T. K. Wijaya, M. Minou, G. Stamoulis, G. Thanos, and D. P. Seetharam. idr: Consumer and grid friendly demand response system. In Proceedings of the 5th International Conference on Future Energy Systems, e-Energy ’14, pages 183–194, New York, NY, USA, 2014. ACM.
- [6] Citris. Openbas: Open-source building automation systems for smaller commercial buildings. website http://goo.gl/7XV3fb.
- [7] C. Dixon, R. Mahajan, S. Agarwal, A. J. Brush, B. Lee, S. Saroiu, and P. Bahl. An operating system for the home. In Proceedings of the 9th USENIX conference on Networked Systems Design and Implementation, NSDI’12, pages 25–25, Berkeley, CA, USA, 2012. USENIX Association.
- [8] S. C. Edison. Summer discount plan. web site https://www.sce.com/wps/portal/home/residential/rebates-savings/summer-discount-plan/.
- [9] EnerSource. Peak saver. web site http://www.enersource.com/energy-savings-tips/Pages/peak_saver.aspx.
- [10] M. M. Erik Ela and B. Kirby. Operating reserves and variable generation. Electric power-plants, load management, electric power production, Colorado, aug 2011.
- [11] T. Ganu, J. Hazra, D. P. Seetharam, S. A. Husain, V. Arya, L. C. D. Silva, R. Kunnath, and S. Kalyanaraman. nplug: a smart plug for alleviating peak loads. In e-Energy’12, pages 30–30, 2012.
- [12] O. Gnawali, R. Fonseca, K. Jamieson, D. Moss, and P. Levis. Collection tree protocol. In Proceedings of the 7th ACM Conference on Embedded Networked Sensor Systems, SenSys ’09, pages 1–14, New York, NY, USA, 2009. ACM.
- [13] gsmarena. Low cost windows tablet. web site https://www.goo.gl/NeVB3l/.
- [14] J. Kelly and W. Knottenbelt. UK-DALE: A dataset recording UK Domestic Appliance-Level Electricity demand and whole-house demand. ArXiv e-prints, Apr. 2014.
- [15] I. N. Kessides. Chaos in power: Pakistan’s electricity crisis. Energy Policy, 55(0):271 – 285, 2013. Special section: Long Run Transitions to Sustainable Economic Structures in the European Union and Beyond.
- [16] J. Z. Kolter and M. J. Johnson. Redd: A public data set for energy disaggregation research. In Workshop on Data Mining Applications in Sustainability (SIGKDD), San Diego, CA, 2011.
- [17] P. MicroTech Industries, Lahore. Microtech: Solutions by harnessing local engineering expertise. web site http://www.mtilimited.com/.
- [18] M. A. Piette, G. Ghatikar, S. Kiliccote, D. S. Watson, E. Koch, and D. Hennage. Design and operation of an open, interoperable automated demand response infrastructure for commercial buildings. Journal of Computing Science and Information Engineering, 9(2), 2009.
- [19] A. H. M. Rad and A. Leon-Garcia. Optimal residential load control with price prediction in real-time electricity pricing environments. IEEE Trans. Smart Grid, 1(2):120–133, 2010.
- [20] D. P. Seetharam, A. Agrawal, T. Ganu, J. Hazra, V. Rajaraman, and R. Kunnath. Hidden costs of power cuts and battery backups. In Proceedings of the Fourth International Conference on Future Energy Systems, e-Energy ’13, pages 39–50, New York, NY, USA, 2013. ACM.
- [21] Z. Sharani, K. Qayyum, N. Bashir, and A. Syed. Softups: Eliminating the need and cost of battery backups in the developing world. In Proceedings of the 5th International Conference on Future Energy Systems, e-Energy ’14, pages 207–208, New York, NY, USA, 2014. ACM.
- [22] S.Keshav and C.Rosenberg. Direct adaptive control of electricity demand. Technical report, University of Waterloo, 2010.
- [23] P. Srikantha, C. Rosenberg, and S. Keshav. An analysis of peak demand reductions due to elasticity of domestic appliances. In Proceedings of the 3rd International Conference on Future Energy Systems: Where Energy, Computing and Communication Meet, e-Energy ’12, pages 28:1–28:10, New York, NY, USA, 2012. ACM.