Unveiling the nature of the -ray emitting AGN PKS 052136
Abstract
PKS 052136 is an Active Galactic Nucleus (AGN) with uncertain classification. We investigate the properties of this source from radio to rays. The broad emission lines in the optical and UV bands and steep radio spectrum indicate a possible classification as an intermediate object between broad-line radio galaxies (BLRG) and steep spectrum radio quasars (SSRQ). On pc-scales PKS 052136 shows a knotty structure similar to misaligned AGN. The core dominance and the -ray properties are similar to those estimated for other SSRQ and BLRG detected in rays, suggesting an intermediate viewing angle with respect to the observer. In this context the flaring activity detected from this source by Fermi-LAT between 2010 June and 2012 February is very intriguing. We discuss the -ray emission of this source in the framework of the structured jet scenario, comparing the spectral energy distribution (SED) of the flaring state in 2010 June with that of a low state. We present three alternative models corresponding to three different choices of the viewing angles = 6∘, 15∘, and 20∘. We obtain a good fit for the the first two cases, but the SED obtained with = 15∘ if observed at a small angle does not resemble that of a typical blazar since the synchrotron emission should dominate by a large factor ( 100) the inverse Compton component. This suggests that a viewing angle between 6∘ and 15∘ is preferred, with the rapid variability observed during -ray flares favouring a smaller angle. However, we cannot rule out that PKS 052136 is the misaligned counterpart of a synchrotron-dominated blazar.
keywords:
galaxies: active – galaxies: nuclei – galaxies: individual (PKS 0521-36) – galaxies: quasars: general – gamma-rays: galaxies – gamma-rays: general1 Introduction
Active galactic nuclei (AGN) are compact regions at the centre of a few percent of galaxies with a non-stellar emission overwhelming the thermal contribution of the entire galaxy. AGN include a super-massive black hole (SMBH) as central engine, whose strong gravitational potential pulls the surrounding materials inwards, forming a disc of hot plasma. In addition, gas clouds move in the potential well of the SMBH, producing optical and UV emission lines. The central region is surrounded by absorbing material in a flattened configuration, idealized as a toroidal shape, located at 1–10 pc. In radio-loud objects there is the additional presence of relativistic jets, roughly perpendicular to the disc. According to the Unified Model (Urry & Padovani, 1995), AGN types are classified on the basis of the orientation of their jet with respect to the observer. Blazars, usually divided into flat spectrum radio quasars (FSRQ) and BL Lac objects, represent the fraction of AGN with their jet oriented at very small viewing angle, which causes relativistic aberration and emission amplification (Blandford & Rees, 1978). Radio galaxies should be the misaligned parent population of blazars. On the basis of their radio morphology and power, radio galaxies are classified as Fanaroff Riley type I (FR I) or Fanaroff Riley type II (FR II). Decelerating jets and kpc scale edge-darkened lobes are found in the weaker FR I radio galaxies, while relativistic jets and edge-brightened radio lobes are found in the stronger FR II radio galaxies (Fanaroff & Riley, 1974). According to the Unification scenario for radio-loud AGN, FR I radio galaxies correspond to BL Lac objects, and FR II radio galaxies are the parent population of FSRQ.
PKS 052136 was first classified as an N galaxy (Bolton et al., 1965), and then a BL Lac object (Danziger et al., 1979; Burbidge et al., 1987). However, this source shows broad and variable nuclear emission lines in optical and UV bands (Ulrich et al., 1981; Scarpa et al., 1995) with equivalent width (EW) much larger than 5 Å (rest-frame), the threshold historically proposed to distinguish between BL Lac objects and FSRQ (e.g., Stickel et al., 1991; Stocke et al., 1991). This suggests that PKS 052136 is a misclassified AGN. For this source, a large-scale optical jet well aligned with the kiloparsec radio jet was observed, with a clear correspondence between the radio and optical structures (Scarpa et al., 1999, and references therein). In radio and optical bands the jet resembles that of the nearby radio galaxy M 87 (e.g., Sparks et al., 1994). Chandra detected the X-ray counterpart of the innermost 2-arcsec jet (Birkinshaw et al., 2002).
In the -ray energy range PKS 052136 was tentatively detected by the Energetic Gamma Ray Experiment Telescope (EGRET) on board the Compton Gamma-Ray Observatory in Phase 1 (Lin et al., 1995), but it was not included in the Third EGRET catalogue (Hartman et al., 1999). No beaming effect is needed for the core brightness temperature estimated in radio, consistent with the non-detection of superluminal motion (Tingay & Edwards, 2002). By modeling the spectral energy distribution (SED) and taking into account its radio characteristics, Pian et al. (1996) derived a viewing angle of 30∘ with a bulk Lorentz factor of 1.2. Very Long Baseline Array (VLBA) image showed that the same Position Angle (PA) found on the parsec-scale jet is maintained, without any significant bending, over 3 orders of magnitude of length scale (Giroletti et al., 2004). This may be a further indication of a relatively large viewing angle. For a plausible Lorentz factor of = 5, Giroletti et al. (2004) derive a viewing angle in the range 21∘ 27∘.
On 2010 June 17, a strong -ray flare from PKS 052136 was detected by the Large Area Telescope (LAT) on board the Fermi Gamma-ray Space Telescope satellite (Iafrate et al., 2010), triggering a Swift follow-up observation that confirmed the high activity of the source in optical, UV, and X-rays (D’Ammando et al., 2010). In this paper we investigate the nature of this object and its emission mechanisms by the analysis of multifrequency data collected from radio to rays, focusing in particular on the 2010 June flaring activity.
The paper is organized as follows: in Section 2, we report the LAT data analysis and results. In Section 3, we report the results of the new Swift and archival XMM–Newton and Chandra data analysis. Radio data collected by the VLBA, Very Large Array (VLA), University of Michigan Radio Astronomy Observatory (UMRAO), and Submillimeter Array (SMA) are presented in Section 4. In Section 5, we discuss the source properties from radio to rays. In Section 6, we discuss the modeling of the overall SED and draw our conclusions in Section 7.
Throughout the paper the quoted uncertainties are given at the 1 level, unless otherwise stated. The photon indices are parameterized as , where is the photon index at the different energy bands. We used a cold dark matter cosmology with H0 = 71 km s-1 Mpc-1, = 0.73, and = 0.27 (Komatsu et al., 2009). The corresponding luminosity distance at = 0.056 is d = 246.8 Mpc and 1 arcsec corresponds to a projected size of 1.073 kpc.
2 Fermi-LAT Data
The LAT on board the Fermi satellite is a -ray telescope operating from MeV to GeV, with a large peak effective area ( cm2 for GeV photons), an energy resolution typically 10 per cent, and a field of view of about 2.4 sr with single-photon angular resolution (68 per cent containment radius) of 06 at E = 1 GeV on-axis. Details about the LAT are given by Atwood et al. (2009).

The LAT data reported in this paper were collected over the first 4 years of
Fermi operation, from 2008 August 4 (MJD 54682) to 2012 August 4 (MJD
56143) in the 0.1–100 GeV energy range. During this time, the Fermi observatory operated almost entirely
in survey mode. The analysis was performed with the ScienceTools
software package version v9r32p5 111http://fermi.gsfc.nasa.gov/ssc/data/analysis/.
Only events belonging to the ‘Source’ class were used. The time intervals when
the rocking angle of the LAT was greater than 52∘ were rejected. In
addition, a cut on the zenith angle () was applied to reduce
contamination from the Earth limb rays, which are produced by cosmic
rays interacting with the upper atmosphere. The spectral analysis was
performed with the instrument response functions P7REP_SOURCE_V15
using an unbinned maximum-likelihood method implemented in the tool
gtlike. Isotropic (‘iso_source_v05.txt’) and Galactic diffuse
emission (‘gll_iem_v05_rev1.fit’) components were used to model the background222http://fermi.gsfc.nasa.gov/ssc/data/access/lat/Background
Models.html. The normalizations of both components were allowed to vary freely during the spectral fitting.

| PL | LP | |||||
|---|---|---|---|---|---|---|
| Time Period (MJD) | Time Period (UT) | TSPL | TSLP | |||
| 54682–56143 | 2008-08-04/2012-08-04 | 2.450.02 | 4945 | 2.400.05 | 0.070.02 | 4962 |
| 55351–55381 | 2010-06-04/2010-07-04 | 2.160.05 | 901 | 2.140.07 | 0.020.02 | 902 |
We analysed a region of interest of radius centred at the location of PKS 052136. We evaluated the significance of the -ray signal from the source by means of the maximum-likelihood test statistic TS = 2(log - log), where is the likelihood of the data given the model with () or without () a point source at the position of PKS 052136 (e.g., Mattox et al., 1996). The source model used in gtlike includes all of the point sources from the third Fermi-LAT catalogue (3FGL; Acero et al., 2015) that fall within of the source. The spectra of these sources were parametrized by power-law (PL), log-parabola (LP), or exponentially cut-off power-law model, as in the 3FGL catalogue. A first maximum-likelihood analysis was performed to remove from the model faint sources with fluxes lower than 110-8 ph cm-2 s-1 for avoiding possible problems of fit convergence. A second maximum-likelihood analysis was performed on the updated source model. In the fitting procedure, the normalization factors and the spectral parameters of the sources lying within 10∘ of PKS 052136 were left as free parameters. For the sources located between 10∘ and 15∘ from our target, we kept the normalization and the spectral parameters fixed to the values from the 3FGL catalogue.


The fit with a PL model, , to the data integrated over 48 months of Fermi operation (2008 August–2012 August) in the 0.1–100 GeV energy range results in TS = 4945, with an integrated average flux of (13.9 0.4)10-8 ph cm-2 s-1, and a photon index = 2.45 0.02. Figure 1 shows the -ray light curve of the first 4 years of Fermi observations of PKS 052136 built using 1-month time bins. For each time bin, the photon index was frozen to the value resulting from the likelihood analysis over the whole period. The systematic uncertainty in the flux is dominated by the systematic uncertainty in the effective area (Ackermann et al., 2012b), which amounts to 10 per cent below 100 MeV, decreasing linearly with the logarithm of energy to 5 per cent between 316 MeV and 10 GeV, and increasing linearly with the logarithm of energy up to 15 per cent at 1 TeV 333http://fermi.gsfc.nasa.gov/ssc/data/analysis/LAT_caveats.html.
PKS 052136 has been quite active since 2009 September. An increase of the -ray flux was observed in 2010 January, and subsequently a significant flaring activity occurred in 2010 June. A second light curve focusing on the period of the highest activity (2010 June 4–July 4; MJD 55351–55381) was built with 3-day and 1-day time bins (Fig. 2). Leaving the photon index free to vary during 2010 June 4–July 4, the global fit results in TS = 901 and a photon index = 2.16 0.05, indicating a harder-when-brighter behaviour, similar to what was observed in FSRQs and low-synchrotron-peaked BL Lacs (Abdo et al., 2010b). The peak of the emission was observed on 2010 June 30 (MJD 55377), with a flux of (148 18)10-8 ph cm-2 s-1 in the 0.1–100 GeV energy range, a factor of 11 higher than the average -ray flux during 2008 August–2012 August. The corresponding apparent isotropic -ray peak luminosity is 8.51045 erg s-1. During the period 2010 June 4–July 4, the fit with an LP model, , in the 0.1–100 GeV energy range results in TS = 902, with a spectral slope = 2.14 0.07 at the decorrelation energy = 384 MeV, and a curvature parameter = 0.02 0.02 (Table 1). We used a likelihood ratio test (LRT) to check a PL model (null hypothesis) against an LP model (alternative hypothesis). Following Nolan et al. (2012), these values may be compared by defining the curvature test statistic TScurve=(TSLP - TSPL). The LRT results in TScurve = 1, corresponding to a 1 difference, indicating no significant curvature in the -ray spectrum during the flaring period. Considering the entire period 2008 August 4 – 2012 August 4 the fit with an LP results in TS = 4962, with a spectral slope = 2.40 0.05 at the decorrelation energy = 384 MeV, a curvature parameter = 0.07 0.02, and an average flux of (13.2 0.8)10-8 ph cm-2 s-1 (Table 1), consistent with the results reported in the 3FGL (Acero et al., 2015). The LRT results in TScurve = 17, corresponding to a 4 difference (for 1 degree of freedom). This indicates a significant curvature in the -ray spectrum over the entire period, contrary to what is observed in shorter periods.
In addition to the 3-day and 1-day light curves shown in Fig. 2, we also computed a light curve in 12-hour bins during the period of brightest flux (2010 June 26–July 1). In this light curve (not shown) we note a significant increase from (49 15)10-8 ph cm-2 s-1 to (193 29)10-8 ph cm-2 s-1 between the first and second 12-hr bin on 2010 June 29. The peak flux at 12-hr time-scale corresponds to an apparent isotropic -ray luminosity of 1.11046 erg s-1.
We investigated whether spectral changes are present during the period 2008 August–2012 August, using a PL model. We plot the photon index against the -ray flux above 100 MeV estimated on a monthly time-scale. Unlikely as in Fig. 1, in which the photon indices are fixed, for each time bin the spectral parameters for PKS 052136 and for all the sources within 10∘ from it were left free to vary. No obvious relation between flux and photon index was observed (Fig. 3).
Other high-activity periods of PKS 052136 have been observed in 2011 February and April, and 2012 January. In particular, in 2011 April the source was not detected for the first part of the month, and then a rapid increase of flux from (25 13)10-8 ph cm-2 s-1 to (185 29)10-8 ph cm-2 s-1 was observed between 2011 April 23 and 24 (Fig. 4) with = 2.33, the value obtained leaving the photon index free to vary on monthly time-scales (see Fig. 3, bottom panel). As for Fig. 2, we investigated the 12-hr light curve during the period of brightest flux (2011 April 22–26). We note that an increase from (129 32)10-8 ph cm-2 s-1 to (275 56)10-8 ph cm-2 s-1 was observed between the first and second 12-hr bin on 2011 April 24. The peak flux at 12-hr time-scale corresponds to an apparent isotropic -ray luminosity of 1.21046 erg s-1. It is interesting to note that during the 2010 June and 2011 April flares the peaks show a moderately asymmetric profile (i.e. different rising and decaying times) on a daily time scale. In particular, the rapid increase observed in 2011 April suggests a cooling time longer than the light crossing time R/ related to fast injection of accelerated particles and a slower radiative cooling.
Analyzing the LAT events with GeV collected over 2008 August–2012 August the fit results in TS = 89, a photon index = 2.71 0.27, and a flux of (1.43 0.36)10-10 ph cm-2 s-1. By means of the gtsrcprob tool, we estimated that the highest energy photon emitted from PKS 052136 (with probability 90 per cent of being associated with the source) was observed on 2010 August 17 (MJD 55425), at a distance of 003 from the source and with an energy of 73 GeV.
3 X-ray, UV, and optical data
3.1 Swift observations
The Swift satellite (Gehrels et al., 2004) performed nineteen observations of PKS 052136 between 2005 May 26 and 2011 September 5. In particular five observations were triggered by the -ray activity observed in 2010 June. The observations were performed with all three on-board instruments: the X-ray Telescope (XRT; Burrows et al., 2005, 0.2–10.0 keV), the UV/Optical Telescope (UVOT; Roming et al., 2005, 170–600 nm), and the Burst Alert Telescope (BAT; Barthelmy et al., 2005, 15–150 keV).
3.1.1 Swift-BAT
The hard X-ray flux of this source is below the sensitivity of the BAT instrument for the short exposure time of the individual Swift observations. However, PKS 052136 is detected in the BAT 70-month catalogue444http://heasarc.gsfc.nasa.gov/results/bs70mon, generated from the all-sky survey in the time period 2004 November–2010 August. The data reduction and extraction procedure of the 8-channel spectrum is described in Baumgartner et al. (2013). The 14–195 keV spectrum is described by a power law with photon index of 1.83 0.15 ( = 2.87, 5 d.o.f). The resulting 14–195 keV flux is (3.5 0.3)10-11 erg cm-2 s-1.
| Date | Date | Net Exposure Time | Flux (2–10 keV) | (d.o.f.) | |
|---|---|---|---|---|---|
| (MJD) | (UT) | (s) | (10-11 erg cm-2 s-1) | ||
| 53516 | 2005-26-05 | 900 | 1.720.14 | 1.340.12 | 1.034 (17) |
| 54498 | 2008-02-02 | 4832 | 1.610.06 | 1.320.06 | 1.062 (88) |
| 54503/04 | 2008-02-07/08 | 4947 | 1.590.06 | 1.180.06 | 0.918 (64) |
| 54509 | 2008-02-13 | 2901 | 1.550.09 | 1.270.08 | 0.869 (41) |
| 55260 | 2010-03-05 | 1681 | 1.670.12 | 0.880.11 | 1.082 (20) |
| 55263 | 2010-03-08 | 2405 | 1.620.10 | 1.200.10 | 0.887 (35) |
| 55366 | 2010-06-19 | 2759 | 1.620.08 | 1.860.10 | 1.018 (42) |
| 55370 | 2010-06-23 | 3951 | 1.570.07 | 2.380.14 | 1.020 (57) |
| 55382 | 2010-07-05 | 2774 | 1.640.09 | 1.970.13 | 1.089 (42) |
| 55386 | 2010-07-09 | 2904 | 1.660.09 | 2.060.15 | 1.073 (37) |
| 55390 | 2010-07-13 | 2822 | 1.600.08 | 1.900.11 | 0.992 (40) |
| 55626 | 2011-03-06 | 1126 | 1.780.16 | 1.300.18 | 0.776 (13) |
| 55627 | 2011-03-07 | 2015 | 1.750.10 | 1.490.09 | 0.899 (32) |
| 55661/02 | 2011-04-09/10 | 1868 | 1.620.08 | 1.340.09 | 0.968 (34) |
| 55804/05 | 2011-08-31/09-01 | 1628 | 1.790.12 | 0.800.08 | 1.117 (17) |
| 55809 | 2011-09-05 | 1393 | 1.670.12 | 1.770.15 | 0.928 (21) |
3.1.2 Swift-XRT
The XRT data were processed with standard procedures (xrtpipeline v0.12.6), filtering, and screening criteria by using the HEAsoft package (v6.13). The data were collected in photon counting mode in all the observations, and only XRT event grades 0–12 were selected. Source events were extracted from a circular region with a radius of 20 pixels (1 pixel = 2.36 arcsec), while background events were extracted from a circular region with radius of 50 pixels away from the source region. Some observations showed a source count rate 0.5 counts s-1; thus pile-up correction was required. For those observations we extracted the source events from an annular region with an inner radius of 3 pixels (estimated by means of the PSF fitting technique) and an outer radius of 30 pixels, while background events were extracted from an annular region centered on the source with radii of 70 and 120 pixels. Ancillary response files were generated with xrtmkarf, and account for different extraction regions, vignetting and PSF corrections. We used the spectral redistribution matrices in the calibration database maintained by HEASARC555http://heasarc.gsfc.nasa.gov/. The data collected during 2008 February 7 and 8, 2011 April 9 and 10, and 2011 August 31 and September 1 were summed in order to have enough statistics to obtain a good spectral fit.
We fit the spectra in the 0.3–10 keV energy range with an absorbed power law using the photoelectric absorption model tbabs (Wilms et al., 2000), with a neutral hydrogen column density fixed to its Galactic value (3.581020 cm-2; Kalberla et al., 2005). Considering the lower statistics with respect to the XMM–Newton and Chandra observations, more detailed spectral modelling was not performed with the XRT observations. The fit results are reported in Table 2. Swift-XRT observed the source during 2005–2011 with a 2–10 keV flux in the range (0.8–2.4)10-11 erg cm-2 s-1. No significant change of the photon index was observed. During 2010 mid-June, in the period of highest -ray activity, an increase of the X-ray flux was observed, but not accompanied by significant hardening of the spectrum. Furthermore, by comparing the 2–10 keV flux observed by Swift-XRT with those observed by Chandra (see Sect. 3.2 for details) we noted a significant increase of the flux (a factor of 10) between 1999 and 2011 (Fig. 5).

3.1.3 Swift-UVOT
UVOT observed PKS 052136 in all its optical (, , and ) and UV (, , and ) photometric filters. Data were reduced with the HEAsoft package v6.14 and the 20130118 CALDB-UVOTA release. We extracted the source counts from a circle with 5 arcsec radius centred on the source. Background counts were derived from an annular region centred on the source with 15 and 20 arcsec radii. The observed magnitudes are reported in Table 3. During 2008–2011 the difference between the maximum and minimum magnitude is 0.7, 0.9, 0.7, 1.3, 1.3 and 1.4 mag from the to the band, with the peak of the activity observed on 2010 June 19.
As in e.g. Raiteri et al. (2011), we calculated the effective wavelengths, count-to-flux conversion factors (), and amount of Galactic extinction in the UVOT bands () by convolving the physical quantities with a power-law fit to the source flux and with the UVOT effective areas. In particular, to derive the we adopted the mean extinction law by Cardelli et al. (1989) with = / = 3.1 (the standard value for the diffuse interstellar medium), as well as = 0.112 from Schlafly et al. (2011). To obtain the UVOT de-reddened fluxes we multiplied the count rates by the and corrected for the corresponding Galactic extinction values .
| Date | Date | ||||||
|---|---|---|---|---|---|---|---|
| (MJD) | (UT) | (mag) | (mag) | (mag) | (mag) | (mag) | (mag) |
| 53516 | 2005-26-05 | – | – | – | 15.940.02 | – | – |
| 54498 | 2008-02-02 | – | – | – | 15.110.02 | – | – |
| 54503 | 2008-02-07 | – | – | – | 15.670.04 | – | – |
| 54504 | 2008-02-08 | 15.160.03 | 15.890.03 | 15.410.03 | 15.580.03 | 15.710.03 | 15.820.03 |
| 54509 | 2008-02-13 | 15.150.03 | 15.930.03 | 15.420.03 | 15.590.03 | 15.690.04 | 15.830.03 |
| 55260 | 2010-03-05 | 14.940.04 | 15.680.03 | 15.130.03 | 15.340.03 | 15.440.04 | 15.590.03 |
| 55263 | 2010-03-08 | – | – | – | 15.180.02 | – | – |
| 55366 | 2010-06-19 | 14.580.03 | 15.120.02 | 14.490.03 | 14.540.02 | 14.630.03 | 14.540.03 |
| 55370 | 2010-06-23 | 14.980.03 | 15.670.03 | 15.180.03 | 15.360.03 | 15.510.03 | 15.630.03 |
| 55382 | 2010-07-05 | 14.830.03 | 15.480.03 | 14.930.03 | 15.110.03 | 15.170.03 | 15.270.03 |
| 55386 | 2010-07-09 | 14.930.03 | 15.610.03 | 15.080.03 | 15.280.03 | 15.330.03 | 15.460.03 |
| 55390 | 2010-07-13 | 15.090.03 | 15.870.03 | 15.330.03 | 15.440.03 | 15.670.04 | 15.740.03 |
| 55626 | 2011-03-06 | 15.270.05 | 16.050.04 | 15.580.04 | 15.710.04 | 15.900.05 | 15.970.04 |
| 55627 | 2011-03-07 | – | – | – | 15.740.02 | – | – |
| 55661 | 2011-04-09 | 15.140.05 | 15.950.04 | 15.500.05 | 15.590.05 | 15.760.06 | 15.830.04 |
| 55662 | 2011-04-10 | 15.100.05 | 15.900.04 | 15.390.04 | 15.560.05 | 15.690.05 | 15.830.04 |
| 55804 | 2011-08-31 | – | – | 15.630.03 | – | – | – |
| 55805 | 2011-09-01 | 15.230.05 | 15.990.04 | 15.530.04 | 15.810.05 | 15.700.05 | 15.850.03 |
| 55809 | 2011-09-05 | 14.940.04 | 15.570.03 | 15.130.04 | 15.390.04 | 15.580.04 | 15.780.03 |
3.2 XMM–Newton and Chandra observations
| Component | Parameter | Value |
|---|---|---|
| Nucleus | NH (cm-2) | (4.82 0.03)1020 |
| 1.7 0.1 | ||
| norm (ph keV-1 cm-2 s-1) | (3.1 0.4)10-4 | |
| F (erg cm-2 s-1) | (1.3 0.2)10-12 | |
| Jet | NH (cm-2) | 3.581020 (fixed) |
| 2.2 0.3 | ||
| norm (ph keV-1 cm-2 s-1) | (2.4)10-5 | |
| F (erg cm-2 s-1) | (6.0)10-14 |
PKS 0521–36 was observed by the Chandra and XMM–Newton X–ray
satellites on 1999 December 31 (MJD 51543) and 2002 May 26 (MJD 52420), respectively.
The spectral analysis was performed using the XSPEC v12.7 package.
Chandra ACIS–S spectra and instrument responses were generated using the Chandra Interactive Analysis of Observations (CIAO) v4.3 and the related Chandra calibration database. The 0.3–7 keV image shows the presence of an unresolved core, a diffuse halo and a jet feature coincident with the inner radio/optical jet (see Birkinshaw et al., 2002).
The nuclear spectrum was extracted from an annular region (rin = 0.3
arcsec, rout = 1.2 arcsec) in order to minimize pile up
effects666Using the PIMMS software (http://cxc.harvard.edu/toolkit/
pimms.jsp) the pile up for this source was
estimated to be around 4 per cent. The background counts were extracted
from three source–free circular regions of r = 1.2 arcsec each.
The 0.5–7 keV spectrum is well fitted (/dof=187/199) by a power law absorbed by a column
density slightly in excess of the Galactic value, NH =
(4.82 0.03)1020 cm-2.
The spectrum of the jet was extracted from a circle of radius 1 arcsec at a distance of 1.2 arcsec from the core. The background was chosen from three source–free circular regions. The best fit model is a power law with photon index = 2.2 0.3. The 2–10 keV flux of the jet is roughly twenty times lower than the core flux. Chandra spectral results for the nucleus and the jet are listed in Table 4.
The XMM–Newton EPIC observation of PKS 052136 was analyzed using the Science Analysis System (SAS) v11.0 software and
available calibration files. Time intervals affected by high background were excluded. After this data cleaning, we obtained a net
exposure of 26.6 ks and a count rate of 3.50 0.01 count s-1 for the
pn. The source and background spectra were extracted from circular regions of
32 arcsec and 44 arcsec radius, respectively. The response matrices were
created using the SAS commands RMFGEN and ARFGEN. The nuclear data are not piled up. Data were grouped into 25 counts per bin in order to apply the statistic. A power law, absorbed by Galactic column density, plus a thermal (APEC) component is a good parametrization of the data
(/dof=972/925). In Foschini et al. (2006), a broken power law model
absorbed by the Galactic column was reported as the best fit to these XMM–Newton data.
However the 0.5–10 keV best fit model turns out to
be a combination of a broken power-law, describing the nuclear radiation, plus a
Raymond–Smith component (/dof=947/923), which accounts for the
thermal emission of the diffuse halo around the source, necessarily inside the
32 arcsec extraction radius. It is interesting to note
that the two spectral indices of the broken power-law are similar to those
observed for the nucleus and the jet by Chandra. This may indicate that we are
observing both these components in the XMM–Newton spectrum. An alternative possibility is that in the XMM–Newton spectrum we are observing the tail of the synchrotron emission and the rise of the IC component from the jet. There is no significant evidence for a Fe K emission line. XMM–Newton spectral results are listed in Table 5.
| Parameter | Value |
|---|---|
| 2.4 0.2 | |
| Eb (keV) | 0.76 |
| 1.7 0.2 | |
| norm (ph keV-1 cm-2 s-1) | (1.7 0.1)10-3 |
| kT (eV) | 0.85 |
| norm (ph keV-1 cm-2 s-1) | (8.2 2.7)10-5 |
| F (erg cm-2 s-1) | (8.0 0.7)10-12 |
4 Radio data
4.1 VLBA observations
| (mJy) | (mJy) | (mas) | (mas) | (∘) | (∘) | (mas) | (mas) | (∘) | ||
|---|---|---|---|---|---|---|---|---|---|---|
| 545 | 815 | 0.00 | 0.00 | 0.0 | 0.0 | 0.00 | 0.00 | 0 | 0 | 0.7 |
| 414 | 584 | 0.28 | 0.27 | 54.9 | 33.6 | 0.37 | 0.27 | 1 | 0 | 0.6 |
| 233 | 195 | 0.96 | 0.96 | 42.9 | 43.0 | 0.44 | 0.25 | 1 | 0 | 0.3 |
| 100 | 72 | 2.06 | 2.28 | 34.1 | 42.8 | 0.87 | 1.11 | 1 | 0 | 0.5 |
| 33 | 12 | 4.30 | 4.35 | 40.8 | 39.9 | 1.18 | 1.18 | 1 | 0 | 1.7 |
| 38 | 25 | 10.8 | 10.8 | 55.5 | 55.5 | 4.58 | 4.58 | 1 | 0 | 0.7 |
| 298 | 220 | 27.9 | 27.9 | 45.9 | 45.9 | 7.95 | 7.95 | 0.58a | 19.7a | 0.5 |
| 94 | 59 | 35.3 | 35.3 | 47.3 | 47.3 | 8.53 | 8.53 | 0.47a | 6.9a | 0.8 |
PKS 052136 was observed with the VLBA at 8 and 15 GHz on 2003 January 7. The central frequencies of the two bands were 8.421 GHz and 15.356 GHz and the total bandwidth was 32 MHz for each band. The on-source time was about 30 and 50 min at 8 and 15 GHz, respectively, divided into 10 scans distributed over a wide range of hour angle, to ensure the best sampling of the -plane. One station (North Liberty) could not provide data, while two performed poorly because of snow (Hancock) and hardware problems (Brewster).
We downloaded the data from the National Radio Astronomy Observatory (NRAO) archive and performed the typical steps of calibration in the astronomical image processing system (AIPS). We used system temperature and gain curve tables for the visibility amplitude calibration and FRING for the delay, rate, and visibility phase. Uncertainties on the amplitude calibration are about 10%. Several cycles of self-calibration were then performed in DIFMAP to improve the initial calibration, both in phase and amplitude, and produce final images.
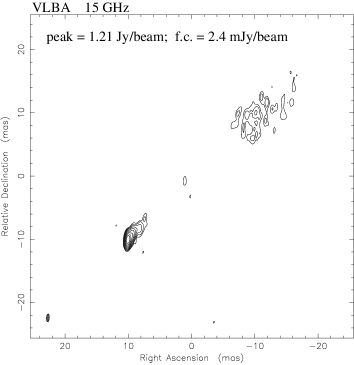
In Figs. 6 and 7, we show total intensity images of PKS 052136 at 8 and 15 GHz, respectively. The source is well detected at both frequencies, with a bright compact core and a one-sided jet oriented in PA on the plane of the sky. The brightness profile along the jet axis decreases rapidly with increasing distance from the core, but it then suddenly rises again at mas. The total flux density is 1.78 and 1.93 Jy at 8 and 15 GHz, respectively, with a peak brightness of 0.94 and 1.21 Jy beam-1. The core has an inverted spectral index of = –0.4 (). The bright jet emission region at mas has a flux density mJy and mJy, corresponding to a spectral index of .
In Table 6, we report the parameters of a model fit with Gaussian components to the visibility plane. We have first model-fitted the 8 GHz visibilities with delta (for the core), circular (for the inner jet), and elliptical (for the outer blob) Gaussian components, until we reached convergence. Then, we used this model as a starting condition for the model fit to the 15 GHz visibilities. In this latter fit, we kept the position and size of the outer three components fixed, while all the other parameters (including the flux density of every component) were left free to vary.
In order to maximize sensitivity to the diffuse jet emission, we also produced an image applying a Gaussian taper of 0.3 at a radius of 30 M to the 8 GHz dataset. This yields a resolution of in PA 23, a peak brightness in the jet region of about 185 mJy beam-1, and an off source peak of 1.4 mJy beam-1 on the counter-jet side.

4.2 VLA data
To obtain information on the radio flux density on kiloparsec-scale, we retrieved archival NRAO VLA data at 4.9 and 8.4 GHz. Observations of PKS 052136 were performed at 4.9 GHz on 2009 August 6, when the array was in C configuration, while 8.4-GHz observations were carried out on 2009 October 3 when the array was in the hybrid C and D configuration. During both runs the target was observed for about 40 s. A few antennas did not participate in the observations due to a system upgrade. The primary flux density calibrator was 3C 48. Uncertainties on the amplitude calibration (1) are about 5 per cent at both frequencies. The data reduction was carried out following the standard procedures for the VLA implemented in the NRAO AIPS package. The flux density at each frequency was measured on the final image produced after a few phase-only self-calibration iterations using TVSTAT, which performs an aperture integration over a selected region on the image plane. Flux density of the compact components was measured by the AIPS task JMFIT, which performs a Gaussian fit of the source component on the image plane. Flux densities are reported in Table 7. The resolution achieved is about 17 arcsec 4 arcsec and 11 arcsec 6 arcsec at 4.9 and 8.4 GHz, respectively.
In Figs. 8 and 9 we show the total intensity images at 4.9 and 8.4 GHz, respectively. The radio emission is dominated by two compact components, labelled C and S, whose flux density is about 80 per cent and 73 per cent of the source total flux density at 4.9 and 8.4 GHz, respectively. The central component, coincident with the optical nucleus, has an inverted spectrum ( –0.10.1) and hosts the source core. This value is larger than that derived from VLBA data and this is likely due to the contribution of the jet that cannot be separated from the core component due to the lower resolution of the VLA observations. A jet-like structure, labelled J, emerges from the core with a position angle of about 45∘, in agreement with what is found in high-resolution VLBA images (Fig. 7). At about 5 arcsec (5 kpc) from the core, the jet bends toward the west, producing an extended structure of about 30 arcsec ( kpc) in size, in agreement with what is found at lower frequencies (Falomo et al., 2009; Ekers et al., 1989). Component S is located about 7 arcsec ( kpc) from the central component with a position angle of 120∘ and it marks the location of the hotspot. Its spectral index is rather steep = 1.00.1 and it is likely due to the low resolution of these observations, which does not allow us to disentangle the contribution of the hotspot from that of the lobe. It is worth noting that the spectral indices have been computed assuming the total flux density measured on images with different resolution, which may produce an artificial steepening of the spectrum. The errors on the spectral index have been computed by means of the error propagation theory.
| Comp | |||
|---|---|---|---|
| Jy | Jy | ||
| C | 3.720.18 | 3.940.20 | –0.10.1 |
| S | 2.180.11 | 1.350.07 | 1.00.1 |
| Ext | 1.120.06 | 0.350.03 | 2.10.2 |
| Tot | 7.020.35 | 5.640.28 | 0.40.1 |


4.3 UMRAO data
UMRAO centimeter band total flux density observations were obtained with the University of Michigan 26 m paraboloid located in Dexter, Michigan, USA. The instrument is equipped with transistor-based radiometers operating at frequencies centered at 4.8, 8.0, and 14.5 GHz with bandwidths of 0.68, 0.79, and 1.68 GHz, respectively. Dual horn feed systems are used at 8 and 14.5 GHz. Each observation consisted of a series of 8 to 16 individual measurements over approximately a 25 to 45 min time period, utilizing an ON-ON technique (switching the target source between the two feed horns which are closely spaced on the sky) at 8.0 and 14.5 GHz. As part of the observing procedure, drift scans were made across strong sources to verify the telescope pointing correction curves, and observations of nearby calibrators were obtained every 1 to 2 hours to correct for temporal changes in the antenna aperture efficiency. Further details about UMRAO are reported in Aller et al. (2014). UMRAO data at 8 GHz and 14.5 GHz are represented in Fig. 10.
4.4 SMA data
The 230 GHz (1.3 mm) light curve was obtained at the SMA on Mauna Kea (Hawaii). PKS 052136 is a bright AGN included in an ongoing monitoring program at the SMA to determine the fluxes of compact extragalactic radio sources that can be used as calibrators at mm wavelengths. Details of the observations and data reduction can be found in Gurwell et al. (2007). Data from this programme are updated regularly and are available at the SMA website777http://sma1.sma.hawaii.edu/callist/callist.html. Use in publication requires obtaining permission in advance.. SMA data at 230 GHz are shown in Fig. 10.

5 Discussion
5.1 Identification of the -ray source
The association of a -ray source with a low-energy counterpart is fundamental for understanding its physical properties. The accuracy with which most of the -ray sources were localized with EGRET was not enough to associate them with a known counterpart, leaving the legacy of a large fraction of unidentified sources in -rays. Thanks to larger photon statistics and unprecedented angular resolution at high energies Fermi-LAT is able to investigate the natures and counterparts of these unidentified sources, although the -ray activity state as well as correlated flux variability at different frequencies play an important role for the identification process of a -ray source (e.g., D’Ammando et al., 2012).
A -ray source at a position compatible with PKS 052136 was detected with a 4.3 significance by EGRET during 1992 May 14–June 4, with a flux of (1.8 0.5)10-7 ph cm-2 s-1 and a photon index = 2.16 0.36 (Lin et al., 1995). As a result of that activity the source was included in the Second EGRET catalogue as 2EG J05243630 (Thompson et al., 1995). The -ray source 3EG J05303626 was included in the Third EGRET catalogue, but PKS 052136 was outside the 99 per cent confidence contour in that catalogue, and the association between the -ray source and the AGN was not confirmed (Hartman et al., 1999). The same conclusion was drawn for the -ray source EGR J05293608 reported in the revised EGRET catalogue proposed by Casandjian & Grenier (2008).
No -ray source associated with PKS 052136 was reported in the LAT Bright Source List obtained after the first three months of Fermi operation (Abdo et al., 2009), but the AGN was associated with 1FGL J0522.83632, 2FGL J0523.03628, and 3FGL J0522.93628 in the following Fermi catalogues (Abdo et al., 2010a; Nolan et al., 2012; Acero et al., 2015).
Most of the associations of -ray sources with AGN in the Fermi catalogues have high probability of being true, but a firm identification needs to be confirmed by means of correlated variability in different energy bands. The contemporaneous increase of activity observed in the optical, UV, X-ray, and -ray bands in 2010 June (Fig. 10) is a distinctive signature for the identification of the -ray source with PKS 052136. In the following, we investigate the properties of PKS 052136 from radio to -ray energy bands with the goal of unveiling the nature of this -ray emitting AGN.
5.2 Gamma-ray properties
By comparing the -ray properties of PKS 052136 with those of the different types of AGN detected by LAT, we noted that the average photon index of this source ( = 2.45 0.02) is similar to the average value observed for FSRQ ( = 2.44 0.20; Ackermann et al., 2015) and misaligned AGN ( = 2.42 0.28; Abdo et al., 2010). As shown in Fig. 3, there is no general trend between -ray flux and photon index for PKS 052136, but a significant hardening of the spectrum was observed during the -ray flaring activity in 2010 June. This behaviour is in common with bright FSRQ and low-synchrotron-peaked BL Lacs detected by LAT (Abdo et al., 2010b). The hardening of the spectrum together with the low redshift make this source a promising target for the current (i.e., MAGIC, VERITAS, and H.E.S.S.) and next generation of imaging atmospheric Cherenkov telescopes (e.g., the Cherenkov Telescope Array). It is interesting to note that one of the few radio galaxies detected at Very High Energy (VHE; E 100 GeV), NGC 1275 (Aleksic et al., 2012), showed flux and spectral index similar to those of PKS 052136 during the 2010 June flare.
Contrary to the photon index, the average apparent isotropic -ray luminosity of PKS 052136 (Lγ = 5.21044 erg s-1) seems to lie in the region usually occupied by BL Lacs and radio galaxies (Ackermann et al., 2015). However, the lower apparent luminosity of PKS 052136 with respect to both FSRQ and the steep spectrum radio quasars (SSRQ) 3C 380 and 3C 207 may be due to the close proximity of the source. In fact, a -ray flaring activity with peak flux of 1–210-6 ph cm-2 s-1, as observed for PKS 052136, is quite uncommon in BL Lacs (e.g., Cannon et al., 2010) and in misaligned AGN, the only exception being the radio galaxy NGC 1275 (e.g., Ciprini, 2013).
It is not clear whether the most powerful jets of the two parent populations (FSRQ and FR II radio galaxies) have analogous structures. The difference in the jet structure may be related to the different environment or to jet properties. We noted that the FR II radio galaxy Cygnus A, one of the most powerful radio sources with a redshift comparable to that of PKS 052136, has not been detected in -rays so far. On the other hand, Pictor A, an FR II radio galaxy at redshift = 0.035, was detected by Fermi-LAT (Acero et al., 2015), but with an apparent -ray luminosity that is two order of magnitudes lower than that observed for PKS 052136. This may support the scenario of a complex jet structure in radio galaxies (e.g., velocity gradients, spine-layer) with possible differences in the emission mechanisms at higher energies also among objects of the same class. Alternatively, the different viewing angle with respect to the observer, and thus the different Doppler boosting of the jet emission, may lead to the detection or not of radio galaxies in -rays.
No significant difference was observed between the average -ray flux detected by EGRET in 1992 and LAT during 2008–2012. This is different from the long-term variability observed for the radio-galaxy NGC 1275 between the EGRET and Fermi era. In that case, the early LAT observations revealed a flux at least seven times higher than the upper limit obtained by EGRET (Kataoka et al., 2010). Of particular interest is the short variability observed during flaring periods with a doubling time scale of the order of a few hours, compatible with the variability observed in some bright FSRQ (e.g., Saito et al., 2013; Tavecchio et al., 2010; Abdo et al., 2010c). If the emitting region fills the entire cross section of the jet, this rapid variability suggests a compact -ray emitting region and the location of the -ray emission may be within the broad-line region (BLR). Following the causality argument and considering the 12-hr variability observed during the -ray flares the size of the emitting region should be = 6.3 1015 cm (assuming = 5; see Section 5.5). This size is smaller than the values usually inferred from the SED modeling of blazars within the framework of the standard one-zone leptonic model (e.g., Ghisellini et al., 2011). Alternatively, episodes of fast variability can be produced in a jets-within-jet/mini-jets scenario (e.g. Ghisellini et al., 2008; Giannios et al., 2009) and in this case the location may be further out, as proposed e.g. for M 87 (e.g. Giroletti et al., 2012), or produced by turbulent cells in the relativistic plasma (Marscher, 2014).
5.3 Radio properties
On a kpc scale, the radio source shows a two-sided structure where jets, lobes, and a hot spot are clearly visible in addition to the core. The structure revealed by the VLBA images agrees with those reported in previous works (e.g. Tingay & Edwards, 2002; Giroletti et al., 2004). However, since the data were taken at distant epochs and at different frequencies, it is difficult to make a reliable identification of the individual components. The best possible match is probably on the bright diffuse region at mas, whose flux density and position are consistent in the various datasets, and essentially stationary within the uncertainty related to its large size ( mas). This bright resolved structure is reminiscent of two other -ray emitting AGN somewhat different from the typical blazars, i.e. M 87 (Abdo et al., 2009) and 3C 120 (Abdo et al., 2010; Kataoka et al., 2011). On parsec scales, both sources show a one-sided jet whose brightness profile along the axis initially decreases down to the noise level and then steeply rises in an extended, stationary feature. The projected distance of this feature is pc in 3C 120 (Roca-Sogorb et al., 2010) and pc in M 87 (Giroletti et al., 2012; Cheung et al., 2007). In PKS 052136, a bright, extended jet feature is found at nearly 30 pc (projected). These features may be interpreted as recollimation shocks, and at least in the case of M87 it has been proposed that high-energy emission up to the TeV regime might originate at this location (Bromberg & Levinson, 2009). Recently, a similar scenario was suggested also for the rapid VHE flaring activity of the FSRQ 4C 21.35 (Tavecchio et al., 2011), although different models are proposed (Ackermann et al., 2014; Dermer et al., 2012; Tavecchio et al., 2012).
We estimated the ranges of viewing angles and jet velocity () from the jet/counter-jet brightness ratio from the radio images presented in Sec. 4.1. Assuming the off-nuclear peak on the counter-jet side as an upper limit to any possible counter-jet brightness, we calculate a jet-counterjet brightness ratio . In the standard hypothesis that jet and counter-jet are intrinsically similar and that any asymmetry is entirely due to relativistic beaming, this places limits on the jet velocity and orientation by
| (1) |
and we obtain , , , assuming .
The radio spectrum below 1 GHz is dominated by the flux density
arising from the extended structures. The spectral index computed
between 160 MHz (Slee, 1977) and 1.4 GHz from the NRAO VLA Sky Survey
(Condon et al., 1998)
results to be 0.7. This radio spectral shape and the optical emission
suggest that PKS 052136 may be an intermediate object between a broad-line radio galaxy (BLRG) and an SSRQ.
We computed the core dominance (CD) of PKS 052136 following the
definition in Orr & Browne (1982); Abdo et al. (2010b):
| (2) |
where the core flux density and the total flux density refer to the source rest frame (). For the core flux density we consider the value measured on the VLA image at 4.9 GHz and reported in Table 6, and we assume a flat spectrum . In order to prevent missing flux density associated with extended emission, we consider the total flux density measured by the Parkes telescope at 5 GHz, which is = 8.1 Jy (Wright et al., 1996), and we assume a spectral index . We obtain log(CD) = 0.10. This value is similar to those shown by the -ray emitting SSRQ 3C 380 and 3C 207 and BLRG 3C 111 (Abdo et al., 2010b).
In order to estimate the radio power and to make a comparison with the -ray emitting misaligned AGN, we computed the radio luminosity at 178 MHz by using:
| (3) |
where is the luminosity distance, and S is the flux density at 178 MHz, which has been extrapolated from the values reported in the literature and corresponds to 67.5 Jy (source rest frame). The corresponding luminosity is L = 4.81026 W/Hz, which is a few orders of magnitude lower than the luminosity of the SSRQ 3C 380 and 3C 207, but is comparable with the luminosity of the BLRG 3C 111.
5.4 X-ray to mm behaviour
During 2005–2011 the source was monitored by the Swift satellite only sporadically, but a quite prominent flare was observed from optical to X-rays in 2010 June, contemporaneous with the peak of -ray flaring activity (see Section 5.1). The small variability amplitude (calculated as the ratio of maximum to minimum flux) observed in X-rays ( 3) with respect to that observed in -rays ( 13 on a monthly time-scale up to a factor of 50 on a daily time-scale) together with the lack of hardening of the spectrum may be an indication that the X-ray emission is produced by the low-energy tail of the same electron distribution, as observed in FSRQ (e.g., PKS 1510089; D’Ammando et al., 2011). On a time-scale of years a change by a factor of 10 in flux was detected between the Chandra and Swift observations. A second less prominent increase of the X-ray activity was observed on 2011 September 5, with no evident counterpart in -rays. This may be due to different mechanisms or emission sites that give significant contribution in X-rays and -rays in that period. The photon indices observed by Swift-BAT and Swift-XRT in hard X-rays ( 1.8) and soft X-rays ( 1.7) indicates that the peak of the IC emission should be at MeV energies, according to the spectra observed by Fermi-LAT ( 2).
The variability amplitude in the optical-UV bands covered by Swift-UVOT is 1.9, 2.4, 2.9, 3.2, 3.2, and 3.7. We observed a larger variability amplitude at higher frequencies, contrary to what is observed in quasars, where the contribution from the thermal accretion disc significantly increases in the UV part of the spectrum, diluting the jet emission (e.g. Raiteri et al., 2012). This suggests the lack of a prominent accretion disc in the broad-band spectrum of the source. We noted that during the flaring activity in 2010 June the optical and UV emission seems to peak a few days before the X-ray peak. This may be due the coverage provided by the Swift observations, and thus the lack of an observation at the time of the daily -ray peak, or to the complex jet structure with different parts of the jet responsible for the emission at different frequencies.
The SMA data at 230 GHz show an amplitude variability of 4, with a peak flux density of 8 Jy on 2010 December 30 (MJD 55560). This event at millimeter wavelengths may be the delayed flare with respect to the -ray flare observed in 2010 June. The increase of flux density was observed also by UMRAO at 15 and 8 GHz, with the difference in time of about 1 month and 2 months, respectively, with respect to the 230 GHz emission likely related to opacity effects due to synchrotron self-absorption. Recently, Fuhrmann et al. (2014) investigated the correlation between radio and -ray emission for a sample of bright Fermi blazars. Performing a stacking analysis of the objects in the sample, they found at 142 GHz a time-lag of (79) days between the radio and -ray emission, with the -ray leading the radio emission. In this context a delay of six months between the peak at 230 GHz and the -ray one for PKS 052136 is extremely large and thus unlikely, opening alternative scenarios. The emitting region responsible for the optical-to--ray emission may be different from the region producing the mm and radio emission. However, we note that SMA data are not available in 2010 May–June, and therefore we cannot rule out a mm flare in the same period of the -ray flare.
5.5 SED modeling
We build two SED for PKS 052136 in two different activity states: the high state in 2010 June and a low state in 2010 February-March. The flaring SED includes the Fermi-LAT spectrum built with data centred on 2010 June 22–July 5 (MJD 55369–55382), the optical, UV, and X-ray data collected by Swift on 2010 June 23 (MJD 55370), and 230 GHz data collected by SMA on 2010 July 1 (MJD 55378). The low SED includes the LAT spectrum built with data centred on 2010 February 1–March 31 (MJD 55228–55286), the optical, UV, and X-ray data collected by Swift on 2010 March 5 (MJD 55260), and 230 GHz data collected by SMA on 2010 February 24 (MJD 55251).
The modeling of the SED of PKS 052136 within the framework of the standard one-zone leptonic model provides results at odds with the bulk of the blazar population. In particular, a quite low Doppler factor is required ( 3; e.g., Pian et al., 1996; Ghisellini et al., 2011), implying a relatively large viewing angle ∘ and a low bulk Lorentz factor. This result can be traced back to the relatively small separation between the two bumps in the SED. This conclusion is corroborated by several hints, such as the existence of a large-scale optical jet and the moderate core-to-extended radio flux ratio. In the case of a relatively large viewing angle and thus small beaming amplification, it is not excluded that also slow regions of the jets contribute to the observed emission. This would be the case in the framework of the structured jet scenario, in which the flow is supposed to be composed of a fast inner core – or spine – surrounded by slower plasma – the layer (Ghisellini et al., 2005; Tavecchio & Ghisellini, 2008). Indeed such a scheme has been applied to interpret the emission of -ray emitting radio galaxies, for which the emission can be interpreted as a mix of spine and layer components (see also Tavecchio & Ghisellini, 2014). With this motivation, in the following we focus our attention on the application of the structured jet model to the emission of PKS 052136.
We briefly recall the main features and the parameters of the model (refer to Ghisellini et al. 2005, Tavecchio & Ghisellini 2008, 2014 for a more complete description). The spine is assumed to be a cylinder with height and radius (the subscripts ‘s’ and ‘l’ stand for spine and layer, respectively). The layer is modeled as a hollow cylinder with height , internal radius and external radius . We assume , ideally corresponding to the case of a perturbation traveling down the spine, surrounded by a relatively long and stationary layer of slow plasma.

| cm | cm | erg s-1 | G | deg | |||||||
| Layer low | 0.5 | 100 | 1.5 | 3 | 3 | 6 | |||||
| Spine low | 0.18 | 60 | 2 | 3.7 | 12 | 6 | |||||
| Layer high | 0.5 | 100 | 1.5 | 3 | 3 | 6 | |||||
| Spine high | 0.17 | 60 | 2.1 | 3 | 12 | 6 | |||||
| Layer low | 1 | 80 | 2.75 | 4 | 3 | 15 | |||||
| Layer high | 1 | 100 | 2.7 | 4 | 3 | 15 | |||||
| Spine∗ | 15 | 10 | 2.1 | 3 | 10 | 15 | |||||
| Layer high | 1 | 80 | 2.7 | 4 | 3 | 20 | |||||
| Spine high | 15 | 10 | 2.1 | 3 | 10 | 20 |
In both zones we assume a phenomenological and stationary electron energy distribution described as a broken power law with the following parameters: minimum, maximum and break Lorentz factors , and and indices and . The normalization of the electron distribution is parametrized by the emitted synchrotron luminosity, . The emitting regions contain a tangled magnetic field , . The relativistic beaming is specified by the two Lorentz factors , and by the viewing angle .
Electrons emit through synchrotron and IC mechanisms. Following Ghisellini et al. (2009), = 1017 cm and for = 31043 erg s-1 we obtain = 21016 cm. Therefore the emitting region should be beyond the BLR and for this reason the external Compton of the BLR seed photons should be negligible. For the IC besides the local synchrotron radiation field (synchrotron self-Compton, SSC) we consider the beamed radiation field of the other component. Indeed, because of the relative motion, the energy density of radiation produced in one component is boosted by the square of the relative Lorentz factor in the rest frame of the other, where . As we will see, absorption of -rays through the interaction with the soft radiation field, can be important. In the case under study, radiation is produced and absorbed within the same region and thus the “suppression factor” is which, for large optical depths, is well approximated by .
We note that the number of the parameters is large (almost twice that of the simple SSC model). However, the model has to satisfy constraints that can be used as guidelines in selecting the suitable setup. We refer to Tavecchio & Ghisellini (2014) for a detailed discussion.
Following the indications recalled in the previous subsections we consider angles larger than those usually associated with blazar jets, . In Fig. 11 we show the results of the modeling of the SED with three different angles, , and . The corresponding parameters are reported in Table 8.
We expect that, for relatively small angles, the spine radiation is much more boosted than that of the layer, implying that the spine emission component largely dominates the observed SED. This solution is that assumed for the case (upper panel). The relative stability of the low-energy component accompanied by the variation which occurred in the IC peak is obtained by changing the layer luminosity (and maintaining almost the same parameters for the spine). In fact, the spine IC bump is dominated in the high state by the component resulting from the IC scattering of the electrons in the spine with the photons coming from the layer. Variations of the layer luminosity are thus accompanied by substantial variations of the IC luminosity of the spine.
For larger angles the only suitable solution is that the two bumps are dominated by the two jet components, i.e. the low energy bump by the synchrotron component of the spine and the high energy bump by the IC emission of the layer (see the discussion in Tavecchio & Ghisellini, 2014). For (middle panel) the model still reproduces quite well the data. In this case we also assume a stationary spine and a variable layer component. A further increase of the angle (lower panel) is limited by a problem already discussed in Tavecchio & Ghisellini (2014). Indeed, to compensate the reduced relativistic amplification of the spine emission one has to increase its intrinsic luminosity. This radiation field – concentrated in the optical-IR band – is the ideal target for the pair producing reactions with -ray photons produced in the layer. In Fig. 12, we show the optical depth and the corresponding “suppression factor” as a function of the frequency for the case and . The shapes of the curves, related to the spine target photon spectrum, are similar. However, due to the larger intrinsic luminosity, for the optical depth is larger by a factor of . As a consequence, while the source is transparent ( up to GeV, corresponding to the highest-energy LAT bin in the high state, energy marked by the vertical yellow line), for , the optical depth reaches unity already at GeV and rapidly increases, determining the abrupt cut–off visible in Fig. 11 (lower panel). We therefore conclude that, in the framework of the structured jet model, the angle cannot be larger than about .
In the unification scheme for radio galaxies and blazars we expect that, once observed at small angles, the SED of a radio galaxy resembles that of a typical blazar. Therefore for the remaining two cases, and one can further ask what kind of SED would the source present if observed at angles more typical for blazars. This is shown in Fig. 13, in which we report the SED as recorded by an observer at , not changing the other parameters. For comparison we also display the historical SED of BL Lacertae. The case (green) results in an SED strongly unbalanced (by a factor ) toward the synchrotron luminosity, at odds with the typical blazar SED. This effect is clearly related to the fact that the high-energy bump in the case is associated with the layer. At small angles, the layer radiation is much less beamed than that of the spine and this determines the substantial prominence of the low-energy peak. On the contrary, the SED for case (red) resembles that of the prototypical BL Lac. This suggests that a viewing angle between and is favored.
In addition in the spine-layer scenario proposed here, the fast variability observed in -rays is difficult to reconcile with the cases that have , in which the region responsible for the -ray emission is relatively large (51016 cm) and the Doppler factor small ( = 4). Reducing the size of the emitting region in these two cases should lead to an increase of the compactness of the region and thus of the corresponding –ray opacity. This is another indication in favour of a relatively small viewing angle.
However, we cannot rule out the possibility that PKS 052136 is an AGN seen at 15∘ and its ‘aligned’ counterpart is a blazar belonging to a population of synchrotron-dominated objects.


6 Conclusions
We investigated the properties of PKS 052136, an AGN with uncertain classification. We report results on multiwavelength observations of this source obtained from radio through rays by SMA, UMRAO, VLA, Swift and Fermi-LAT, mostly during 2008 August–2012 August. In addition archival XMM–Newton, Chandra, and VLBA observations were analyzed.
The historical classification of this source as a BL Lac object is in contrast with the broad emission lines observed in optical and UV, with EW larger than 5 Å (rest-frame). The presence of broad emission lines may suggest a classification as an FSRQ, but the radio spectrum below 1.4 GHz is not flat ( 0.7). The radio spectral shape and the optical emission lines indicate a possible classification as an intermediate object between BLRG and SSRQ. On pc-scales PKS 052136 shows a one-sided jet with a brightness distribution along the axis decreasing down to the noise level and then rising in an extended, stationary feature at nearly 30 pc. This is similar to what was observed in M 87 and 3C 120, two -ray emitting misaligned AGN. The core dominance estimated for PKS 052136 is similar to those of the -ray emitting SSRQ 3C 380 and 3C 207 and BLRG 3C 111, suggesting an intermediate viewing angle with respect to the observer.
The fit of the XMM–Newton EPIC pn spectrum confirmed the presence of a contribution of the thermal component identified by Birkinshaw et al. (2002) in the Chandra image as a diffuse halo around the AGN. No significant Fe K emission was detected in the XMM–Newton spectrum. This seems to disagree with the possible classification of PKS 052136 as a BLRG, although a smaller viewing angle with respect to the other BLRG may lead to a significant increase of the jet component that overwhelms the Fe K line in this object (similarly to the case of the narrow-line Seyfert 1 galaxy PMN J09480022; D’Ammando et al., 2015).
The contemporaneous flux increase observed from optical to rays during 2010 June suggests the identification of the -ray source with PKS 052136. The 230 GHz light curve showed an increase of activity peaking on 2011 January. A delay of 6 months between the emission at mm and rays is unlikely, suggesting that different parts of the jet are responsible for those activities. However, we cannot rule out that a mm peak contemporaneous to the -ray one was missed due to the lack of observations at 230 GHz in 2010 May–June. The average -ray photon index of the source ( = 2.45 0.02) is similar to the average value observed for FSRQ as well as for the FR II radio galaxies (in particular the SSRQ). Moreover, the average apparent isotropic luminosity of the source (Lγ = 5.2 1044 erg s-1) is in agreement with the values observed for BL Lacs and radio galaxies. However, the lower luminosity with respect to SSRQ may be due to the close proximity of the source. Thus, taking into account its low redshift, the -ray properties of PKS 052136 are compatible with those observed in SSRQ and BLRG. In this context the strong flaring activity detected from this source by Fermi-LAT starting from 2010 June, with daily peak flux of 1–210-6 ph cm-2 s-1, is very intriguing.
We discuss the -ray emission of this source in the framework of the ‘spine-layer’ scenario, with a fast spine surrounded by a slower layer, like in the case of the radio galaxy NGC 1275 (Tavecchio & Ghisellini, 2014). We compare the SED of the flaring state (2010 June) with that of a low activity state (2010 February-March). We present three alternative models, corresponding to three different choices of the viewing angles = 6∘, 15∘, and 20∘. For the case with = 6∘ and 15∘ we obtain a good fit. According to the unification scheme for radio galaxies and blazars, reporting the SED obtained with = 15∘ as recorded by an observer at = 4∘, this SED would correspond to that of the ‘aligned’ counterpart of the radio galaxy. On the contrary, the resulting SED is strongly unbalanced toward the synchrotron luminosity (by a factor of ), at odds with the typical blazar SED. This suggests that a viewing angle between 6∘ and 15∘ is preferred. In the spine-layer scenario proposed here the rapid variability observed during -ray flares favours a relatively small angle. However, we cannot rule out the possibility that PKS 052136 is an AGN seen at 15∘ and its ‘aligned’ counterpart is a blazar belonging to a population of synchrotron-dominated objects.
This intermediate viewing angle is in agreement with the core dominance and the other radio properties observed, and thus with the classification of PKS 052136 as an SSRQ at low redshift or a BLRG. The strong -ray flaring activity observed by Fermi-LAT from this source indicates that SSRQ and BLRG may have relativistic jets as powerful as blazars. We noted that an increase of the -ray activity was observed for the SSRQ 3C 380 (Torresi & Grandi, 2013), although at a flux level lower than that reached by PKS 052136.
The multifrequency observations and SED modeling presented here give important information about the characteristics of the AGN PKS 052136 and its classification. Further radio-to--ray observations will be fundamental to investigate in even more detail the nature and the physical processes occurring in this source.
Acknowledgments
The Fermi LAT Collaboration acknowledges generous ongoing support from a number of agencies and institutes that have supported both the development and the operation of the LAT as well as scientific data analysis. These include the National Aeronautics and Space Administration and the Department of Energy in the United States, the Commissariat à l’Energie Atomique and the Centre National de la Recherche Scientifique / Institut National de Physique Nucléaire et de Physique des Particules in France, the Agenzia Spaziale Italiana and the Istituto Nazionale di Fisica Nucleare in Italy, the Ministry of Education, Culture, Sports, Science and Technology (MEXT), High Energy Accelerator Research Organization (KEK) and Japan Aerospace Exploration Agency (JAXA) in Japan, and the K. A. Wallenberg Foundation, the Swedish Research Council and the Swedish National Space Board in Sweden. Additional support for science analysis during the operations phase is gratefully acknowledged from the Istituto Nazionale di Astrofisica in Italy and the Centre National d’Études Spatiales in France.
We thank the Swift team for making these observations possible, the duty scientists, and science planners. The Submillimeter Array is a joint project between the Smithsonian Astrophysical Observatory and the Academia Sinica Institute of Astronomy and Astrophysics and is funded by the Smithsonian Institution and the Academia Sinica. This research has made use of data from the University of Michigan Radio Astronomy Observatory which has been supported by the University of Michigan and by a series of grants from the Nation al Science Foundation, most recently AST-0607523. This research was supported in part by NASA Fermi Guest Investigator awards NNX09AU16G, NNX10AP16G, NNX11AO13G, and NNX13AP18G. Part of this work is based on archival data, software or online service provided by ASI Science Data Center (ASDC). The National Radio Astronomy Observatory is a facility of the National Science Foundation operated under cooperative agreement by Associated Universities, Inc. We thank S. Digel, D. J. Thompson, J. Perkins, D. Gasparrini, and the anonymous referee for useful comments and suggestions.
References
- Abdo et al. (2009) Abdo, A. A., et al. 2009a, ApJ, 707, 55
- Abdo et al. (2009) Abdo, A. A., et al. 2009b, ApJS, 183, 46
- Abdo et al. (2010) Abdo, A. A., et al. 2010, ApJ, 720, 912
- Abdo et al. (2010a) Abdo, A. A., et al. 2010a, ApJS, 188, 405
- Abdo et al. (2010b) Abdo, A. A., et al. 2010b, ApJ, 720, 912
- Abdo et al. (2010c) Abdo, A. A., et al. 2010c, ApJ, 714, L73
- Acero et al. (2015) Acero, F., et al. 2015, submitted to ApJS, arXiv:1501.02003
- Ackermann et al. (2011) Ackermann, M., et al. 2011, ApJ, 743, 171
- Ackermann et al. (2012) Ackermann, M., et al. 2012, ApJ, 747, 104
- Ackermann et al. (2012b) Ackermann, M., et al. 2012, ApJS, 203, 4
- Ackermann et al. (2014) Ackermann, M., et al. 2014, ApJ, 786, 157
- Ackermann et al. (2015) Ackermann, M., et al. 2015, submitted to ApJS, arXiv:1501.06054
- Aleksic et al. (2012) Aleksic, J., et al. 2012, A&A, 539, L2
- Aller et al. (2014) Aller, M. F., Hughes, P. A., Aller, H. D., Latimer, G. E., Hovatta, T. 2014, ApJ, 791, 53
- Atwood et al. (2009) Atwood, W. B., et al. 2009, ApJ, 697, 1071
- Barthelmy et al. (2005) Barthelmy, S. D., et al. 2005, SSRv, 120, 143
- Baumgartner et al. (2013) Baumgartner, W. H., et al. 2013, ApJS, 207, 19
- Birkinshaw et al. (2002) Birkinshaw, M., Worrall, D. M., Hardcastle, M. J., 2002, MNRAS, 335,142
- Blandford & Rees (1978) Blandford, R. D., & Rees, M. J. 1978, in BL Lac Objects ed A. M. Wolfe (Univ. Pittsburgh Press), 328
- Bolton et al. (1965) Bolton, J. G., Clarke, M. E., Ekers, R. D. 1965, AuJPh, 18, 627
- Bromberg & Levinson (2009) Bromberg, O., & Levinson, A. 2009, ApJ, 699, 1274
- Burbidge et al. (1987) Burbidge, G., Hewitt, A. 1987, AJ, 97, 1
- Burrows et al. (2005) Burrows, D. N., et al. 2005, SSRv, 120,165
- Cannon et al. (2010) Cannon, A. 2010, The Astronomer’s Telegram, 2591
- Cardelli et al. (1989) Cardelli J. A., Clayton G. C., Mathis J. S., ApJ 1989, 345, 245
- Casandjian & Grenier (2008) Casandjian, J.-M., Grenier, I. A. 2008, A&A, 489, 849
- Cash (1979) Cash, W. 1979, ApJ, 228, 939
- Cheung et al. (2007) Cheung, C. C., Harris, D. E., & Stawarz, Ł. 2007, ApJ, 663, L65
- Ciprini (2013) Ciprini, S. 2013, The Astronomer’s Telegram, 4753
- Condon et al. (1998) Condon, J. J., Cotton, W. D., Greisen, E. W., Yin, Q. F., Perley, R. A., Taylor, G. B., Broderick, J. J. 1998, AJ, 115, 1693
- Cusumano et al. (2010) Cusumano, G., et al. 2010, AA, 524, 64
- D’Ammando et al. (2010) D’Ammando, F., Sokolovsky, K. V, Iafrate, G., Stark, M. 2010, The Astronomer’s Telegram 2689
- D’Ammando et al. (2011) D’Ammando, F., et al. 2011, AA, 529, A145
- D’Ammando et al. (2012) D’Ammando, F., et al. 2012, MNRAS, 427, 893
- D’Ammando et al. (2015) D’Ammando, F., et al. 2014, MNRAS, 438, 3521
- Danziger et al. (1979) Danziger, I. J., Fosbury, R. A. E., Goss, W. M., Ekers, R. D. 1979, MNRAS, 188, 415
- Dermer et al. (2012) Dermer, C. D., Murase, K., & Takami, H. 2012, ApJ, 755, 147
- Ekers et al. (1989) Ekers, R. D., et al. 1989, MNRAS, 236, 737
- Falomo et al. (2009) Falomo, R., et al. 2009, A&A, 501, 907
- Fanaroff & Riley (1974) Fanaroff, B. L., & Riley, J. M. 1974, MNRAS, 167, 31P
- Foschini et al. (2006) Foschini, L., et al. 2006, A&A, 453, 829
- Fuhrmann et al. (2014) Fuhrmann, L., et al. 2014, MNRAS, 441, 1899
- Gehrels et al. (2004) Gehrels, N., et al. 2004, ApJ, 611, 1005
- Ghisellini et al. (2005) Ghisellini, G., Tavecchio F., Chiaberge M., 2005, A&A, 432, 401
- Ghisellini et al. (2008) Ghisellini, G., & Tavecchio, F. 2008, MNRAS, 386, L28
- Ghisellini et al. (2009) Ghisellini, G., & Tavecchio, F. 2009, MNRAS, 397, 985
- Ghisellini et al. (2011) Ghisellini, G., Tavecchio F., Foschini L., Ghirlanda G. 2011, MNRAS, 414, 2674
- Giannios et al. (2009) Giannios, D., Uzdensky, D. A., & Begelman, M. C. 2009, MNRAS, 395, L29
- Giroletti et al. (2004) Giroletti, M., Giovannini, G., Taylor, G. B., & Falomo, R. 2004, ApJ, 613, 752
- Giroletti et al. (2012) Giroletti, M., Hada, K., Giovannini, G., et al. 2012, A&A, 538, L10
- Gurwell et al. (2007) Gurwell, M. A., Peck, A. B., Hostler, S. R., Darrah, M. R., Katz, C. A. 2007, Astronomical Society of the Pacific Conference Series, 375, 234
- Hartman et al. (1999) Hartman, R. C., et al. 1999, ApJS, 123, 79
- Iafrate et al. (2010) Iafrate, G., Longo, F., D’Ammando, F. 2010, The Astronomer’s Telegram 2683
- Kalberla et al. (2005) Kalberla, P. M. W., Burton, W. B., Hartmann, D., Arnal, E. M., Bajaja, E., Morras, R.; Poppel, W. G. L. 2005, AA, 440, 775
- Kataoka et al. (2010) Kataoka, J., et al. 2010, ApJ, 715, 554
- Kataoka et al. (2011) Kataoka, J., Stawarz, Ł., Takahashi, Y., et al. 2011, ApJ, 740, 29
- Komatsu et al. (2009) Komatsu, E., Dunkley, J., Nolta, M. R., et al. 2009, ApJS, 180, 330
- Lin et al. (1995) Lin, Y. C., Bertsch, D. L., Dingus, B. L. 1995, ApJ, 442, 96
- Marscher (2014) Marscher, A. 2014, ApJ, 780, 87
- Mattox et al. (1996) Mattox, J. R., et al. 1996, ApJ, 461, 396
- Nolan et al. (2012) Nolan, P. L., et al. 2012, ApJS, 199, 31
- Orr & Browne (1982) Orr, M. J. L., Browne, I. W. A. 1982, MNRAS, 200, 1067
- Pian et al. (1996) Pian, E., Falomo, R., Ghisellini, G., Maraschi, L., Sambruna, R. M., Scarpa, R., Treves, A. 1996, ApJ, 459, 169
- Poole et al. (2008) Poole, T. S., et al. 2008, MNRAS, 383, 627
- Raiteri et al. (2011) Raiteri, C. M., et al. 2011, AA, 534, 87
- Raiteri et al. (2012) Raiteri, C. M., et al. 2012, AA, 545, A48
- Roca-Sogorb et al. (2010) Roca-Sogorb, M., Gómez, J. L., Agudo, I., Marscher, A. P., & Jorstad, S. G. 2010, ApJ, 712, L160
- Roming et al. (2005) Roming, P. W. A., et al. 2005, SSRv, 120, 95
- Saito et al. (2013) Saito, S., Stawarz, Ł., Tanaka, Y. T., Takahashi, T., Madejski, G., D’Ammando, F. 2013, ApJ, 766, L11
- Scarpa et al. (1995) Scarpa, R., Falomo, R., & Pian, E 1995, A&A, 303, 730
- Scarpa et al. (1999) Scarpa, R., Urry, C. M., Falomo, R., Treves, A. 1999, ApJ, 526, 643
- Schlafly et al. (2011) Schlafly, E. F., Finkbeiner, D. P. 2011, ApJ, 737, 103
- Slee (1977) Slee, O.B. 1977, AuJPA, 43, 1
- Sparks et al. (1994) Sparks, W. B., Biretta, J. A., Macchetto, F. 1994, ApJS, 90, 909
- Stickel et al. (1991) Stickel, M., Padovani, P., Urry, C. M., Fried, J. W., Kuehr, H. 1991, ApJ, 374, 431
- Stocke et al. (1991) Stocke, J. T., Morris, S. L., Gioia, I. M., Maccacaro, T., Schild, R., Wolter, A., Fleming, T. A., Henry, J. P. 1991, ApJS, 76, 813
- Tavecchio & Ghisellini (2008) Tavecchio F., Ghisellini G., 2008, MNRAS, 385, L98
- Tavecchio et al. (2010) Tavecchio, F., Ghisellini, G., Bonnoli, G., & Ghirlanda, G. 2010, MNRAS, 405, L94
- Tavecchio et al. (2011) Tavecchio, F., Becerra-Gonzalez, J., Ghisellini, G., Stamerra, A., Bonnoli, G., Foschini, L., Maraschi, L. 2011, A&A, 534, 86
- Tavecchio et al. (2012) Tavecchio, F., Roncadelli, M., Galanti, G., & Bonnoli, G. 2012, PhRvD, 86, 5036
- Tavecchio & Ghisellini (2014) Tavecchio F., Ghisellini G., 2014, MNRAS, 443, 1224
- Thompson et al. (1995) Thompson, D. J., et al. 1995, ApJS, 101, 259
- Tingay et al. (1996) Tingay, S. J., et al. 1996, ApJ, 464, 170
- Tingay & Edwards (2002) Tingay, S. J., & Edwards, P. G. 2002, AJ, 124, 652
- Torresi & Grandi (2013) Torresi, E., & Grandi, P. 2013, EPJWC, 6104006
- Ulrich et al. (1981) Ulrich, M. E. 1981, A&A, 103, L1
- Urry & Padovani (1995) Urry, C. M., & Padovani, P. 1995, PASP, 107, 803
- Wilms et al. (2000) Wilms, J., Allen, A., McCray, R. 2000, ApJ, 542, 914
- Wright et al. (1996) Wright, A. E., Griffith, M. R., Hunt, A. J., Troup, E., Burke, B. F., Ekers, R. D. 1996, ApJS, 103, 145