Turbulent breakage of ductile aggregates
Abstract
In this paper we study breakage rate statistics of small colloidal aggregates in non-homogeneous anisotropic turbulence. We use pseudo-spectral direct numerical simulation of turbulent channel flow and Lagrangian tracking to follow the motion of the aggregates, modelled as sub-Kolmogorov massless particles. We focus specifically on the effects produced by ductile rupture: This rupture is initially activated when fluctuating hydrodynamic stresses exceed a critical value, , and is brought to completion when the energy absorbed by the aggregate meets the critical breakage value. We show that ductile rupture breakage rates are significantly reduced with respect to the case of instantaneous brittle rupture (i.e. breakage occurs as soon as ). These discrepancies are due to the different energy values at play as well as to the statistical features of energy distribution in the anisotropic turbulence case examined.
I Introduction
Breakage rates of micro and nano aggregates in turbulent flow are of high relevance to a wide variety of applications. These range from industrial processes, such as operations involving colloids soos1 (Harshe, Lattuada & Soos, 2011), compounding of plastic and elastomeric materials yin07 (Yin et al., 2007), and dispersion of ceramics malghan (Malghan, 1992), to environmental processes, e.g. sedimentation of marine snow burd (Burd & Jackson, 2009) or formation of marine aggregates ruiz (Ruiz & Izquierdo, 1997). In almost all cases of practical interest, breakage is caused by two mechanisms. The first is usually referred to as impact breakage and is caused by energetic collisions of the aggregates with other aggregates or walls. This mechanism, however, is not relevant to the present study because it applies to aggregates that are large with respect to the characteristic length scale of the fluid shear (the Kolmogorov length scale if the flow is turbulent) and have a significant density difference compared to the fluid. The second mechanism is usually referred to as shear breakage and applies to small aggregates with density close to that of the fluid. In this case, breakage is caused by aggregate deformation induced by the hydrodynamic stresses. Such deformation generates internal stresses that can break the aggregate following two processes: If the response time of the aggregate to deformation is very small then breakage is instantaneous, and the aggregate can be referred to as brittle; if breakage depends on the stress history and a significant amount of energy is required to overcome deformation, then the aggregate can be referred to as ductile.
In either brittle or ductile rupture, the phenomenology of turbulent breakage is still not fully understood because the complexity of the flow field adds to the intricacy of the aggregate morphology in determining how the hydrodynamic forces redistribute over the structure of the aggregate and how stresses accumulate in critical locations where the cohesive force that keeps the primary particles of the aggregate together can be overcome. To provide a basic understanding of turbulent breakage, many investigations (see for instance the recent works by thesJFM (Babler et al., 2015, De Bona et al., 2014, Babler et al., 2012, Babler et al., 2008) and the references therein) have focused on the influence that the hydrodynamic stresses have on the rate at which breakage occurs, neglecting the details of the aggregate inner structure. This choice footnote1 was motivated by the observation that the occurrence, in the surroundings of a small aggregate, of instantaneous stresses capable of inducing breakage is controlled by the statistical (spatial and temporal) distribution of these stresses, which is in turn dictated by the turbulent flow field lanotte-vanni (De Bona et al., 2014). However, in the size range of interest for the present study (aggregates smaller than the Kolmogorov length), analyses were carried out considering brittle aggregates and instantaneous breakage thesJFM (Babler et al., 2015, Babler et al., 2012). This assumption would be fully justified in highly viscous flows, such as dispersions in liquid polymers, where the stresses required to break the aggregate are very low vanni (Sanchez Fellay & Vanni, 2012). But in low-viscosity systems the effective hydrodynamic stress required for breakage changes significantly depending on the nature of the flow and rupture can frequently be determined by the stress history blaser (Blaser, 2000), namely by what we refer to as ductile rupture effects in this paper. As a result, current knowledge of the breakage process for the case of sub-Kolmogorov ductile aggregates has remained hitherto elusive in spite of its practical importance in areas such as industrial materials processing bumm (Bumm et al., 2013) and rheology of dense colloids zaccone (Zaccone et al., 2009). Design of such processes usually relies on semi-empirical correlations based on idealized flow configurations gv2011 (Gastaldi & Vanni, 2011, Vanni & Gastaldi, 2011, Soos et al., 2010, Soos et al., 2008, Kusters et al., 1996). When turbulence is present, it is generally modelled with a single value of the kinetic energy dissipation, a rather crude assumption already for homogeneous and isotropic flows. However, real facilities involve mixing in containers, agitators, flows in pipes and channels where turbulence is strongly anisotropic and geometry-dependent soos2010 (Soos et al., 2010, Soos et al., 2008, Kusters et al., 1996, Kusters, 1991). Compared to the few studies of the influence of turbulence in homogeneous and isotropic flow conditions (see lanotte-vanni (De Bona et al., 2014) and lanotte (Babler et al., 2012) among others), the first attempt to assess the effects of flow inhomogeneity and anisotropy was recently put forward in the collaborative study of thesJFM (Babler et al., 2015). In this study, direct numerical simulations were performed to study the breakage of small inertialess aggregates in different archetypal bounded flows as turbulent channel flow (data and analysis provided by this group) and developing boundary layer, comparing results with those of homogeneous isotropic turbulence. To emphasize the dependence of breakage on the specific properties of the flow, only brittle instantaneous rupture was considered in the simulations. The main findings, relevant to the present discussion, can be summarized as follows: (I) Regardless of the flow configuration, the breakage rate decreases when the critical stress required to break the aggregate increases; (II) for small values of the critical stress (“weak” aggregates) the breakage rate develops a universal power-law scaling that appears to be independent of the flow configuration; (III) for high values of the critical stress (“strong” aggregates) large differences in the breakage rate arise among the different flows and no clear scaling is observed anymore, highlighting the importance of instantaneous and local flow properties.
Different from thesJFM (Babler et al., 2015), in the present paper we examine a more realistic breakage process that results from ductile (non-instantaneous) rupture, focusing on the case of turbulent channel flow. We are interested in assessing the influence of ductile rupture on the breakage rate, with specific reference to the scaling behavior previously observed for weak aggregates thesJFM (Babler et al., 2015, Babler et al., 2012). The statistical characterization proposed in this work also provides useful indications about the importance of ductile rupture in the context of Large-Eddy Simulations (LES) of industrial particulate systems. More specifically, the results discussed here suggest that the specific breakage mechanism has a crucial impact on the modelling framework within which LES can be used. As mentioned, shear breakage in anisotropic turbulence is controlled by the fluid stresses around the aggregate but these stresses are inevitably filtered out by LES, thus causing under-prediction of the breakage rates. This under-prediction is expected to be more evident in the case of ductile rupture because the contribution of subgrid fluctuations to the stress history is missing.
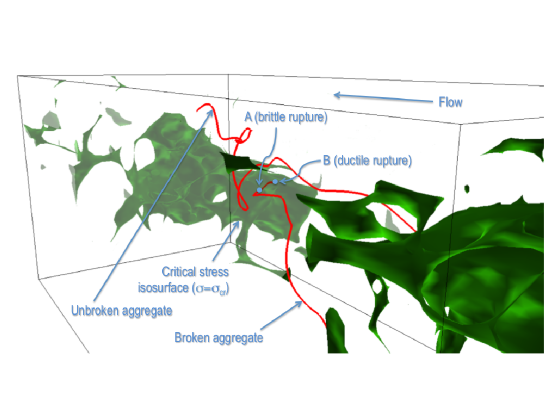
For these purposes, we assume that the breakage process is first activated when the hydrodynamic stress acting on the aggregate, referred to as hereinafter, exceeds a critical value that is characteristic of a given type of aggregate: (activation condition, sufficient to produce brittle rupture). In figure 1, which provides a visual rendering of the rupture events examined in this study, this condition occurs as soon as the aggregate trespasses the isosurface (point A along the trajectory of the broken aggregate). As long as the condition is met the process continues, mimicking the situation in which the aggregate is storing energy from the surrounding fluid. The process comes to an end when the energy transferred from the fluid to the aggregate, referred to as deformation energy hereinafter and defined as:
| (1) |
with being the time spent by the aggregate in regions of the flow where and being the dissipation rate of fluid kinetic energy, exceeds the critical breakage value, which is also characteristic of the type of aggregate under investigation: (breakage condition). In figure 1, this condition occurs at point B inside the isosurface. In this figure, we also show the trajectory of an aggregate that avoids all regions where and does not break within the time window considered. Note that the isosurface is taken at the time of ductile rupture, while aggregate trajectories are tracked several time steps backward from this time. To single out the effect of ductile rupture, we follow thesJFM (Babler et al., 2015) and assume that the stress is , where () is the dynamic (kinematic) viscosity and , with the strain rate tensor. Based on these definitions, strong fluctuations of control the fluctuations of the stress and therefore the occurrence of breakage events. In the limit of instantaneous breakage this translates into a picture where an aggregate, once released into the flow, moves through it until the local dissipation exceeds a threshold value that causes its rupture. In this case, the main variable to monitor is the time spent by the aggregate in regions of the flow where (the so-called exit-time, which will be defined formally in the next section).
We remark here that the proportionality between and is strictly valid only for a normal distribution for the local shear rate deli76 (Delichatsios & Probstein, 1976, Pope, 2000), a condition that may be violated in the near-wall region of the channel. In addition, our approach still separates the role of turbulence from that of internal stresses, which are neglected. The direct coupling between hydrodynamic and internal stresses has been investigated for the first time by lanotte-vanni (De Bona et al., 2014) for the case of homogeneous and isotropic turbulence. Extension of the analysis to anisotropic turbulence is currently under way and will be addressed in a subsequent paper.
II Physical Problem and Numerical Methodology
The physical problem considered in this study is the dispersion of tracer aggregates in turbulent channel flow, which is the archetypal flow previously analyzed by this group within the benchmark study of thesJFM (Babler et al., 2015). The flow is non-reactive, isothermal and incompressible, and the numerical methodology is based on an Eulerian-Lagrangian approach that has been used successfully in past investigations of turbulent dispersed flows ms02 (Marchioli & Soldati, 2002, Marchioli et al., 2008). The reference geometry consists of two infinite flat parallel plates separated by a distance . The origin of the coordinate system is located at the center of the channel with the , and axes pointing in the streamwise, spanwise, and wall-normal directions, respectively. Periodic boundary conditions are imposed on the fluid velocity field in the homogeneous directions ( and ), no-slip boundary conditions are imposed at the walls. The size of the computational domain is . The shear Reynolds number is (Marchioli et al., 2008), where is the shear velocity based on the mean wall shear stress. This value of was chosen to match that used by thesJFM (Babler et al., 2015). We remark that, based on the findings of sf13 (Schultz & Flack, 2013) and those of ham (Hamlington et al., 2012) regarding the statistical distribution of the energy dissipation rate in turbulent channel flow up to , present results are expected to scale up to Reynolds numbers significantly higher than . All variables discussed in this paper are expressed in wall units, obtained using and .
The flow solver is based on a Fourier-Galerkin pseudo-spectral method that solves for the full Navier-Stokes equations and thus yields the spatial derivatives required to calculate along the aggregate trajectory with spectral accuracy. Lagrangian tracking is used to calculate the trajectory of each aggregate based on the following equation of motion: , with the aggregate position and the fluid velocity at . This equation is solved in time using a fourth-order Runge-Kutta scheme, whereas sixth-order Lagrangian polynomials are used to obtain the fluid velocity and the fluid velocity derivatives at the instantaneous aggregate position. Further details on the numerical methodology can be found in test-case (Marchioli et al., 2008, Soldati & Marchioli, 2009). Breakage measurements are performed by releasing aggregates in two distinct regions of the channel: the wall region, which comprises a fluid slab 10 wall unit thick where the viscous stress (representing the mean fluid shear) is maximum while the turbulent stress is close to zero; and the center-plane of the bulk region, where all wall stress contributions drop to zero and turbulence is closer to homogeneous and isotropic. In the following, the two release regions are labeled and , respectively. Within each of these regions, aggregates were released, their trajectories tracked and breakage events detected.
We remark here that the dissipation of kinetic energy by viscosity in fully-developed turbulence occurs primarily at the smallest scales of the flow, namely at scales close of the order of the Kolmogorov scale, . In wall-bounded turbulence, the mean value of these local dissipation scales can be estimated from the relation , allowing fluctuations in the scale to be directly connected to variations in ham (Hamlington et al., 2012). Due to the non-homogeneity and anisotropy of the turbulence jot2006 (Marchioli et al., 2006), dissipation results in local values of that can be orders of magnitude larger than the mean, even for turbulent flows at moderate Reynolds numbers like the one considered in the present study thesJFM (Babler et al., 2015). Such high amplitudes are the result of very large velocity gradients that act on the aggregates and ultimately determine their breakage. Variations in the smallest scales at which dissipation occurs are reflected in the statistical moments of the energy dissipation rate, defined as , and shown in figure 2 as a function of the distance from the wall, . In this paper, angle brackets denote quantities averaged in time and in the homogeneous directions. Note that, because we track many tracer aggregates, the average dissipation seen by aggregates along their Lagrangian trajectory is in practice equal to the Eulerian one, which was investigated also by ham (Hamlington et al., 2012) at varying footnote2 . Figure 2 shows that aggregates are subject to high fluctuations of the kinetic energy dissipation even when they sample the bulk flow region. Close to the walls, dissipation attains high mean values while fluctuations, proportional to the Root Mean Square (RMS), are intense throughout the channel and correspond to a highly intermittent distribution of . Figure 2 also shows that the skewness () and flatness () factors, and respectively, are significantly higher than both the mean and the RMS, especially in the center of the channel where values differ by roughly three to four orders of magnitude. This suggests that breakage events in the bulk of the flow may be caused by (rare) extreme energy dissipation events. However, these events are expected to have an effect on instantaneous brittle ruptures more than on ductile ruptures, which require the occurrence of events with a certain time persistence. As already observed by ham (Hamlington et al., 2012), the higher order moments agree closely with the results in homogeneous isotropic turbulence for much of the channel, exhibiting a universal flow-independent behavior that scales with and is lost only in the near-wall region. This observation can be put in connection with the existence of scaling laws for the breakage rate, observed for instance by thesJFM (Babler et al., 2015, Babler et al., 2012). Already in the limit of brittle rupture, specific flow properties such as anisotropy and non-homogeneity have a crucial impact on breakage dynamics since they determine the spatial and temporal distribution of fluid stresses (and, therefore, of energy dissipation). In wall-bounded flows such distribution exhibits features similar to homogeneous isotropic turbulence in the bulk of the channel, where anisotropy and non-homogeneity are not dominant: The behavior of the higher order moments of the energy dissipation shown in figure 1 suggests that the breakage process may exhibit universal (or nearly universal) features only in this region. Universality is inevitably lost near the wall with important implications for strong aggregates, which can only be broken by extreme dissipation events.
III Results and Discussion
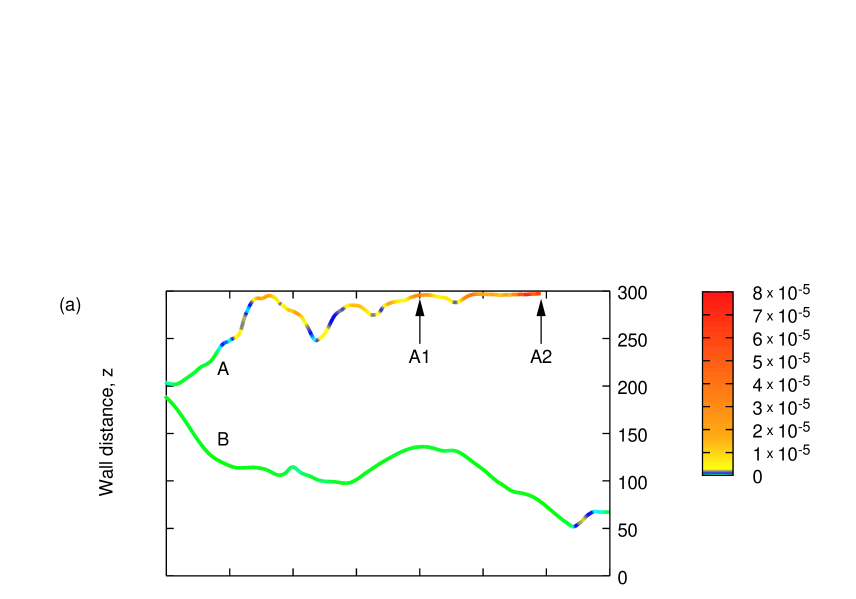
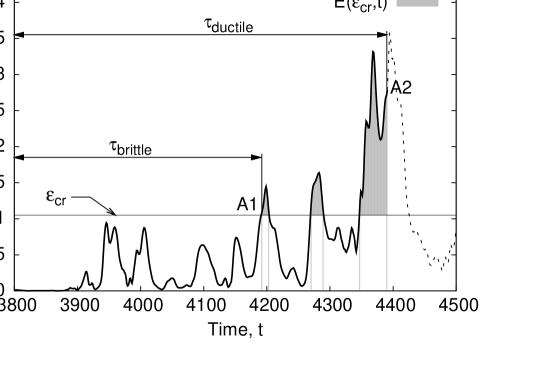
The statistics of the rupture of ductile aggregates are examined by focusing mainly on one observable: the breakage rate. Figure 3 shows schematically the procedure we followed to estimate the breakage rate, using the trajectory of two sample aggregates labeled as A and B. In figure 3(a), we show the time evolution of the aggregate-to-wall distance for A and B, colored using the value (expressed in wall units) of the kinetic energy dissipation along the aggregate trajectory: high dissipation is in dark gray (red online), low dissipation is in light gray (blue online). Note that represents the dimensionless time (in wall units) spent by the aggregates within the flow after injection at time . Since we are interested in the effect of flow anisotropy on breakage, the fluid characteristic scale adopted in this study is . Aggregate A is trapped at the wall and eventually breaks, aggregate B is able to stay in the bulk of the flow during the time window of the simulation and escapes breakage. The procedure employed to define the breakage rate follows thesJFM (Babler et al., 2015, De Bona et al., 2014) and can be explained with reference to the time history of the dissipation along the trajectory of aggregate A, shown in figure 3(b). The aggregate is released at a time and moves within the flow for a time (referred to as exit time hereinafter) after which the local dissipation exceeds for the first time the critical threshold , indicated by point in figure 3(b).
If the aggregate is brittle, then it breaks at point : The first crossing of thus defines the exit time used to compute the breakage rate: in figure 3(b). The breakage rate for the given threshold is then computed as the inverse of the mean exit time, obtained upon ensemble-averaging over many time histories (this averaging being represented by the overbar):
| (2) |
Note that, following thesJFM (Babler et al., 2015, De Bona et al., 2014), aggregates are released only at points where the local dissipation is below to avoid the occurrence of exit times equal to zero.
If the aggregate is ductile then it does not break at , since is just the activation condition. The exit time is now computed as the time required to satisfy both the activation condition and the breakage condition, : in figure 3(b), the time windows during which both conditions are met encloses all the gray areas, and breakage occurs at point yielding an exit time . The breakage rate for the given thresholds of and is then computed as:
| (3) |
Note that, by definition, depends on . This implies that the statistical distribution of the deformation energy made available by the fluid for breakage depends on the specific value of that characterizes the aggregate. Such distribution is shown in figure 4, where we plot the Probability Density Function (PDF) of for aggregates released in the channel center, computed according to eq. (1) and considering only aggregates that eventually break. This implies that these PDFs provide also evidence of the statistical distribution of breakage events. The curves refer to three different values of : , corresponding to the case of a weak aggregate for the present flow configuration; , corresponding to the case of a strong aggregate; and an intermediate case with , which can be referred to as mild aggregate. As the strength of the aggregate, namely its resistance to breakage, increases, the PDF shifts toward higher values of but exhibits lower peak values (note that PDFs are normalized such that the area below each curve is equal to unity). This trend provides a first characterization of the breakage events that are typically experienced by the aggregates: very intense but relatively short in time for strong aggregates, less intense but more persistent in time for weak aggregates. Note that, since the horizontal axis is plotted in logarithmic scale, the PDFs deviate from a Gaussian distribution (as shown clearly in the inset of figure 4, where axes are in linear scale): This distribution would be obtained if breakage events were controlled mainly by the early rupture events that occur in the vicinity of the aggregate release location (the channel centerline) thesJFM (Babler et al., 2015). Apparently, this is not the case for ductile rupture in anisotropic turbulence.
III.1 Breakage rates
To examine further the breakage process, in figures 5 and 6 we show the rates of ductile breakage, obtained according to eq. (3) for the two release locations considered in this study: and respectively. These two figures show the effect of increasing the critical deformation energy for different threshold values of the critical energy dissipation and thus extend the findings of thesJFM (Babler et al., 2015), which focus on the effect of increasing (namely the strength of a brittle aggregate) in different flow configurations. Results are shown for three different values of the threshold , sampled from the distributions of figure 4 and chosen to span two orders of magnitude: , representing a case of low ductility for the present flow configuration; , representing a case of intermediate ductility; , representing a case of high ductility. In both figures, breakage rates for brittle aggregates, computed according to eq. (2), are also shown for comparison purposes. To ensure convergence of the statistics, the breakage rates reported in figures 5 and 6 correspond to a percentage of broken aggregates equal to at least (in the worst case scenario of highly ductile rupture, the percentage being above in all other cases). Error bars attached to each profile represent the standard deviation from the mean value of the breakage rate, computed using the variance of the exit time, . Error bars are shown to provide an indication of the dispersion of breakage rates around the mean value: The higher the dispersion, the lesser the accuracy and predictive capability of correlations based solely on .
Let us focus first on the results for aggregates released in the center of the channel (figure 5). The breakage rate of brittle aggregates (solid curve, taken from thesJFM (Babler et al., 2015)) generally decreases with increasing aggregate strength, in agreement with the intuitive idea that weak aggregates in wall-bounded flows are broken by turbulent fluctuations faster than strong aggregates. For small the breakage rate is known to exhibit a power-law behavior of the type , where is a flow-dependent scaling exponent: thesJFM (Babler et al., 2015) have demonstrated that the value of for aggregates released in the central region of a channel is very similar to that of aggregates released outside a developing boundary layer but slightly larger than that of aggregates released near the channel walls or in homogeneous flows. In the case of figure 5, the power-law scaling of for brittle aggregates is observed when and the best fit is obtained for . When ductile aggregates are taken into account (dashed curves), breakage rates change dramatically, especially for weak aggregates with low threshold. The values of decrease significantly with respect to the case of instantaneous breakage, already at low thresholds for the critical deformation energy, (e.g. ). In addition, no clear power-law scaling is observed anymore and the breakage rate profiles tend to flatten as the aggregate “ductility” increases. As could be expected, the effect of ductile rupture on becomes less important for strong aggregates: These must be subject to extremely violent fluid stresses, typical of the intermittent nature of small-scale turbulence, to activate the breakage process and thus can store the level of energy required to break almost impulsively. As a result, there is just a little increase of the exit time with respect to strong brittle aggregates.
It is clear from the results of figure 5 that ductile rupture (a process that is of course linked to restructuring phenomena within the aggregate) has a dramatic effect on the frequency with which small aggregates break in wall-bounded turbulence. Any predictive model failing to reproduce this feature would inevitably yield strong over-prediction of the breakage rates. One example is the exponential model of Kusters kust (Kusters, 1991), which is valid for instantaneous breakage only and is based on the dimensional assumption that breakage is ruled by Gaussian kinetic energy dissipation:
| (4) |
This classical model predicts a very sharp drop-off at intermediate threshold values of and a constant breakage rate for small threshold values, in strong disagreement to the breakage rate found in our simulations. The discrepancy originates both from the simplified assumption of a Gaussian dissipation and from the neglect of ductile rupture.
The results of figure 5 depend quantitatively on the specific location chosen to release the aggregates at time . In the center of the channel (release region ) strong aggregates, no matter if subject to brittle or ductile rupture, are mainly broken by the rare extreme excursions of dissipation from the mean, which are caused by intermittency. Most of such aggregates must therefore reach the high-dissipation, high-shear regions of the flow near the channel walls to undergo breakage. To examine the influence of the release location on breakage rates, in figure 6 we show the behavior of for aggregates released in the near-wall region . Focusing first on the brittle aggregates (solid curve, taken from thesJFM (Babler et al., 2015)), we observe that the power-law scaling at small values of is followed by a flattening for intermediate values of the threshold, which was not observed in figure 5. For the very large threshold values associated to the right end of the profile, a drop-off in the breakage rate is observed, representing the case of aggregates that are too strong to be broken by the mean shear alone: intense but rare turbulent fluctuations within the near wall region are required to overcome the cohesive force of these aggregates thesJFM (Babler et al., 2015). The inclusion of ductile rupture effects (dashed curves) produces again a clear decrease of the breakage rates, which vanishes for large values of . Compared to the results of figure 5, we observe that the decrease is now almost negligible for aggregates with low ductility (corresponding to the curve in figure 6) and flattening of the profiles is only attained for very high threshold values of the deformation energy. We also note that error bars are generally smaller, indicating a lower variability of the statistics: this is due to the fact that aggregates are already placed in the high-shear regions of the flow where they preferentially break and hence sample a reduced portion of the domain compared to aggregates released in the bulk of the flow. In spite of these quantitative differences, however, the reduction of associated with ductile rupture is evident independently of the initial position chosen to inject the aggregates into the flow.
III.2 Evolution of the number of aggregates
In the previous section, we pointed out that strong aggregates can move away from the location of release and travel towards the high shear regions close to the walls. Obviously, this dynamics has an influence on the breakage process, which is also reflected in the time evolution of the number of unbroken aggregates, . This quantity can be used to derive the following approximation for the breakage rate of brittle aggregates that is valid when breakage is driven by homogeneous and temporally uncorrelated stresses lanotte-vanni (De Bona et al., 2014):
| (5) |
where can be simply linked to the exit time by the relation:
| (6) |
with the number of aggregates initially released into the flow and the PDF of the exit time for a given threshold . Based on eq. (6), is proportional to the cumulative exit time distribution lanotte-vanni (De Bona et al., 2014).
In figure 7, the evolution of the number of aggregates released in the centerline of the channel is reported. In particular the figure shows the behavior of , considered here because the corresponding slope provides a direct estimate of the aggregate breakage rate, as suggested by eq. (5). The different curves refer to a reference threshold and to different types of aggregate rupture: brittle (solid line taken from thesJFM (Babler et al., 2015)), weakly ductile (dashed line), mildly ductile (dotted line) and highly ductile (dash-dotted line). The lowest threshold value for was chosen because we know from thesJFM (Babler et al., 2015) that in this limit the number of unbroken aggregates decays exponentially as , yielding with deviations due only to statistical noise (e.g. at late times when the number of aggregates has become very small). The behavior of for the three types of ductile rupture examined in figure 7 is represented by the thin solid lines.
The results of figure 7 show that, in general, the evolution of the number of aggregates follows an exponential decay only at short and intermediate times, in good agreement with the linear segments of . Then the decay turns into a faster decrease at later times, associated to clear deviations from . These deviations are particularly evident for ductile rupture, indicating that simple estimates like the one given in eq. (5) do not provide a reasonable approximation of the breakage rate anymore, in agreement with the findings of figure 3.
IV Conclusions
In this work, we examine the breakage of small colloidal aggregates in non-homogeneous anisotropic turbulence. In particular we focus on the breakage rate of massless aggregates that are subject to ductile rupture caused by the hydrodynamic fluid stresses acting on the aggregate. This process is activated when the fluctuating hydrodynamic stress generated by the surrounding fluid exceeds a critical value characteristic of a given type of aggregate, , and ends when the energy given up to the aggregate by the surrounding fluid exceeds the critical breakage value. From a physical point of view, the process of ductile breakage comes closer to real applications compared to the case of instantaneous rupture considered in previous works thesJFM (Babler et al., 2015). To compute the breakage rate statistics, breakage kinetics under a realistic set of assumptions are explored by means of direct numerical simulation of turbulent channel flow seeded with a large number of aggregates, modelled as sub-Kolmogorov massless point-particles. Results show that the effects associated to ductile rupture are important and lead to strong reductions of the breakage rate with respect to instantaneous rupture. The mechanism of ductile breakage thus acts as a low-pass filter for stress-induced events that occur at time scales shorter than the characteristic time with which the aggregate responds to deformation. The reduction in the breakage rates is evident especially for weak aggregates characterized by small critical stress value and no universal scaling can be observed. For strong aggregates characterized by large critical stress value the breakage rate is less affected by the specific mechanism leading to rupture because such aggregates can only be disrupted by extremely intense stresses and thus store the amount of deformation energy required to break almost impulsively.
Future investigations will try to evaluate if there is a preferred direction along which breakage takes place. In the recent experimental measurements of aggregate breakage in laminar and turbulent shear flows, performed by saha (Saha et al., 2014), it was found that aggregates tend to break in the direction along which they experience the maximum stretching. Our aim is to verify the persistence of this behavior in presence of anisotropic turbulence.
Acknowledgments
COST Action FP1005 “Fiber suspension flow modelling: a key for innovation and competitiveness in the pulp and paper industry” is gratefully acknowledged. Financial support from Regione Friuli Venezia Giulia under the research project “Sviluppo di filtri catalitici e antiparticolato ad alta efficienza per una sostenibile mobilitàcompatibile con Euro 6” is also highly appreciated. A.S. is thankful to Prof. H. Pitsch for his insightful suggestions. The authors thank Dr. Marco Svettini for running some of the simulations.
References
- (1) Harshe, A.B., , Lattuada, M., Soos, M. 2011 Experimental and modeling study of breakage and restructuring of open and dense colloidal aggregates. Langmuir 27, 5739-5752.
- (2) Yin, B., Zhao, Y., Yu, R.Z., An, H.N., Yang, M.B. 2007 Morphology development of PC/PE blends during compounding in a twin-screw extruder. Polymer Eng. Sci. 47, 14-25.
- (3) Malghan, S.G. 1992 Dispersion of powders: Surface chemical interactions in aqueous media. Colloids Surf. 62, 87-99.
- (4) Burd, A.B., Jackson G.A. 2009 Particle Aggregation. Annu. Rev. Mar. Sci. 1, 65-90.
- (5) Ruiz, J., Izquierdo A. 1997 A simple model for the break-up of marine aggregates by turbulent shear. Oceanologica Acta 20, 597-605.
- (6) Babler, M.U., Biferale, L., Brandt, L., Feudel, U., Guseva, K., Lanotte, A.S., Marchioli C., Picano F., Sardina G., Soldati A. and Toschi, F. 2015 Numerical simulations of aggregate breakup in bounded and unbounded turbulent flows. J. Fluid Mech. 766, 104-128.
- (7) De Bona, J., Lanotte, A.S., Vanni, M. 2014 Internal stresses and breakup of rigid isostatic aggregates in homogeneous and isotropic turbulence. J. Fluid Mech. 755, 365-396.
- (8) Babler, M.U., Biferale, L., Lanotte, A.S. 2012 Breakup of small aggregates driven by turbulent hydrodynamic stress. Phys. Rev. E 85, 025301.
- (9) Babler, M.U., Morbidelli, M., Baldyga, J. 2008 Modelling the breakup of solid aggregates in turbulent flows. J. Fluid Mech. 612, 261-289.
-
(10)
An alternative strategy (the examination of which is beyond the scope
of this paper) that has been followed predicts breakage in simple flows,
e.g. sheared or elongational flows gv2011 (Gastaldi & Vanni, 2011, Vanni & Gastaldi, 2011),
characterized by a single value of the shear rate, while modelling
explicitly the aggregate morphology (see vanni (Sanchez Fellay & Vanni, 2012, Vanni & Gastaldi, 2011, Zaccone et al., 2009, Soos et al., 2008)
among others): This strategy emphasizes the role
played by each primary particle in generating and transmitting the stress
within the aggregate. Usually results yield from studies that account for such morphology-related effects
are summarised by a relation of the type:
where is a breakage exponent that relates the size of the aggregate, , with the critical shear rate needed to break it, , which depends on the aggregate structure vanni (Sanchez Fellay & Vanni, 2012, Zaccone et al., 2009, Soos et al., 2008).(7) - (11) Sanchez Fellay L., Vanni M. 2012 The effect of flow configuration on hydrodynamics stresses and dispersion of low density rigid aggregates. J. Colloid Interface Sci. 388, 47-55.
- (12) Blaser S. 2000 Flocs in shear and strain flows. J. Colloid Interface Sci. 225, 273-284.
- (13) Bumm, S.H., White, J.L., Isayev, A.I. 2013 Breakup of silica agglomerates in corotating twin-screw extruder: Modeling and experiment. J. Elast. Plast. 46, 527-552.
- (14) Zaccone, A., Soos, M., Lattuada, M., Wu, H., Babler, M.U., Morbidelli, M. 2009 Breakup of dense colloidal aggregates under hydrodynamic stresses. Phys. Rev. E 47, 14-25.
- (15) Gastaldi A., Vanni M. 2011 The distribution of stresses in rigid fractal-like aggregates in a uniform flow field. J. Colloid Interface Sci. 357, 18-30.
- (16) Vanni, M., Gastaldi, A. 2011 Hydrodynamic forces and critical stresses in low-density aggregates under shear flow. Langmuir 27, 12822-12833.
- (17) Soos, M., Ehrl, L., Babler, M.U., Morbidelli, M. 2010 Aggregate breakup in a contracting nozzle. Langmuir 26, 10-18.
- (18) Soos, M., Moussa, A. S., Ehrl, L., Sefcik, J., Wu, H., Morbidelli, M. 2008 Effect of shear rate on aggregate size and morphology investigated under turbulent conditions in stirred tank. J. Colloid Interface Sci. 319, 577-589.
- (19) Kusters, K.A. 1996 Aggregation kinetics of small particles in agitated vessels. Chem. Eng. Sci., 52, 107-121.
- (20) Kusters, K.A. 1991 The influence of turbulence on aggregation of small particles in agitated vessels. PhD Thesis, Technische Universiteit Eindhoven.
- (21) Delichatsios, M.A., Probstein, R.F. 1976 The effect of coalescence on the average drop size in liquid-liquid dispersions. Ind. Engng. Chem. Fundam. 15, 134-138.
- (22) Pope, S.B. 2000 Turbulent flows, Cambridge Univ. Press.
- (23) Marchioli, C., Soldati, A. 2002 Mechanisms for particle transfer and segregation in turbulent boundary layer. J. Fluid Mech. 468, 283-315.
- (24) Marchioli, C., Soldati, A., Kuerten, J.G.M., Arcen, B., Taniere, A., Goldensoph, G., Squires, K.D., Cargnelutti, M.F., Portela, L.M. 2008 Statistics of particle dispersion in direct numerical simulations of wall-bounded turbulence: results of an international collaborative benchmark test. Int J. Multiphase Flow 34, 879-893.
- (25) Schultz, M.P., Flack, K.A. 2013 Reynolds-number scaling of turbulent channel flow. Phys. Fluids 25, 025104.
- (26) Hamlington, P.E., Krasnov, D., Boeck, T., Schumacher, J. 2012 Local dissipation scales and energy dissipation-rate moments in channel flow. J. Fluid Mech. 701, 419-429.
- (27) Soldati A., Marchioli C. 2009 Physics and modelling of turbulent particle deposition and entrainment: Review of a systematic study. Int J. Multiphase Flow 35, 827-839.
- (28) Marchioli C., Picciotto, M., Soldati A. 2006 Particle dispersion and wall-dependent fluid scales in turbulent bounded flow: Implications for local equilibrium models. J. Turbul. 60, 1-12.
- (29) The study of Hamlington et al. ham (Hamlington et al., 2012) focuses on the statistical characterisation of in channel flow based on an Eulerian approach. In our paper, we compute the same statistics using a Lagrangian approach: The dissipation moments are computed from the turbulent kinetic energy dissipation seen by the aggregate along its trajectory, , until breakup. Because of the specific initial condition chosen for releasing the aggregates in the flow, which yields a non-uniform spatial distribution, may differ from the Eulerian dissipation, especially when breakage occurs at short times after release (as in the case of weak aggregates). Clearly, averaged Eulerian and Lagrangian statistics match if evaluated at long times after injection (as in the case of strong aggregates). In this limit, the results shown in figure 1 of this paper are exactly the same as those shown by ham (Hamlington et al., 2012).
- (30) Saha, S., Soos, M., Luthi, B., Holzner, M., Liberzon, A., Babler, M.U., Kinzelbach, W. 2014 Experimental characterization of breakage rate of colloidal aggregates in axisymmetric extensional flow. Langmuir 30, 14385-14395.