A first-principles study of co-doping in lanthanum bromide
Abstract
Co-doping of Ce-doped LaBr3 with Ba, Ca, or Sr improves the energy resolution that can be achieved by radiation detectors based on these materials. Here, we present a mechanism that rationalizes of this enhancement that on the basis of first principles electronic structure calculations and point defect thermodynamics. It is shown that incorporation of Sr creates neutral complexes that can temporarily trap electrons. As a result, Auger quenching of free carriers is reduced, allowing for a more linear, albeit slower, scintillation light yield response. Experimental Stokes shifts can be related to different triple complex configurations. Co-doping with other alkaline as well as alkaline earth metals is considered as well. Alkaline elements are found to have extremely small solubilities on the order of 0.1 ppm and below at 1000 K. Among the alkaline earth metals the lighter dopant atoms prefer interstitial-like positions and create strong scattering centers, which has a detrimental impact on carrier mobilities. Only the heavier alkaline earth elements (Ca, Sr, Ba) combine matching ionic radii with sufficiently high solubilities. This provides a rationale for the experimental finding that improved scintillator performance is exclusively achieved using Sr, Ca, or Ba. The present mechanism demonstrates that co-doping of wide gap materials can provide an efficient means for managing charge carrier populations under out-of-equilibrium conditions. In the present case dopants are introduced that manipulate not only the concentrations but the electronic properties of intrinsic defects without introducing additional gap levels. This leads to the availability of shallow electron traps that can temporarily localize charge carriers, effectively deactivating carrier-carrier recombination channels. The principles of this mechanism are therefore not specific to the material considered here but can be adapted for controlling charge carrier populations and recombination in other wide gap materials.
pacs:
61.72.-y 61.72.Bb 72.20.Jv 78.70.PsI Introduction
Many applications in nuclear and radiological surveillance, high-energy physics, and medical imaging rely on scintillator materials Rodnyi (1997); Knoll (2010), which enable the energy resolved detection of high energy radiation Nelson et al. (2011). The energy resolution that can be accomplished increases with luminosity, which is usually related to the efficiency of the process by which the energy of incoming radiation quanta (typically in the keV to MeV range) is converted to lower energy photons (on the order of a few eV). The achievable resolution is, however, further limited by the non-linearity of the scintillation response to the energy of the incident radiation Dorenbos (2010), which arises from the competition between non-radiative quenching, defect carrier trapping, as well as activator capture and subsequent emission Dorenbos (2005); Vasil’ev (2008); Kerisit et al. (2009); Bizarri et al. (2009); Payne et al. (2011).
Recent work showed that the energy resolution of Ce-doped LaBr3 can be significantly improved by co-doping. The concept was first realized experimentally by Yang et al. for samples co-doped with Sr Yang et al. (2012). Later Alekhin et al. achieved an improvement of energy resolution from 2.7 to 2.0% at 662 keV using Sr and Ca Alekhin et al. (2013a). A more comprehensive investigation including both the alkaline as well as alkaline earth series revealed that better performance is only achieved when using the heavier elements of the latter series (Sr, Ca, Ba) Dorenbos et al. (2013). To explain these observations it has been suggested that doping with Sr, Ca, or Ba causes Alekhin et al. (2014) (i) a reduction of the non-radiative recombination rate, (ii) an increase of the so-called escape rate of the carriers from the quenching region, or (iii) an increase in the trapping rate of . The experimental investigations also revealed three distinct optical signatures associated with Ce, which have been interpreted as evidence for the presence of three different Ce environments in the co-doped material. In contrast, only one such feature can be identified in LaBr3:Ce. Later, it was argued by the present authors that Sr-doping causes the creation of shallow electron trap complexes, which leads to reduced Auger quenching Åberg et al. (2014).
The present paper describes the argumentation in detail and presents a careful analysis of the thermodynamic properties and electronic structures of the most important intrinsic and extrinsic defects – including their complexes – in Ce and Sr-doped LaBr3 including self-trapped polaronic configurations. To demonstrate that the present model is consistent with experimental observations, a comprehensive set of calculated absorption and emission energies for the relevant Ce complexes is carried out. We obtain very good overall agreement, which enables us to correlate optical signatures with individual defect configurations.
Finally, it is shown that the solubilities of Sr, Ca, and Ba near the synthesis temperature are several 100 ppm, whereas much lower values are obtained for the alkaline metals. Be and Mg yield large solubilities but also cause large lattice distortions and effectively act as interstitials. These findings provide a rationale for why only Sr, Ca, and Ba have been experimentally found to improve scintillation performance.
As part of the present work we also introduce a convenient method for generating supercells with optimal shapes for defect calculations and finite-size scaling. The approach described in the appendix is applicable to arbitrary lattice types.
The paper is organized as follows. Section II describes the computational methodology used in this work. The results regarding the thermodynamic properties of intrinsic defects as well as Sr and Ce dopants are presented in Sect. III. Stokes shifts for single substitutional Ce and the triple complexes are reviewed and compared to experimental data and a dopant solubility analysis are presented. To conclude, we discuss our findings in light of scintillator performance in Sect. IV. The Appendices provide additional information concerning defect thermodynamics, solubilities, and finite size scaling of formation energies.
II Methodology
II.1 General computational parameters
Calculations were performed within density functional theory (DFT) using the projector augmented wave (PAW) method Blöchl (1994); *KreJou99 as implemented in the Vienna ab-initio simulation package Kresse and Hafner (1993); *KreHaf94; *KreFur96a; *KreFur96b. Exchange-correlation (XC) effects were treated within the generalized gradient spin approximation Perdew et al. (1996). DFT+ type on-site potentials Dudarev et al. (1998) were included for both La- () and Ce- states () in order to obtain the correct ordering of La- and states and to reproduce experimental Ce- ionization energies Czyżyk and Sawatzky (1994); Canning et al. (2011); Åberg et al. (2012). The plane wave energy cutoff was set to 230 eV and Gaussian smearing with a width of 0.1 eV was used to determine occupation numbers.
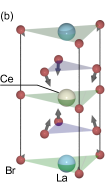
Lanthanum bromide adopts a hexagonal lattice structure in space group 176 (P/m) with La and Br ions occupying Wyckoff sites and , respectively. Using the aforementioned computational parameters one obtains lattice parameters of and to be compared with experimental values of and , respectively Krämer et al. (1989).
Spin-orbit interaction was not included self-consistently but rather added as a perturbation to the states for optical transitions according to
where as obtained from the splitting in a Ce- configuration.
II.2 Excited states
Excited Ce- states were obtained in a similar approach as used by Canning and co-workers. Canning et al. (2011); Chaudhry et al. (2014). First, a subspace of Ce- states is identified by selecting states whose projection onto spherical harmonics with exceeds a suitably chosen threshold. This is made possible by the localized nature of the rare-earth states. In this particular case, a Ce excitation was emulated by completely deoccupying the manifold while keeping the number of electrons fixed. This results in a narrow, almost degenerate, group of unoccupied group of 14 bands inside the fundamental electronic gap. The occupation numbers of Kohn-Sham states above this group is then occupied using Gaussian smearing, allowing for excited state structural relaxation.
II.3 Defect calculations
Defect formation energies were calculated using a well established thermodynamic formalism Zhang and Northrup (1991); *ErhAbeLor10 that is summarized for convenience in Appendix A. Lanthanum bromide has a small dielectric constant and some defects adopt large charge states (). As a result, image charge interactions are substantial and care must be taken to remove finite-size effects in order to obtain formation energies for the dilute limit Lany and Zunger (2008). To this end a careful finite-size scaling study was carried out that is summarized in Appendix C. This Appendix also introduces a general and convenient method for constructing suitable supercells with optimal shape given a certain system size, which allows one to obtain a dense sampling of different system sizes also in the case of low crystal symmetry. Hole polarons were studied using the polaron self-interaction correction method (pSIC) Sadigh et al. (2014).
The bulk of the data presented in the following were obtained using 168-atom supercells. -point sampling was found to be sufficient to converge defect formation energies to better than 0.05 eV. Configurations were relaxed until ionic forces were less than 10 meV/Å. Potential alignment as well as periodic image charge corrections were taken into account to correct for finite size effects as detailed in Appendix C Lany and Zunger (2008).
It is well known that conventional XC functionals including the ones used in the present work commonly lead to an underestimation of band gaps. As discussed for example in Refs. Persson et al., 2005; Erhart and Albe, 2007, 2008; Lany and Zunger, 2008; Erhart et al., 2010, this error also affects defect formation energies and therefore also defect concentrations. Hybrid XC functionals, which combine conventional DFT functionals with Fock exchange, are often found to improve the band gap and are therefore expected to also yield improved formation energies. For the present case, however, hybrid functionals are ill-suited since they cannot even qualitatively describe the position of the occupied Ce- level in LaBr3. This is related to the distinct character of the electronic states involved. They are associated with widely different levels of localization and thus the effective screening cannot be parametrized using a single (static) mixing parameter.
In the present study we therefore resort to a simple correction scheme Persson et al. (2005); Erhart and Albe (2007, 2008); Lany and Zunger (2008) that shifts the formation energies based on the offset between the “true” band edges and the ones obtained within the underlying computational framework, i.e., in the present case DFT+ calculations. The offsets were determined using the method Hedin (1965); Hedin and Lundqvist (1970), which was previously found to yield a much improved description of the band structure of LaBr3 compared to both DFT and DFT+ Åberg et al. (2012). Calculations for the primitive cell were carried out using a -centered -point mesh and PAW data sets optimized for calculations, which require also unoccupied higher energy states to be well described. The dielectric tensor was computed for energies up to 200 eV above the CBM, equivalent to 1024 unoccupied bands. The offsets obtained in this way are for the valence band edge and for the conduction band edge. This increases the DFT+ band gap from 3.6 eV to 5.3 eV, which is in much better agreement with the experimental value of 5.9 eV Dorenbos et al. (2006). The correction scheme was only applied to defect charge states that did not include occupied localized states inside the band gap. As this distinction can be ambiguous, additional calculations were carried out for 96-atom supercells of the most important defect configurations to verify the results from the correction scheme. In these calculations the Brillouin zone was sampled using the -point only and the same optimized PAW data sets as before were employed. The dielectric function was calculated up to 36 eV above the CBM. Based on this comparison the error in the formation energies is estimated to be 0.2 eV or less whereas for the transition levels the error is estimated to be below 0.1 eV.
III Results
III.1 Intrinsic defects
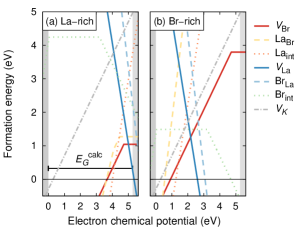

In this section the defect equilibria in nominally pure LaBr3 are investigated. To this end, one first requires knowledge of the formation energies of intrinsic defects, which are shown for La and Br-rich conditions (see Appendix A) in Fig. 1(a,b). It is apparent that under both La and Br-rich conditions the most important intrinsic donor and acceptor defects are Br and La vacancies, respectively, with interstitials and antisites playing minor roles.
Given the respective formation energies it is straightforward to compute the equilibrium transition level between charge states and according to
| (1) |
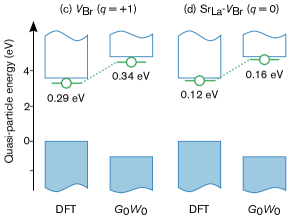
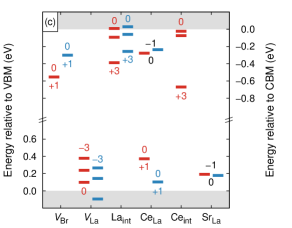
Experimentally, these can be detected for example by deep level transient spectroscopy. The levels calculated according to Eq. (1) are shown as red bars (left hand columns) in Fig. 3, which reveals that both types of vacancies are associated with deep equilibrium transition levels. Note in particular that the +1/0 equilibrium transition level of the Br vacancy is located 0.55 eV below the CBM. In calculations, the quasi-particle energies associated with defect levels shift by less than 0.1 eV relative to the CBM, which provides strong support for this positioning of the defect level with respect to the conduction band edge. This is illustrated in Fig. 2(c,d), which compares quasi-particle energies from DFT and calculations for both isolated and complexes Br vacancies. Note that for consistency, only transition levels obtained from DFT+ calculations including band gap corrections are reported from here on.
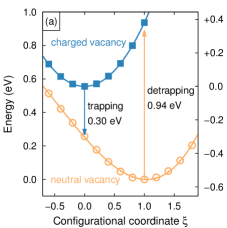
Deep defects are typically associated with pronounced changes in the ionic positions between different charge states. This is indeed shown to be the case for Br vacancies in Fig. 2(a), which shows the potential energy surfaces (PES) for both neutral and charged vacancies along the configuration coordinate connecting the respective minima. A particular configuration is given in terms of the configuration coordinate as
| (2) |
where denotes the minimum of the PES for charge state and measures the structural difference between the two geometries.
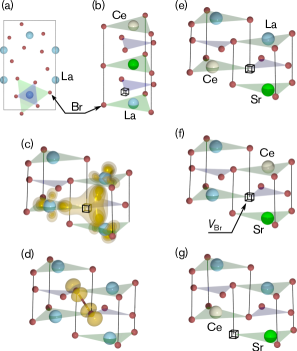
In the ideal structure, Br sites are surrounded by three cations (two out-of-plane and one in-plane with respect to the {0001} basal plane) at distances between 3.1 and 3.2 Å and eight Br ions (two in-plane, six out-of-plane) at distances of 3.6–3.7 Å, see Fig. 4. In the charged vacancy configuration, the La neighbors of the vacant site move outward by 0.2–0.3 Å while the Br neighbors move inward by up to 0.3 Å. These relaxations are inverted for the neutral vacancy as La and Br neighbors are shifted inward and outward, respectively compared to the ideal structure. The large differences in ionic configuration are, as shown in Fig. 2(a), associated with substantial relaxation energies of 0.25 and 0.38 eV on the neutral and charged PES, respectively. As illustrated in Fig. 4(c), the defect level is predominantly composed of states localized at the three cations surrounding the vacant Br site, which as discussed below is of crucial importance for understanding the effect of Br vacancies on the optical signature of Ce. The defect level can act as an efficient electron trap, effectively removing carriers from the light-generation process during the instrumentation pulse shape-time.
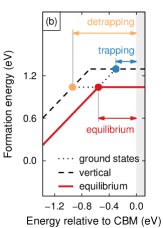
In terms of electronic trapping, also “vertical” transitions are important, which are indicated by the vertical arrows in Fig. 2(a). They can be calculated in a fashion similar to Eq. (1) but imposing the constraint of fixed ionic position. Specifically, the trapping level for charge state is obtained as
| (3) |
where is the formation energy computed for charge state at the ionic coordinates corresponding to the equilibrium positions in charge state . All trapping levels presented in this paper were calculated with respect to the respectively more favorable charge state, e.g., for the Br vacancy and , …for the La vacancy.
Equilibrium transition and trapping levels can also be identified with crossing points in plots of the formation energy vs. electron chemical potential as illustrated in Fig. 2(b). In this figure, dashed lines correspond to formation energies computed in the geometry of the respective other charge state, i.e. in the case of the neutral vacancy at and vice versa. The equivalence of trapping and detrapping type transitions relative to the charge vacancy are shown by the blue and orange arrows in Figs. 2(a) and (b). Both equilibrium transition and trapping levels are compiled in Fig. 3 for the most relevant intrinsic and extrinsic (see below) defects.
Using the pSIC method,Sadigh et al. (2014) we have identified several self-trapped hole configurations (also known as centers). Analogously to the classic centers in NaI, the self-trapped polaron configurations in LaBr3 involve a dimerization of two halide ions. We find that the Br–Br distance of the most energetically favorable center is 2.98 Å compared to 3.6 Å in the ideal lattice, see Fig. 4(d), with a binding/formation energy of . A more detailed exposition on polaron binding energies and migration barriers in LaBr3 will be published elsewhere.
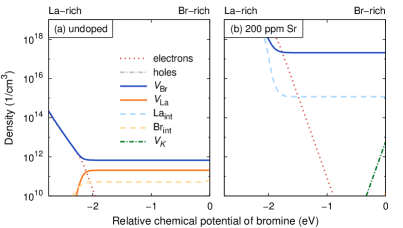
Knowledge of the formation energies in combination with the charge neutrality condition, see Sect. II, allows one to compute defect concentrations as a function of the chemical boundary conditions as done previously in Ref. Åberg et al., 2014. Here, it is exemplarily illustrated in Fig. 5(a), which shows the dependence of defect concentrations and free charge densities on the relative chemical potential of Br, , assuming full equilibrium at a temperature of 600 K. In this representation, corresponds to Br-rich conditions, implying that the material is equilibrated with respect to a Br-rich reservoir such as Br2 gas, see Appendix A. In the La-rich limit, , which is equivalent to .
According to Fig. 5(a) for the widest range of chemical conditions charge equilibrium is accomplished by La and Br vacancies, which act as acceptors and donors, respectively, or in Kröger-Vink notation . In the extreme La-rich limit the present calculations suggest that the La vacancies in this balance are replaced by free electrons, albeit at a small concentration. As the band gap is underestimated with respect to experiment (5.3 vs 5.9 eV, compare Sect. II), the concentrations of free charge carriers are somewhat overestimated relative to defects. Being aware of this shortcoming we focus on the Br-rich limit from here on. The general conclusions drawn from our results are, however, entirely unaffected by this issue.
III.2 Strontium
After the basic properties of intrinsic defects have been established, one can now explore the effect of Sr incorporation. The energetics of interstitial as well as substitutional defect configurations were considered as shown in Fig. 1(c,d), from which emerges as the dominant form. This defect acts as a singly charged acceptor over the widest range of electron chemical potentials with an equilibrium transition level less than 0.2 eV above the valence band maximum (VBM). Both the positioning of the transition level in the vicinity of the band edge and vanishingly small structural changes between charge states and indicate that the defect is electronically shallow.
Under certain chemical conditions interstitial Br, which acts as a shallow donor, can also assume low formation energies. From a more detailed analysis of defect concentrations this defect is, however, found to occur generally in much smaller concentrations than .
The effect of Sr doping on intrinsic defect concentrations is exemplarily shown for a temperature of 600 K in Fig. 5(b). The vast majority of Sr is incorporated as and as an acceptor is balanced by Br vacancies, i.e. . As typical doping concentrations of Sr are between 50 and 200 ppm Alekhin et al. (2013a) this implies that co-doping with Sr leads to a substantial increase in the concentration of Br vacancy compared to pure LaBr3.
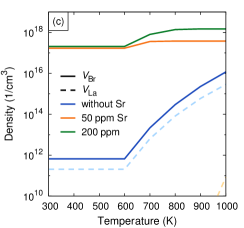
Due to the limited mobility of atoms (and thus defects) at low temperatures crystalline materials are usually not in full defect equilibrium at low temperatures, say near room temperature. Rather defect concentrations are “frozen in” as the material is cooled down after manufacturing. A representative “freezing” temperature of 600 K was assumed to generate Fig. 5(c), which shows the evolution of the concentrations of intrinsic defects both for pure and doped materials. The data demonstrates that Sr doping can be expected to increase the Br vacancy concentration by up to five orders of magnitude compared to (nominally) pure material.
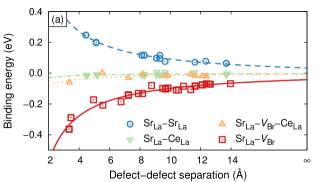
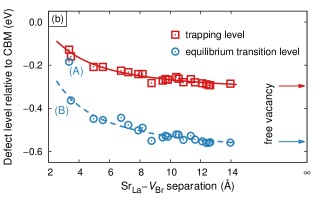
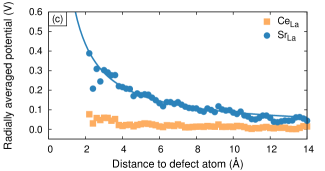
The opposite charge states of and cause mutual attraction as already shown in Ref. Åberg et al., 2014. The interaction strength is quantified in Fig. 6(a) revealing a binding energy of for the nearest neighbor complex.111We here adopt the convention that negative binding energies indicate attraction. A closer inspection of the electronic structure of the complex reveals that the defect levels associated with the Br vacancy are shifted closer to the CBM by up to 0.4 eV compared to the isolated vacancy, see Fig. 6(b). The shift of the defect level can be rationalized by considering that (unlike for example ) introduces a point charge-like electrostatic potential that shifts the local energy scale, see Fig. 6(c). Localized states such as the defect level are sensitive to this shift whereas the delocalized states that make up the valence and conduction bands are unaffected, causing an effective upward shift of the vacancy level.
It should be noted that there are two distinct first nearest neighbor configurations, which correspond to the Sr vacancy being oriented out-of-plane (point A) and in-plane (point B) relative to each other, respectively, compare Fig. 4. In spite of the very similar separation between vacancy and Sr, the out-of-plane complex has an equilibrium transition level that is 0.2 eV closer to the CBM than in the in-plane geometry. This difference arises from the local constraints on relaxation that affect the two configurations differently. A similar effect is also observed in connection with the Stokes shifts associated with -vacancy complexes, see Sect. III.4.
In short, the incorporation of Sr in LaBr3 thus (i) increases the Br vacancy concentration by several orders of magnitude and (ii) reduces the separation between vacancy level and CBM. These two effects have important implications with respect to understanding the improved scintillation response of Ce/Sr co-doped LaBr3 as will be discussed in detail in Sect. IV. Another important factor in this regard that should be mentioned here is the very small lattice distortion that occurs upon Sr incorporation, which will be revisited in Sect. III.5.
III.3 Cerium
We now move on to consider the incorporation of Ce. Substitutional is energetically clearly preferred over Ce interstitial and configurations. It remains neutral over the widest range of corresponding to -. If drops below the level is depopulated leading to a configuration that corresponds to -. This range of electron chemical potentials is, however, typically not observed in experimental settings as demonstrated by the absence of signatures Alekhin et al. (2014). Under La-rich conditions the formation energy difference between interstitial and substitutional Ce is reduced but remains the most dominant defect. The formation energy for is assuming equilibrium with CeBr3 regardless of chemical condition. The negative formation energy indicates full solubility of Ce in LaBr3, which is compatible with the large amounts of Ce that are routinely substituted into the material.
As shown in Fig. 6(a), the interaction of with other defects is very weak. Since is furthermore neutral under all relevant conditions, its effect on the charge neutrality condition and the concentrations of other defects is negligible.
| Site | Figure | Excitation | Emission | Stokes shift | |||||
|---|---|---|---|---|---|---|---|---|---|
| (eV) | (eV) | (eV) | (eV) | (eV) | (Å) | ||||
| Calculation | |||||||||
| 3.56 | 2.78 / 3.13 | 0.43 | 0.19 | 0.24 | 0.35 | ||||
| IP, OP | 4(e) | 0.00 | 3.24 | 2.73 / 3.08 | 0.16 | 0.07 | 0.09 | 0.24 | |
| OP, OP | 4(f) | 0.02 | 3.33 | 2.73 / 3.08 | 0.25 | 0.11 | 0.14 | 0.34 | |
| OP, IP | 4(g) | 0.09 | 3.28 | 2.55 / 2.90 | 0.38 | 0.15 | 0.23 | 0.49 | |
| Experiment (Ref. Alekhin et al., 2014) | |||||||||
| I | 4.03 | 3.47 / 3.19 | 0.56 | ||||||
| II | 3.59 | 3.36 / 3.10 | 0.24 | ||||||
| III | 3.47 | 3.27 / 3.10 | 0.21 | ||||||
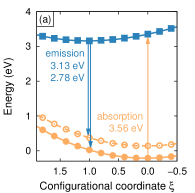
Upon high energy radiation or absorption above the band gap, Ce can be excited corresponding to the transition from - to -. The latter is associated with the emergence of electronic levels close to the CBM. They are predominantly of Ce- character and strongly hybridized with the neighboring La- states. The calculated ground and excited state PES for are shown in the configuration coordinate diagram Fig. 7(a). While in the ground state configuration the ionic positions are almost unchanged compared to the perfect lattice, in the excited state the nearest neighbor Br atoms move inward by about 0.1,Å.
We obtain excitation and emission energies of 3.56 and 3.13/2.78 eV, where the latter two values correspond to final states and , respectively, see Table 1. These data underestimate the experimental values of 4.03 and 3.47/3.19 eV (site I in Table 1) by 0.47 and 0.34/0.41 eV, respectively, which is expected given the well known band gap error of DFT. The error is, however, systematic and affects all transitions considered here in approximately the same way. The difference between the excitation and the larger emission energy gives the Stokes shift, for which the calculations yield 0.43 eV in good agreement with the experimental value of 0.55 eV. The relation between the ground and excited state landscapes is further illustrated in the configuration coordinate diagram Fig. 7.
The excitation and emission lines as well as the Stokes shift for Ce in LaBr3 were also calculated by Andriessen and co-workers Andriessen et al. (2007), who obtained a value of 0.42 eV for the latter in close agreement with the present calculations in spite of differences in the computational approach regarding both pseudopotentials, the treatment of -states, and the description of the excited state. In contrast to those calculations, however, we do not obtain an asymmetric relaxation pattern for the excited state, in which the Ce ion is displaced along one of the Ce–Br bonds, described in Ref. Andriessen et al., 2007 and interpreted as a pseudo Jahn-Teller distortion. Rather we obtain a symmetric displacement pattern as described above even if the structural optimization is started from the asymmetric structure from Ref. Andriessen et al., 2007. We conjecture that this discrepancy is related to the lack of DFT+ correction terms in Ref. Andriessen et al., 2007, which lead to both an erroneous ordering of La- and states Åberg et al. (2012) and partial occupancy of the Ce- level in the - configuration.
III.4 Optical signatures of Ce complexes
Introduction of Sr in the lattice is associated with the emergence of additional features in the optical spectra Alekhin et al. (2014), indicating the existence of at least two additional Ce sites characterized by different Stokes shifts and also different absorption and emission wavelengths. As discussed above, Ce does not exhibit a propensity to form stable defect clusters. On the other hand, we have shown that and have a strong tendency to bind in two separate configurations. The Ce dopant level in detector material can be as high as 5%. Even without defect-defect interactions, this implies that statistically there is a large probability of 14% for a Ce to be in the immediate vicinity of a cluster. By inspection we find three different nearest neighbor triple clusters, depicted in Fig. 4 (e–g). Each of these is characterized by the position [out-of-plane (OP) or in-plane (IP)] of the Br vacancy relative to Sr and Ce.
For the IP, OP cluster, see Fig. 4(e), we obtain excitation and emission energies of 3.24 and 3.08/2.73 eV. This corresponds to a Stokes shift of 0.16 eV, much smaller than the predicted value for (see Table 1). Similarly, the Stokes shifts of OP, OP [Fig. 4(d)] and OP, IP [Fig. 4(e)] are 0.25 and 0.38 eV, respectively. In the nomenclature of Ref. Alekhin et al., 2014 we thus tentatively assign the first cluster to site III, and the remaining two to site II.
The smaller Stokes shifts for the triple clusters can be rationalized in terms of smaller structural relaxations in the excited state as measured by of Eq. (2), see Table 1. We indeed find a direct correlation between the size of the Stokes shift and the amount of relaxation. In effect, this confirms the hypothesis of Refs. Dorenbos et al., 2013 that the Ce excitation has a weaker influence on the geometrical structure if another defect is in its vicinity.
III.5 Solubility analysis
The detailed investigation of Sr related defects in Sects. III.2 and III.4 was motivated by the improvement of energy resolution observed for LaBr3:Ce co-doped with Sr. Similar effects were observed with Ca and Ba whereas doping with Li, Na, or Mg does not improve the scintillation response and can even be detrimental Alekhin et al. (2013b). To resolve these observations, the investigation of dopant related defects was extended to cover both the alkaline (Li, Na, K, Rb, Cs) and alkaline earth (Be, Mg, Ca, Sr, Ba) groups. It comprised the same configurations and charge states that were already described in Sect. III.2. Defect formation energies were computed with respect to the respective bromide compounds (see Appendix B, Br-rich conditions), which are commonly used to introduce the dopants in the synthesis Alekhin et al. (2013b).
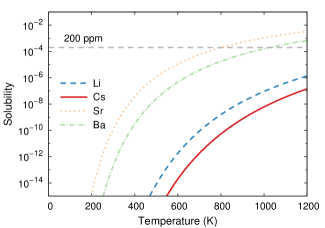
The results with regard to the dependence of the electron chemical potential are qualitatively similar to Fig. 1(c,d) for all dopants considered here. The formation energies of different dopants shift, however, relative to each other. Under Br-rich conditions the Fermi level is located in the lower part of the band gap. Under these circumstances, substitution on La is energetically the most favorable form for Ca, Sr, and Ba, whereas interstitial configurations are preferred for the Be and Mg. For the alkaline metals, substitution on La sites is preferred but the formation energies are noticeably larger than for the alkaline earth metals. The solubility can be obtained from the formation energies for substitution on La and Eq. (4), which yields the data shown in Fig. 8. It is apparent that the solubilities of alkaline metals are generally several orders of magnitude smaller than for the alkaline earth metals.
Experimentally, only Ba, Sr, and Ca are found to achieve an improvement in scintillator response. This behavior can be understood on the basis of these results as follows: While the alkaline metals appear to be electronically and geometrically well matched to the LaBr3 lattice (small distortions, shallow levels), their solubilities are too small to accomplish thermodynamically significant incorporation. Be and Mg exhibit small formation energies and thus relatively higher solubilities. They are, however, associated with substantial lattice distortions and interstitial-like configurations, which gives rise to carrier scattering and an overall degradation of electronic conduction. In the end, only the heavy alkaline earth metals (Ca, Sr, Ba) combine excellent electronic and geometric match (small strains, shallow levels) with sufficiently large solubilities, providing a rationale for the success of these dopants.
IV Discussion and conclusions
To summarize, a comprehensive investigation of intrinsic and extrinsic defects in LaBr3 has been conducted on the basis of first principles calculations within density functional theory. The vacancies, and , were found to be the most dominant intrinsic donor and acceptor defects, respectively. The equilibrium concentration of in the nominally pure (undoped) case is about , assuming a freezing-in temperature of 600 K. The Br vacancy is associated with deep equilibrium transition, trapping, and detrapping levels located several tenths of an eV below the CBM.
Sr substitutes for La and acts as a shallow acceptor. Assuming a Sr dopant concentration of 200 ppm, charge compensation to ensure overall neutrality increases the concentration by up to five orders of magnitude. The coulombic attraction between these two species causes formation of stable complexes with a binding energy of about . Upon this reaction the defect level associated with the vacancy is shifted by up to 0.4 eV toward the CBM. Thus, incorporation of Sr introduces a multitude of shallow electron traps.
Cerium substitutes for La in a local 3+ charge state and the calculations support the experimental conclusion that no appreciable amount of Ce 4+ is present Alekhin et al. (2014). Since Ce substitutes another triply ionized atom it has no electrostatic interactions with other defects and hence does not prefer to bind to either , , or their complexes. The high Ce concentrations used in practice, however, imply that there is very high probability of 14% for a Ce atom to be in the first neighbor shell of a complex. This picture is supported by the good agreement between experimentally observed and computed Stokes shifts for the transition of isolated as well as complexed Ce.
In the Ce configuration, the empty levels reside inside the conduction band while the occupied state is associated with a deep level inside the gap. Conversely, in the excited configuration, an occupied level is present inside the band gap. Excluding the possibility of energy transfer from an exciton, we note that the Ce is most likely to be excited via a sequential hole and electron capture. In the Ce-only doped case, which is almost identical to the nominally pure material, no substantial amount of electron traps can be expected. Furthermore, since the Ce level is very deep, it is natural to assume that the initial hole capture is the rate limiting step and thus that there is no fast mechanism to reduce the electron/hole density. This certainly favors Auger recombination, the rate of which has a cubic dependence on the excitation density and which has been shown to be a major quenching channel at the relevant time scales for halide scintillators in -scan experiments Williams et al. (2013); Grim et al. (2013).
Conversely, by co-doping with Sr, the electron trap levels not only become more shallow, which allows for faster trapping/detrapping rates, but the trap density increases by several orders of magnitude in the form of complexes. If these traps are active during the initial thermalization stage (2–10 ps in halide systemsGrim et al. (2013)) they will effectively reduce the free electron density. As a result, a larger number of holes will remain available for ionization of cerium activators as the probability for quenching of electron-hole pairs via the Auger mechanism should be greatly reduced. Recent picosecond optical absorption experiments have shown that energy transfer to europium activators in SrI2:Eu may be as fast as 400 fs Ucer et al. (2014), which demonstrates that very fast capture is indeed possible. As each defect complex will be in close proximity to a Ce atom, once any of the nearby Ce atoms captures a hole, Coulombic attraction serves as a driving force for transferring the electron from the complex to the activator. This suggests that non-linear quenching is reduced at the cost of longer decay-times. In fact, two of the three cerium sites discussed in Ref. Dorenbos et al., 2013 are associated with very long decay times ranging from 60 to 2500 ns while accounting for 20-45 % of the total light output Alekhin et al. (2014).
The mechanism outlined above demonstrates that co-doping of wide gap materials, in particular scintillators, provides an efficient means for managing charge carrier populations under out-of-equilibrium conditions. In the case of LaBr3:Ce,Sr the co-dopant manipulates not only the concentrations but also the electronic properties of intrinsic defects (specifically ) without introducing additional gap levels. This leads to the presence of shallow electron traps that can localize charge carriers on a nanosecond time scale, effectively deactivating charge carrier recombination channels. The principles of this mechanism are therefore not specific to the material considered here but can be adapted for controlling charge carrier recombination in other wide gap materials.
Acknowledgements.
We acknowledge fruitful discussions with S. Payne, G. Bizarri, and R. T. Williams. This work was performed under the auspices of the U.S. Department of Energy by Lawrence Livermore National Laboratory under Contract DE-AC52-07NA27344 with support from the National Nuclear Security Administration Office of Nonproliferation Research and Development (NA-22). Specifically, modeling of excited Ce states was supported by the Laboratory Directed Research and Development Program, Project. No. 13-ERD-038, at Lawrence Livermore National Laboratory. P.E. acknowledges funding from the Knut and Alice Wallenberg Foundation and the European Research Council in the form of a Marie Curie Career Integration Grant. Computer time allocations by the Swedish National Infrastructure for Computing at NSC (Linköping) and C3SE (Gothenburg) are gratefully acknowledged.Appendix A Defect thermodynamics
In the dilute limit the equilibrium concentration of a defect depends on its free energy of formation, , via
| (4) |
where is the concentration of possible defect sites. The formation free energy is usually approximated by the formation energy , which is legitimate if the vibrational entropy and the pressure-volume term are small Åberg et al. (2008). The formation energy of a defect in charge state is given by Qian et al. (1988); Zhang and Northrup (1991); Erhart and Albe (2007)
| (5) |
where is the total energy of the system containing the defect and is the total energy of the ideal host. The second term describes the dependence on the electron chemical potential, , which is measured with respect to the valence band maximum (VBM), . The formation energy also depends on the chemical potentials of the constituents as given by the last term, where the difference between the number of atoms of type in the ideal cell with respect to the defect cell is denoted by . The chemical potential of constituent can be rewritten as where denotes the chemical potential of the standard reference state. Neglecting entropic contributions the chemical potentials of the reference phases can be replaced by their cohesive energies at zero Kelvin. Note that the summation in the last term also includes dopant or impurity species, whence one has to consider the source of the dopant or impurity atom when discussing formation energies and solubilities (see Sect. III.5). The chemical potentials of La and Br are coupled to each other via the formation enthalpy of the compound, i.e., . This implies that specifying either or is sufficient to determine the chemical equilibrium with respect to the host. Following common practice we refer to La and Br-rich conditions, which correspond to and , respectively.
Appendix B Thermodynamic boundary conditions
When calculating defect formation energies of intrinsic defects according to Eq. (5) it is sufficient to consider the chemical potentials for La and Br only as indicated above; specifically, for La-rich conditions
| (6) | ||||
| whereas for Br-rich conditions | ||||
| (7) | ||||
Once extrinsic elements have to be taken into account additional conditions must be invoked. To be specific consider the case of Sr, which introduces one additional chemical potential, , in Eq. (5). One could assume the dopant to be in equilibrium with its elemental (metallic) form, which implies
| (8) |
Sr and Br can, however, react to form SrBr2 and it is therefore more appropriate to consider the equilibrium with respect to the compound, which is also used experimentally for introducing the dopant during synthesis Alekhin et al. (2013b),
| (9) |
Since this reaction involves an element of the host the intrinsic boundary conditions (La and Br-rich) explicitly affect the condition for the chemical potential of Sr. In Br-rich conditions
| (10) |
while in the La-rich limit
| (11) |
The extension to other elements is straightforward. For the chemical potentials of the alkaline metals for example one obtains
| Br-rich | (12) | ||||
| (13) |
These conditions are used in Sect. III.5 to determine the solubilities of various dopants in LaBr3.
Appendix C Finite-size scaling
Given the small dielectric constant of LaBr3 and the large defect charge states that need to be considered it is crucial to properly correct for both electrostatic and elastic image charge interactions. Various correction schemes have been proposed for this purpose but ambiguities remain Komsa et al. (2012). In the present work we therefore resort to finite-size scaling, which if computationally affordable is expected to yield the most reliable results. Finite-size scaling is most commonly based on “simple” multiples of the underlying primitive cell. For example for diamond and zincblende structures supercells based on simple cubic, body-centered cubic, and face-centered cubic unit cells are often used Castleton and Mirbt (2004); Lany and Zunger (2008); Åberg et al. (2008). Since each of these cells is associated with a different Madelung constant the size dependence of for example the monopole-monopole correction, which is the leading electrostatic interaction term Makov and Payne (1995), will differ between these cells. It is therefore advantageous to consider scaling among a set of self-similar cells.
The direct application of this principle to the hexagonal unit cell of LaBr3 would allow the construction of only a very small number of supercells, which in turn would limit the reliability of the finite-size scaling procedure. To resolve this situation we devised a systematic way to construct “optimal” supercells. Optimality here implies that we seek to find supercells that for a given size (number of atoms) most closely approximate a cubic cell shape. This approach ensures that the defect separation is large and that the electrostatic interactions exhibit a systematic scaling. (Recall that for example the monopole-monopole interaction is given by the Madelung constant, which is only dependent on the shape of the unit cell).
The cubic cell metric for a given volume is
| (14) |
which in general does not satisfy the crystallographic boundary conditions. The -norm provides a convenient measure of the deviation of any other cell metric from a cubic shape (“acubicity”)
| (15) |
Cell metrics that are compatible with the crystal symmetry can be written as integer multiples of the underlying primitive unit cell , i.e.
| (16) |
The optimal cell shape multiplier for a given cell size is then obtained as follows
| (17) |
where is the desired system size in multiples of the primitive unit. This approach is generally applicable and can be readily generalized to optimize toward other supercell shapes, e.g., face-centered or body-centered cubic.
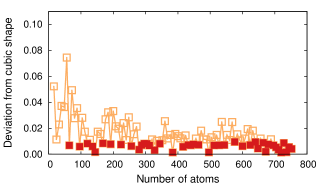
A series of supercells was generated based on Eq. (17) for all possible sizes up to 752 atoms (). The lowest values of achieved in this fashion are shown in Fig. 9. We empirically find that supercells, for which is lower than 0.02, are sufficiently close to a cubic shape for our purposes. The sizes for which this limit is reached are indicated by the filled red symbols in Fig. 9.
Using supercells containing between 24 and 496 atoms defect calculations were carried out for Br and vacancies and antisites in charge states that were identified as relevant ones on the basis of earlier 96-atom cell calculations. The thus obtained configurations were analyzed as follows. Formation energies were computed using the thermodynamic formalism described in Appendix A. The formation energies obtained according to Eq. (5) are referred as “raw” data in the following. In addition we considered the effect of potential alignment (PA) and image charge corrections. The potential alignment correction amounts to a term . In the present work we determined by taking the difference of the electrostatic potential between defect and ideal supercell, with the potential being measured by a test charge at the ionic site farthest from the defect center. For the image charge correction we adopted the simplified correction described in Ref. Lany and Zunger, 2008, which involves the addition of a term where is the electrostatic energy associated with a periodic array of point charges according to the supercell metric taking into account dielectric screening due to both electrons and ions. This correction term should reflect both monopole-monopole and monopole-quadrupole terms. The resulting expression for the formation energy is
| (18) |
The leading terms in Eq. (18) should scale with and (or and ), therefore we also fit formation energies obtained from Eq. (5) to the following expression
| (19) |
where , and were treated as fit parameters.
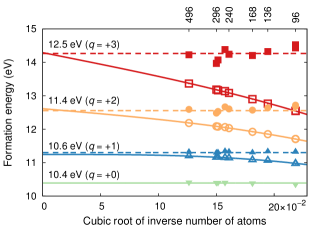
The results of this analysis are exemplified in Fig. 10, which illustrates the scaling for La vacancies in various charge states. Analysis of e.g., Br vacancies, antisites, and interstitials yield very similar plots. In all cases we find that the combination of potential alignment and image charge corrections yields formation energies that approximate the infinite limit rather well. The accuracy of the thus corrected data is, however, limited by the accuracy associated with the determination of the potential alignment correction and the approximitive nature of the image charge correction. Note that the corrections do not account for elastic image interactions. The comparison of extrapolated values, which do include elastic effects, and corrected data, which do not, indicates that elastic interactions are, however, negligible in the present case. This conclusion is further supported by the fact that the formation energies of neutral defects are almost independent of system size for .
References
- Rodnyi (1997) P. A. Rodnyi, Physical processes in inorganic scintillators (CRC Press, Boca Raton, 1997).
- Knoll (2010) G. F. Knoll, Radiation detection and measurement; 4th ed. (Wiley, New York, NY, 2010).
- Nelson et al. (2011) K. E. Nelson, T. B. Gosnell, and D. A. Knapp, Nucl. Instrum. Meth. A 659, 207 (2011).
- Dorenbos (2010) P. Dorenbos, IEEE Trans. Nucl. Sci. 57, 1162 (2010).
- Dorenbos (2005) P. Dorenbos, Phys. Status Solidi A 202, 195 (2005).
- Vasil’ev (2008) A. V. Vasil’ev, IEEE Trans. Nucl. Sci. 55, 1054 (2008).
- Kerisit et al. (2009) S. Kerisit, K. M. Rosso, B. D. Cannon, F. Gao, and Y. Xie, J. Appl. Phys. 105, 114915 (2009).
- Bizarri et al. (2009) G. Bizarri, W. Moses, J. Singh, A. Vasil’ev, and R. Williams, J. Lumin. 129, 1790 (2009).
- Payne et al. (2011) S. Payne, W. W. Moses, S. Sheets, L. Ahle, N. Cherepy, B. Sturm, S. Dazeley, G. Bizarri, and W.-S. Choong, IEEE Trans. Nucl. Sci. 58, 3392 (2011).
- Yang et al. (2012) K. Yang, P. Menge, J. Buzniak, and V. Ouspenski, in Nuclear Science Symposium and Medical Imaging Conference (NSS/MIC), 2012 IEEE (2012) pp. 308–311.
- Alekhin et al. (2013a) M. S. Alekhin, J. T. M. de Haas, I. V. Khodyuk, K. W. Krämer, P. R. Menge, V. Ouspenski, and P. Dorenbos, Appl. Phys. Lett. 102, 161915 (2013a).
- Dorenbos et al. (2013) P. Dorenbos, M. Alekhin, I. V. Khodyuk, J. T. M. de Haas, and K. Krämer (Presented at SCINT 2013, Shanghai, China, 2013).
- Alekhin et al. (2014) M. S. Alekhin, S. Weber, K. W. Krämer, and P. Dorenbos, Journal of Luminescence 145, 518 (2014).
- Åberg et al. (2014) D. Åberg, B. Sadigh, A. Schleife, and P. Erhart, Applied Physics Letters 104, 211908 (2014).
- Blöchl (1994) P. E. Blöchl, Phys. Rev. B 50, 17953 (1994).
- Kresse and Joubert (1999) G. Kresse and D. Joubert, Phys. Rev. B 59, 1758 (1999).
- Kresse and Hafner (1993) G. Kresse and J. Hafner, Phys. Rev. B 47, 558 (1993).
- Kresse and Hafner (1994) G. Kresse and J. Hafner, Phys. Rev. B 49, 14251 (1994).
- Kresse and Furthmüller (1996a) G. Kresse and J. Furthmüller, Phys. Rev. B 54, 11169 (1996a).
- Kresse and Furthmüller (1996b) G. Kresse and J. Furthmüller, Comput. Mater. Sci. 6, 15 (1996b).
- Perdew et al. (1996) J. P. Perdew, K. Burke, and M. Ernzerhof, Phys. Rev. Lett. 77, 3865 (1996), erratum, ibid. 78, 1396(E) (1997).
- Dudarev et al. (1998) S. L. Dudarev, G. A. Botton, S. Y. Savrasov, C. J. Humphreys, and A. P. Sutton, Phys. Rev. B 57, 1505 (1998).
- Czyżyk and Sawatzky (1994) M. T. Czyżyk and G. A. Sawatzky, Phys. Rev. B 49, 14211 (1994).
- Canning et al. (2011) A. Canning, A. Chaudhry, R. Boutchko, and N. Grønbech-Jensen, Phys. Rev. B 83, 125115 (2011).
- Åberg et al. (2012) D. Åberg, B. Sadigh, and P. Erhart, Phys. Rev. B 85, 125134 (2012).
- Krämer et al. (1989) K. Krämer, T. Schleid, M. Schulze, W. urland, and G. Meyer, Zeitschr. Anorg. Allg. Chemie 575, 61 (1989).
- Chaudhry et al. (2014) A. Chaudhry, R. Boutchko, S. Chourou, G. Zhang, N. Grønbech-Jensen, and A. Canning, Physical Review B 89, 155105 (2014).
- Zhang and Northrup (1991) S. B. Zhang and J. E. Northrup, Phys. Rev. Lett. 67, 2339 (1991).
- Erhart et al. (2010) P. Erhart, D. Åberg, and V. Lordi, Phys. Rev. B 81, 195216 (2010).
- Lany and Zunger (2008) S. Lany and A. Zunger, Phys. Rev. B 78, 235104 (2008).
- Sadigh et al. (2014) B. Sadigh, P. Erhart, and D. Åberg, arXiv:1401.7137 (2014).
- Persson et al. (2005) C. Persson, Y.-J. Zhao, S. Lany, and A. Zunger, Phys. Rev. B 72, 035211 (2005).
- Erhart and Albe (2007) P. Erhart and K. Albe, J. Appl. Phys. 102, 084111 (2007).
- Erhart and Albe (2008) P. Erhart and K. Albe, J. Appl. Phys. 104, 044315 (2008).
- Hedin (1965) L. Hedin, Phys. Rev. 139, A796 (1965).
- Hedin and Lundqvist (1970) L. Hedin and S. Lundqvist, in Solid State Physics, Vol. Volume 23, edited by D. T. Frederick Seitz and H. Ehrenreich (Academic Press, 1970) pp. 1–181.
- Dorenbos et al. (2006) P. Dorenbos, E. V. D. van Loef, A. P. Vink, E. van der Kolk, C. W. E. van Eijk, K. W. Krämer, H. U. Güdel, W. M. Higgins, and K. S. Shah, J. Luminescence 117, 147 (2006).
- Note (1) We here adopt the convention that negative binding energies indicate attraction.
- Andriessen et al. (2007) J. Andriessen, E. van der Kolk, and P. Dorenbos, Phys. Rev. B 76, 075124 (2007).
- Alekhin et al. (2013b) M. S. Alekhin, D. A. Biner, K. W. Krämer, and P. Dorenbos, 113, 224904 (2013b).
- Williams et al. (2013) R. T. Williams, J. Q. Grim, Q. Li, K. B. Ucer, G. A. Bizarri, S. Kerisit, F. Gao, P. Bhattacharya, E. Tupitsyn, E. Rowe, V. M. Buliga, and A. Burger, Proc. SPIE 8852, 88520J (2013).
- Grim et al. (2013) J. Q. Grim, K. B. Ucer, A. Burger, P. Bhattacharya, E. Tupitsyn, E. Rowe, V. M. Buliga, L. Trefilova, A. Gektin, G. A. Bizarri, W. W. Moses, and R. T. Williams, Physical Review B 87, 125117 (2013).
- Ucer et al. (2014) K. B. Ucer, G. Bizarri, A. Burger, A. Gektin, L. Trefilova, and R. T. Williams, Phys. Rev. B 89, 165112 (2014).
- Åberg et al. (2008) D. Åberg, P. Erhart, A. J. Williamson, and V. Lordi, Phys. Rev. B 77, 165206 (2008).
- Qian et al. (1988) G.-X. Qian, R. M. Martin, and D. J. Chadi, Phys. Rev. B 38, 7649 (1988).
- Komsa et al. (2012) H.-P. Komsa, T. T. Rantala, and A. Pasquarello, Phys. Rev. B 86, 045112 (2012).
- Castleton and Mirbt (2004) C. W. M. Castleton and S. Mirbt, Phys. Rev. B 70, 195202 (2004).
- Makov and Payne (1995) G. Makov and M. C. Payne, Phys. Rev. B 51, 4014 (1995).