Study of systematic errors on the scalar boson mass
1 Introduction
In this talk I presented studies of the scalar boson mass resolution at the LHC. I described in detail the limiting factors on resolution, the methods used to determine the mass resolution, and the statistical sample size required for these results for the and final states. I finished the talk by comparing projections for various linear collider scenarios.
2 Physics at the LHC
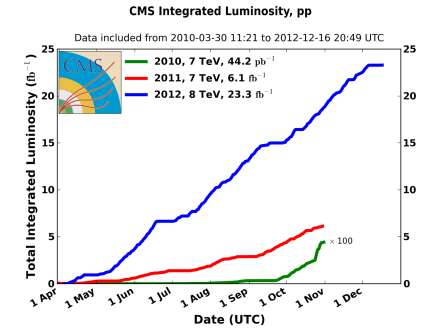
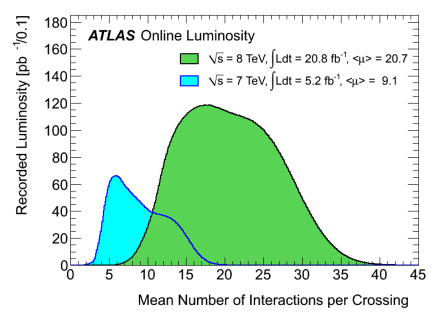
The LHC is located at CERN, Geneva, Switzerland. The LHC is a circular accelerator consisting of two counter rotating beams, capable of accelerating protons and lead ions up to energies of per proton and per nucleon. The proton-proton beam conditions at the LHC are shown in table 1. Due to the nature of the beams at the LHC the detector environment is different when compared to one at a linear collider.
| Parameters | Design | |||
|---|---|---|---|---|
| Beam energy () | ||||
| Particles per bunch () | ||||
| Number of bunches | ||||
| Bunch spacing () | ||||
| Interactions per crossing () | ||||
| Peak luminosity () |
 |
 |
The ATLAS [5] and CMS [6] detectors are two general purpose detectors located on the LHC ring. Each consists of several subdetectors, including an inner tracking system which is used to reconstruct tracks left by charged particles. Each detector also contains an electromagnetic calorimeter which is used to reconstruct electrons and photons, and an hadronic calorimeter which is used to reconstruct hadronic jets. The outer sections of the detectors consist of various muon systems, which are used to reconstruct muon trajectories. The CMS detector has a superconducting solenoid magnet which surrounds the inner tracking system and calorimeters, with a return yoke in the outer detector. The ATLAS detector has a superconducting solenoid magnet which surrounds the inner tracking system, and toroidal magnets in the outer detector.
At the LHC, the scalar boson can be mainly produced via four production modes: gluon-gluon fusion, vector boson fusion, associated production, and associated production. The dominant decay modes are , , , however these all have poor mass resolution. The rare decay modes and give fine mass resolution, whereas the modes and are not yet accessible at the LHC due to large backgrounds and small branching fractions. The scalar boson linewidth is not directly accessible at the LHC.
3 final state
The decay , known as the “golden mode”, has very fine mass resolution. The mass measurements for ATLAS and CMS are presented in table 7. The systematic uncertainties are dominated by lepton energy and momentum scale uncertainties, so dedicated studies are performed using narrow resonances to estimate these uncertainties.
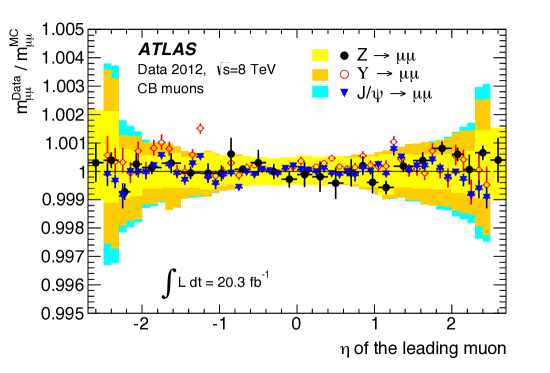
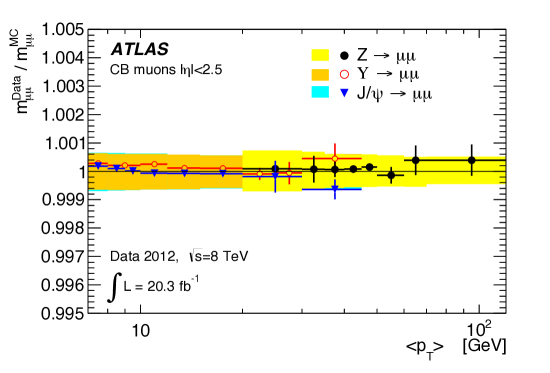
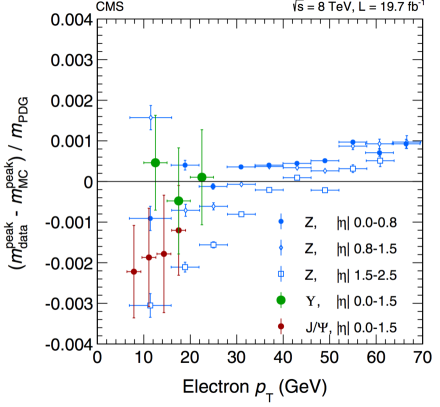
The ATLAS collaboration performs a study using the and resonances for muon calibration. The Monte Carlo simulation (MC) is smeared and scaled to match the data, binning in pseudorapidity () and transverse momentum () of the muons. Muons are split into three categories according to which detector subsystems are used in reconstructions. The momentum scale uncertainties are ( overall) for inner detector muons, for outer detector muons, and (barrel) for combined muons. The ratios of reconstructed dimuon invariant masses in data to the corrected masses in simulation for various resonances for the ATLAS muon calibration are shown in figure 2.
 |
 |
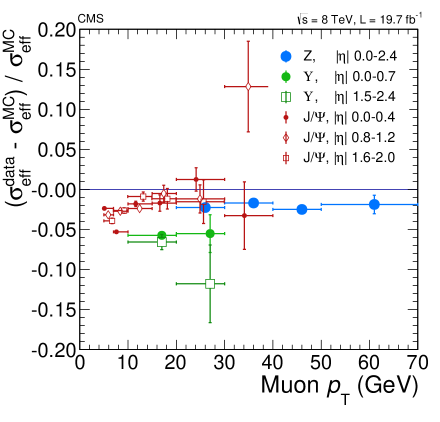
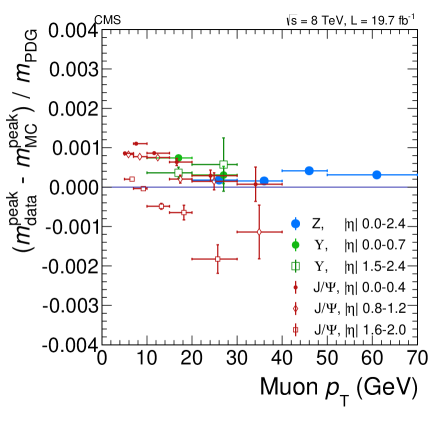
The CMS collaboration performs a study using the , , and resonances for muon calibration. MC is smeared and scaled to match the data at the resonance using a lineshape convoluted with a Gaussian function. Momentum scale and resolution measurements are made using biases which are determined using shifts in the position of the peak. Events are fitted to the , , and resonances, averaging over and . The uncertainty in the peak position is and the uncertainty in the peak width is . The resolution uncertainties for muons, and shift in peak position are shown in figure 3.
 |
 |
For both experiments the typical momentum scale uncertainty is of the order of or better per muon. The momentum scale uncertainty measurements use all of the LHC Run I datasets, and are statistically limited. The uncertainties and sample sizes are shown in table 2.
| ATLAS | CMS | |
| Momentum scale uncertainty | - | |
| Mass uncertainty | - | in final state |
| Number of events | ||
| Number of events | ||
| Number of events |
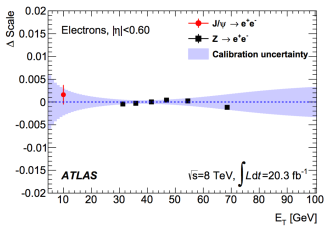
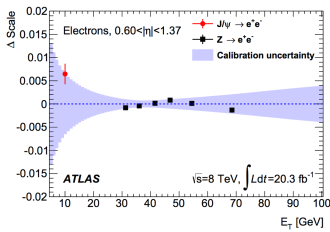
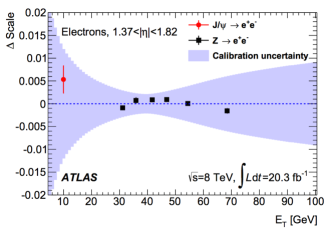
The ATLAS collaboration performs a study using the and resonances for electron calibration. Electron candidates are first calibrated using a multivariate discriminant using MC samples. The material budget of the detector is taken into account by measuring the energy depositions of the first and second layers of the electromagnetic calorimeter. Uniformity corrections are applied to take variations with respect to azimuthal angle, time, and pileup into account. Longitudinal scale variations are taken into account in data, and then data and MC are compared to obtain MC based calibrations. The peak is used to calibrate the energy scale in data, and the transverse energy, , in MC. These calibrated electrons are validated using and samples. The relative scale differences for electrons for different ranges are shown in figure 4. The electron energy scale uncertainties at two points are shown in table 3.
 |
 |
 |
| () | |||
|---|---|---|---|
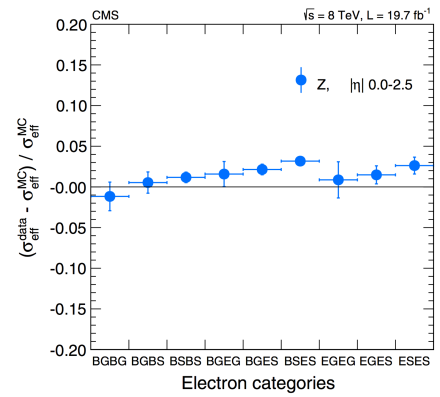
The CMS collaboration performs a study using the , , and resonances for electron calibration. Electron momentum scale corrections are determined using the difference in the peak position between data and MC. Time dependence is implicit in the corrections, to take the transparency losses of the crystals into account. The transverse momentum dependence is taken into account using linearity corrections, using and resonances to validate the region. Energies of single electrons are then smeared with a Gaussian function with a width of , where is the difference in resolution between data and MC. Events are categorised according to the and , and fitted to mass peaks of the , , and resonances. The systematic uncertainties of the peak position are for the final state, and for the final state, and the systematic uncertainty of the peak width is . The efficiency uncertainties for different electron categories, and shift in peak position are shown in figure 5.
 |
 |
For both experiments the typical momentum scale uncertainty is approximately or better per electron. The momentum scale uncertainty measurements use all of the LHC Run I datasets, and are statistically limited. The uncertainties and sample sizes are shown in table 4.
| ATLAS | CMS | |
| Momentum scale uncertainty | - | |
| Mass uncertainty | - | in final state |
| - | in final state | |
| Number of events | ||
| Number of events | ||
| Number of events | - | |
| Number of events | - |
Due to the low branching fraction there are very few signal events in the final state. As a result the mass variations between events is significant and the mass resolution can be improved by taking per-event mass uncertainties into account. Both ATLAS and CMS use per event mass uncertainties, using likelihoods of the form , where is the per event mass uncertainty estimation. Nuisance parameters are fixed to their best-fit values, and the likelihood analysis is performed a second time.
The mass resolution is much larger than the predicted width of the scalar boson ( as ), so indirect measurements of the width have been developed. Comparing on-shell and off-shell contributions to the processes allows ATLAS and CMS to obtain indirect limits of [10] and [11] respectively, approximately an order of magnitude lower than the mass resolution. The dominant uncertainties on the width estimation are related to the interference of and , and are of the order of .
4 final state
The decay has large statistics for a boson mass in the region , however the standard model backgrounds are very large in this region. For both ATLAS and CMS the detector response can be calibrated using (and for ATLAS) events. Further sensitivity is gained by categorising the events based on the properties of the photons. The mass measurements for ATLAS and CMS are shown in table 7.
The response of the detectors to photons are very similar to those of electrons. As a result the methods used to calibrate photons are very similar to those used to calibrate electrons. The mass uncertainty in the measurement for ATLAS is dominated by photon energy scale uncertainties. The uncertainties are summarised in table 5.
| Source of | Unconverted | Converted |
|---|---|---|
| uncertainty | photons | photons |
| calibration | ||
| Calorimeter cell non-linearty | ||
| Layer calibration | ||
| Identification material | ||
| Other material | ||
| Conversion reconstruction | ||
| Lateral shower shape | ||
| Total |
For CMS the mass uncertainties in the final state are dominated by differences between electron and photon reconstruction, linearity of the energy scales, and energy scale calibration and resolution. These, and other uncertainties, are shown in table 6.
| Source of uncertainty | Uncertainty () |
|---|---|
| Electron-photon differences | |
| Linearity of the energy scale | |
| Energy scale calibration and resolution | |
| Other contributions | |
| Total |
5 Mass combinations
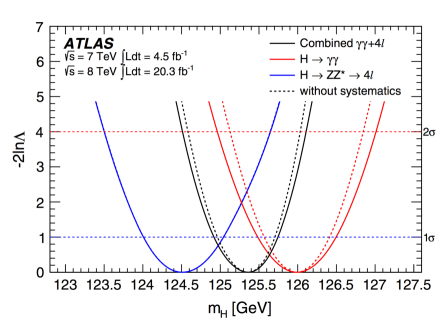
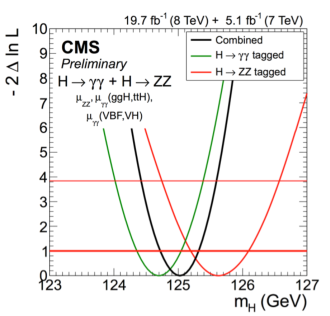
Combining the mass measurements from the and final states gives a good cross check of these measurements, which are within of each other. Correlations between the electron and photon energy scales are taken into account when the combinations are performed. The combinations for ATLAS and CMS are shown in table 7, and the likelihood scans are shown in figure 6. The statistical uncertainties are larger than the systematic uncertainties.
| ATLAS | CMS | |
|---|---|---|
| (stat) (syst) | (stat) (syst) | |
| (stat) (syst) | (stat) (syst) | |
| Combination | (stat) (syst) | (stat) (syst) |
6 Future prospects
Future prospects for the LHC and various linear colliders were presented at the Snowmass 2013 meeting [14]. Benchmarks projections are given for , . Mass measurement uncertainties at the LHC will be dominated by lepton and photon energy and momentum scale uncertainties, which will decrease as statistics increase. Optimistic projections of mass resolution at are for , and for . (These values were presented at Snowmass 2013 and are not official ATLAS or CMS projections.)
In the final state there is a non-negligible shift in the mass peak, due to interference between standard model and . This shift is of order , depending upon the scalar boson width, and will become more significant as mass resolution in the final state improves.
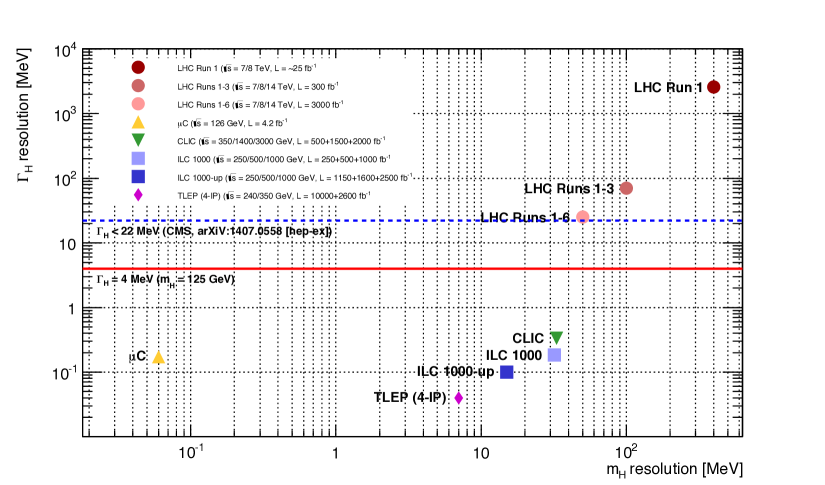
For colliders the scalar boson will be produced mainly via the process , which was the final state searched for at the LEP collider. For the colliders the lineshape of the scalar boson can be measured directly as it was for the boson at the LEP experiments. Future prospects for the linear colliders are shown in table 8, and the prospects of the mass resolution and width are shown in figure 7.
| Facility | ILC500 | ILC1000 | ILC1000-up | CLIC | TLEP (4IP) | C |
|---|---|---|---|---|---|---|
| uncertainty | ||||||
| uncertainty |
7 Conclusion
The ATLAS and CMS collaboration have measured the mass of the scalar boson with a resolution of less than . In both cases the conditions of the detector have been very challenging and studies have pushed the mass resolutions to the limit of what is currently achievable, limited by statistics. Systematic uncertainties on the scalar boson mass are limited by the lepton and photon energy and momentum scale factors. It is expected that the resolution will improve to with an integrated luminosity of at the LHC. With events per resonance the expected momentum scale factor uncertainties are of the order of per object, or better. Further improvements in mass resolution will require a high energy lepton collider.
References
- [1] O. Bruning, et al. LHC Design Report, CERN-2004-003-V-1 (2004)
- [2] M. Lamont, Status of the LHC, J. Phys. Conf. Ser. 455 012001 (2013)
- [3] CMS Collaboration, CMS Luminosity Based on Pixel Cluster Counting - Summer 2013 Update. CMS-PAS-LUM-13-001 (2013)
- [4] ATLAS Collaboration, Improved luminosity determination in collisions at using the ATLAS detector at the LHC. arXiv:1302.4393 [hep-ex] (2013)
- [5] ATLAS Collaboration, The ATLAS Experiment at the CERN Large Hadron Collider, JInst 3 S08003 (2008)
- [6] CMS Collaboration, The CMS Experiment at the CERN Large Hadron Collider, JInst 3 S08004 (2008)
- [7] ATLAS Collaboration, Electron and photon energy calibration with the ATLAS detector using LHC Run 1 data. Eur. Phys. J. C 74:3071 (2014)
- [8] CMS Collaboration, Measurement of the properties of a Higgs boson in the four-lepton final state. Phys. Rev. D 89, 092007 (2014)
- [9] ATLAS Collaboration, Measurement of the Higgs boson mass from the and channels in collisions at center-of-mass energies of and with the ATLAS detector, Phys. Rev. D 90, 052004 (2014)
- [10] ATLAS Collaboration, International Conference on High Energy Physics, Valencia, Spain Determination of the off-shell Higgs boson signal strength in the high-mass final state with the ATLAS detector. ATLAS-CONF-2014-042
- [11] CMS Collaboration, Constraints on the Higgs boson width from off-shell production and decay to -boson pairs. Phys. Lett. B 736 64 (2014)
- [12] CMS Collaboration, Observation of the diphoton decay of the Higgs boson and measurement of its properties. Eur. Phys. J. C 74 3076 (2014)
- [13] CMS Collaboration, Precise determination of the mass of the Higgs boson and studies of the compatibility of its couplings with the standard model. CMS-PAS-HIG-14-009, http://cds.cern.ch/record/1728249
- [14] S. Dawson, et al., Higgs Working Group Report of the Snowmass 2013 Community Planning Study, arXiv:1310.8361 [hep-ex]