Robustness of the Baryon-Stopping Signal for the Onset of Deconfinement in Relativistic Heavy-Ion Collisions
Abstract
The impact of the experimental acceptance, i.e. transverse-momentum () cut-off and limited rapidity region, on the earlier predicted irregularity in the excitation function of the baryon stopping is studied. This irregularity is a consequence of the onset of deconfinement occurring in the compression stage of a nuclear collision and manifests itself as a wiggle in the excitation function of the reduced curvature () of the net-proton rapidity distribution at midrapidity. It is demonstrated that the wiggle is a very robust signal of a first-order phase transition that survives even under conditions of a very limited acceptance. At the same time the for pure hadronic and crossover transition scenarios become hardly distinguishable, if the acceptance cuts off too much of the low- proton spectrum and/or puts too narrow rapidity window around midrapidity. It is found that the shape of the net-proton rapidity distribution near midrapidity depends on the cut-off. This implies that the measurements should be taken at the same acceptance for all collision energies in order to reliably conclude on the presence or absence of the irregularity.
pacs:
25.75.-q, 25.75.Nq, 24.10.NzI Introduction
The onset of deconfinement in relativistic heavy-ion collisions is now in the focus of theoretical and experimental studies of the equation of state (EoS) and the phase diagram of strongly interacting matter. This problem is one of the main motivations for the currently running beam-energy scan RHIC-scan at the Relativistic Heavy-Ion Collider (RHIC) at Brookhaven National Laboratory (BNL) and the low-energy-scan program SPS-scan at Super Proton Synchrotron (SPS) of the European Organization for Nuclear Research (CERN) as well as for constructing the Facility for Antiproton and Ion Research (FAIR) in Darmstadt FAIR and the Nuclotron-based Ion Collider Facility (NICA) in Dubna NICA .
In Refs. Ivanov:2010cu ; Ivanov:2011cb ; Ivanov:2012bh ; Ivanov:2013wha it was argued that the baryon stopping in nuclear collision can be a sensitive probe for the onset of deconfinement. Rapidity distributions of net-protons were calculated Ivanov:2012bh ; Ivanov:2013wha within a model of the three-fluid dynamics (3FD) 3FD in scenarios with and without deconfinement transition. These calculations were performed employing three different types of EoS: a purely hadronic EoS gasEOS (hadr. EoS) and two versions of the EoS involving deconfinement Toneev06 . The latter two versions are an EoS with a first-order phase transition (2-phase EoS) and one with a smooth crossover transition (crossover EoS).
It was found that 3FD predictions within the first-order-transition scenario exhibit a “peak-dip-peak-dip” irregularity in the incident energy dependence of the form of the net-proton rapidity distributions in central collisions. At low energies, rapidity distributions have a peak at the midrapidity. With the incident energy rise it transforms into a dip, then again into a peak, and with further rising energy the midrapidity peak again changes into a dip, which already survives up to arbitrary high energies. The behaviour of the type “peak-dip-peak-dip” in central collisions within the 2-phase-EoS scenario is very robust with respect to variations of the model parameters in a wide range. This behaviour is in contrast with that for the hadronic-EoS scenario, where the form of distribution at midrapidity gradually evolves from one with a peak to one with a dip. The case of the crossover EoS is intermediate. Only a weak wiggle of the type of “peak-dip-peak-dip” takes place.
Experimental data also reveal a trend of the “peak-dip-peak-dip” irregularity in the energy range 8 GeV 40 GeV, which is qualitatively similar to that in the first-order-transition scenario while quantitatively it differs. It is very likely that the quantitative discrepancy is due to the inadequacy of the model for the 2-phase EoS for which the onset of the phase transition lies at rather high densities, above 8 times saturation density at low temperatures. Recent models suggest an onset density of half that value Steinheimer:2012gc ; Steinheimer:2013gla ; Steinheimer:2013xxa which would place the onset of the wiggle structure closer to the experimentally indicated position. However, the experimental trend is based on preliminary data at energies of 20 GeV and 30 GeV. Therefore, updated experimental results at energies 20 and 30 GeV are badly needed to pin down the preferable EoS and to check the hint to the wiggle behavior of the type “peak-dip-peak-dip” in the net-proton rapidity distributions. Moreover, it would be highly desirable if data in this energy range were taken within the same experimental setup and with the same experimental acceptance.
The calculations of Refs. Ivanov:2012bh ; Ivanov:2013wha were performed assuming the acceptance for net-protons to be wide enough to include almost all emitted particles. In practice, the extension of the acceptance beyond the range of GeV/c does not practically change the net-proton rapidity distributions in the incident-energy range of interest. However, the actual experimental acceptance can be narrower. For the NICA MPD experiment it is restricted by the proton identification capabilities in the TOF detector to in the central rapidity range Merz:2012 . For the case of the STAR beam energy scan the analysis of the excitation function of the net proton rapidity distribution is still under way. In this case the acceptance will be restricted to the range and NuXu:2015 .
The purpose of the present paper is to investigate the question whether the “peak-dip-peak-dip” irregularity survives when experimental circumstances force a narrowing of the accessible acceptance region.
II Equations of State
Figure 1 illustrates the differences between the three considered EoS. The deconfinement transition makes an EoS softer at high temperatures and/or densities. The 2-phase EoS is based on the Gibbs construction, taking into account simultaneous conservation of baryon and strange charges. However, the displayed result looks very similar to the Maxwell construction, corresponding to the conservation of just the baryon charge, with the only difference that the plateau is slightly tilted, which is practically invisible.
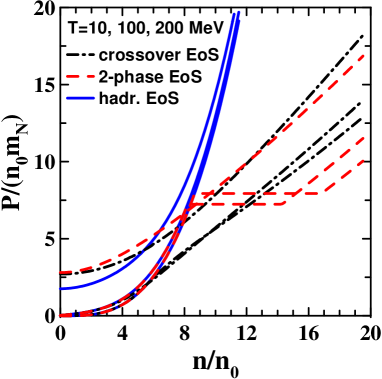
As demonstrated in Refs. Ivanov:2012bh ; Ivanov:2013wha , the deconfinement transition in central Au+Au collisions starts at the top AGS energies in both cases. It gets practically completed at low SPS energies in the case of the 2-phase EoS. In the crossover scenario it lasts till very high incident energies. We would like to note that the density range for the 2-phase EoS in Fig. 1 with an onset of deconfinement above is rather high. In recent models for the spinodal decomposition accompanying the phase transition Steinheimer:2012gc ; Steinheimer:2013gla ; Steinheimer:2013xxa the onset of the phase coexistence is at about . This corresponds to a lower limit for the onset of the deconfinement phase transition in cold, symmetric nuclear matter which was obtained by a hybrid EoS model from constraints on the occurrence of quark matter phases in massive neutron stars Klahn:2013kga , see also Klahn:2011au .
III Irregularity at constrained acceptance
The calculations at all collision energies were performed for Au+Au ( 2 fm) central collisions despite the fact that some experimental data were taken for central Pb+Pb collisions. This was done in order to avoid uncertainties associated with different colliding nuclei. However, in fact at the same incident energy the computed results for Pb+Pb collisions at fm are very close to those for Au+Au at fm. The calculations were performed for four different acceptance ranges for the transverse momentum () and rapidity () of the measured proton:
-
i.
GeV/c and a very unrestrictive constraint to the rapidity range , where is the beam rapidity in the collider mode, which is practically equivalent to the full acceptance;
-
ii.
GeV/c and , the expected MPD acceptance Merz:2012 ;
-
iii.
GeV/c and , an acceptance range where low-momentum particles witnessing collective behaviour are largely eliminated;
-
iv.
GeV/c and , the range of the STAR acceptance NuXu:2015 .
We separately study effects of the and constraints in order to reveal their relative importance.
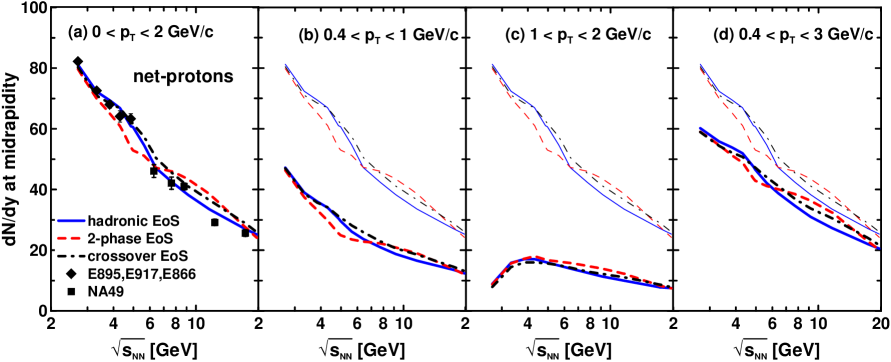
A direct measure of the baryon stopping is the net-baryon (i.e. baryons-minus-antibaryons) rapidity distribution. However, since experimental information on neutrons is unavailable, we have to rely on net-proton (i.e. proton-minus-antiproton) data. Presently there exist experimental data on proton (or net-proton) rapidity spectra at AGS E895 ; E877 ; E917 ; E866 and SPS NA49-1 ; NA49-04 ; NA49-06 ; NA49-07 ; NA49-09 energies. At AGS energies, the yield of antiprotons is negligible, therefore the proton rapidity spectra serve as a good probe of the baryon stopping.
In order to quantify the above-discussed “peak-dip-peak-dip” irregularity, it is useful to make use of the method proposed in Ref. Ivanov:2010cu . For this purpose the data on the net-proton rapidity distributions are fitted by a simple formula
| (2) | |||||
where , and are parameters of the fit. The form (2) is a sum of two thermal sources shifted by from the midrapidity which is put to be as it is in the collider mode. The width of the sources can be interpreted as (temperature)/(transverse mass), if we assume that collective velocities in the sources have no spread with respect to the source rapidities . The parameters of the two sources are identical (up to the sign of ) because only collisions of identical nuclei are considered.
The above fit has been prepared using the least-squares method and applied to both, available data and results of calculations. The fit was performed in the rapidity range , where is the beam rapidity in the collider mode. The choice of this range is dictated by the data. As a rule, the data are available in this rapidity range, sometimes the data range is even more narrow (80 GeV and new data at 158 GeV NA49-09 ). We apply the above restriction in order to deal with different data in approximately the same rapidity range. Another reason for this cut is that the rapidity range should not be too wide in order to exclude contributions of cold spectators. The fit in the rapidity range has been also done in order to estimate uncertainty of the fit parameters associated with the choice of fit range. An additional set of fits has been done under the constraint . This fit was applied only to the 3FD simulation results. Due to low number of experimental points within the range and their insufficient accuracy such a fit gives too large error bars for the deduced parameters of the fit (2) at 5 GeV, whereas it is practically identical to the fit at 5 GeV.
A useful quantity, which characterizes the shape of the rapidity distribution, is a reduced curvature of the spectrum at midrapidity defined as follows
| (3) | |||||
| (4) |
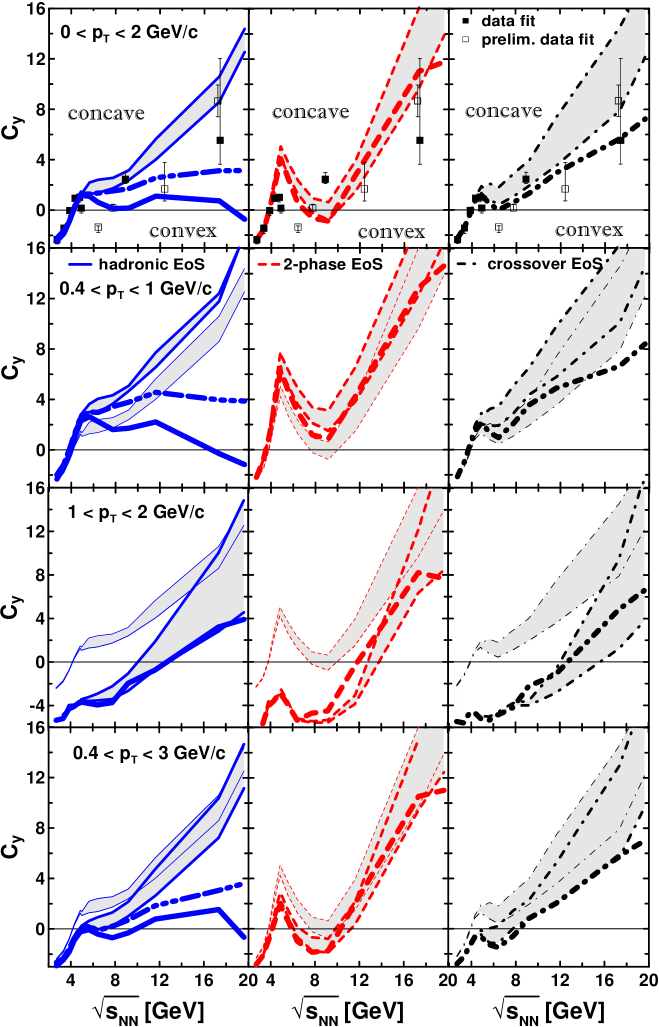
The factor is introduced in order to cancel out the overall normalization of the spectrum. The second part of Eq. (3) presents this curvature in terms of the parameters of the fit (2). The reduced curvature, , and the midrapidity value, , are two independent quantities quantifying the the spectrum in the midrapidity range. Excitation functions of these quantities deduced both from experimental data and from results of the 3FD calculations with different EoS’s are displayed in Figs. 2 and 3.
In Fig. 2 the midrapidity values of the rapidity spectra were taken directly from experimental data and calculated results. Therefore, only experimental error bars are displayed there. The uncertainty associated with the choice of the rapidity range turned out to be the dominant one for the quantities deduced from both experimental data and simulation results. Therefore, in Fig. 3 results for the curvature in the wide rapidity range are presented by shaded areas with borders corresponding to the fit ranges and . The results in the narrow rapidity range , corresponding to the MPD and STAR acceptance, are also displayed by bold lines. In order to control the error induced by the narrow range , the calculations were also performed in the range . In most cases the () and () results turned out to be very close to each other. In those few cases, when () and () results substantially differ, the () results are also displayed in Fig. 3. All presently available experimental data shown in the leftmost panel of Fig. 2 and in the top panels of Fig. 3 approximately correspond to acceptance range (i).
As seen from Fig. 2, approximately 60% (for different collision energies and EoS’s) of the protons produced at midrapidity will be covered by the MPD acceptance window, while the corresponding coverage of the STAR acceptance is 80%.
The irregularity in the data is distinctly seen as a strong wiggle in the excitation function of , see Fig. 3. Various data used to deduce approximately correspond to the wide acceptance window (i). Of course, this is only a hint to an irregularity since this wiggle is formed only by preliminary data of the NA49 collaboration. In the wide acceptance window (i) (shaded bands in the upper raw of panels in Fig. 3) the excitation function in the first-order-transition scenario manifests qualitatively (though not quantitatively) the same wiggle irregularity (middle-column upper-raw panel in Fig. 3) like that in the data fit, while the hadronic scenario produces purely monotonous behavior. The crossover EoS represents a very smooth transition. Therefore, it is not surprising that it produces only a weak wiggle in .
The application of various cuts without confining the rapidity range (shaded bands in Fig. 3) does not qualitatively change the picture. As seen from Fig. 3, the wiggle in the energy dependence of is a very robust signal of the first-order phase transition. It survives even at very limited -acceptance. The important difference between different -acceptances is that the wiggle is completely located in the range of positive curvatures (concave shapes of the rapidity distribution near midrapidity) at low- acceptance, like the MPD one (ii). While for the high- acceptance (iii), the wiggle entirely lies in the range of negative (convex shape). Therefore, the name of ”peak-dip-peak-dip” for this irregularity becomes not quite correct. The amplitude of the wiggle becomes somewhat weaker when the cut-off from below is too strong, e.g., when GeV/c. It is expectable because the wiggle is an effect of collective behaviour of the system, in which predominantly low-momentum particles participate. If these low-momentum particles are cut off by the acceptance, the collective effects, in particular, the wiggle, become less manifested.
The excitation functions for hadronic and crossover scenarios are very similar to each other already in the wide acceptance window (i) (the upper raw of panels in Fig. 3). The crossover scenario results in a very weak wiggle in . Under the MPD (ii) and STAR (iv) cuts the basic features of the excitation functions remain the same, only the weak crossover wiggle turns out to be shifted to the range of higher (the MPD case) or lower (the STAR case) . At the high- cut (iii) the qualitative difference between predictions of the hadronic and crossover scenarios is practically washed out. This a consequence of the above-mentioned lack of collectivity in the behavior of the high-momentum particles.
The actual MPD (ii) and STAR (iv) acceptance conditions also include the restriction . Applying this restriction in addition to the cuts leads to the corresponding bold lines in Fig. 3. In order to study how restrictive the condition is, calculations were also done for the rapidity window . In most cases the results for the range practically coincide with those in the window and are quite close to those in the wide rapidity window . In these cases the results are not displayed in Fig. 3. In a few cases the and results considerably differ. These cases correspond to the hadronic EoS when low- protons are included in the analysis. For these cases the results are displayed by bold double-dash-dash-triple-dotted lines in Fig. 3 (contrary to solid bold lines for the results).
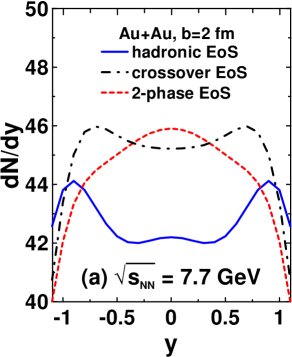
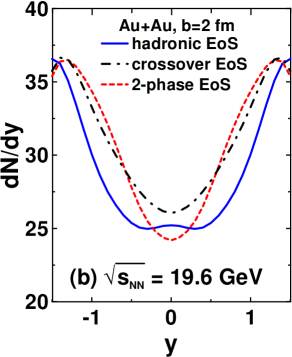
As seen from Fig. 3, under the constraints of the MPD (ii) and STAR (iv) acceptance conditions the wiggle in the energy dependence of is very robust for the first-order phase transition and the crossover one. However, this is not the case for the hadronic EoS. The hadronic-EoS excitation functions now exhibit a local weak wiggle in the region 8 12 GeV (in all cases except for that with the high- range GeV/c) qualitatively similar to that for the crossover transition. Moreover, the curvature becomes negative at 19.6 GeV (again in all cases except for that with the high- range). These peculiarities are consequences of a fine structure of the rapidity distribution near midrapidity that becomes dominant in the narrow rapidity window . This situation is illustrated in Fig. 4. It is seen that at 7.7 and 19.6 GeV there are tiny maxima at the midrapidity in the hadronic-EoS rapidity distributions, which result in the weak wiggle and negative curvature, respectively, observed in Fig. 3. The global shape of the hadronic-EoS rapidity distributions does not exhibit such peculiarities, as it is clear from calculations in a wider rapidity range. For a comparison, see also Fig. 4 of Ref. Mitrovski:2008hb .
Therefore, we can conclude that under the conditions of the the MPD and STAR acceptance it is possible to distinguish the the first-order phase transition, the onset of which is signalled by a strong wiggle in the excitation function of . However, the difference between the purely hadronic case and that with the smooth crossover transition becomes ambiguous.
IV Conclusion
An irregularity in the baryon stopping is a natural consequence of deconfinement occurring in the compression stage of a nuclear collision. It is a combined effect of the softest point Hung:1994eq ; Steinheimer:2012bp of an EoS and a change in the nonequilibrium regime from hadronic to partonic one. As was demonstrated in Refs. Ivanov:2012bh ; Ivanov:2013wha , this irregularity manifests itself as a wiggle in the excitation function of a reduced curvature () of the net-proton rapidity distribution at midrapidity. These calculations were performed in the full acceptance range for protons. In the present paper we studied the effect of a restricted acceptance, in particular, the one expected for the NICA MPD experiment and the one of the STAR beam energy scan program, on the earlier predicted wiggle.
It was found that the wiggle in the excitation function of is a quite robust signal of the onset of deconfinement as a first-order phase transition. It survives even at very limited acceptance. Therefore, the MPD experiment will be suitable for the experimental investigation of this effect. It was also found that the shape of the net-proton rapidity distribution near the midrapidity depends on the experimental acceptance. Hence, only if the measurements are taken at the same acceptance for all collision energies we can reliably conclude on the presence or absence of the wiggle. Notice that this is not the case for the data analysed so far. These data were measured in four different experiments. Therefore, the question if the presently available data really indicate a wiggle in the excitation function is still open. It is the more so because some of the data in the region of the expected wiggle still have a preliminary status. Data in preparation by the STAR experiment will meet the requirement that the excitation function of the curvature shall be measured by one experiment and under same acceptance conditions since they stem from a collider experiment with an acceptance range widely independent of the beam energy. These data, however, come from the energy range above GeV, while the wiggle is expected in the range between and GeV. Therefore, systematic measurements with the NICA MPD collider experiment in the whole energy range of interest would be highly desirable to clarify this problem.
It is important to emphasize that the discussed irregularity is a signal from the hot and dense stage of the nuclear collision. It is formed at the (nonequilibrium) compression stage of the collision, as it was argued in Refs. Ivanov:2012bh ; Ivanov:2013wha . Therefore, a theoretical approach should be able to treat differences in the models for the EoS (in particular, absence or presence of a first-order deconfinement transition) already at this early nonequilibrium compression stage of the collision. The 3FD model does it by means of the three-fluid interactions. This, at least, makes the baryon stopping EoS dependent. At the same time, a hybrid fluid model does not distinguish different EoS models at the early collision stage because the initial state for the hydrodynamical evolution is prepared by means of the same hadronic kinetic model for any EoS. Hence, the hybrid fluid model mainly reveals the baryon stopping inherent in the hadronic kinetic model and cannot produce an irregularity of this stopping relevant to the hydrodynamical EoS. Here the situation is similar to the case of the directed flow that is also predominantly formed at the early nonequilibrium stage of the collision (see discussion in Ref. Ivanov:2014ioa ).
Acknowledgements.
We are grateful to A.S. Khvorostukhin, V.V. Skokov, and V.D. Toneev for providing us with the tabulated 2-phase and crossover EoS’s. Our thanks go to O. Rogachevsky and V. Voronyuk for information about the acceptance range of the TOF detector in the NICA MPD experiment and to Nu Xu for the case of the STAR experiment. D.B. acknowledges discussions with M. Bleicher, Y. Karpenko, H. Petersen and J. Steinheimer during his stay at FIAS Frankfurt. The calculations were performed at the computer cluster of GSI (Darmstadt). Y.B.I. received partial support from the Russian Ministry of Science and Education grant NS-932.2014.2, the work of D.B. was supported in part by the Polish NCN under grant UMO-2011/02/A/ST2/00306 and by the Hessian LOEWE initiative through HIC for FAIR.References
- (1) G. S. F. Stephans, J. Phys. G 32, S447 (2006) [nucl-ex/0607030].
- (2) P. Seyboth [NA49 Collaboration], Addedndum-1 to the NA49 Proposal, CERNSPSC- 97-26; M. Gazdzicki, nucl-th/9701050; M. Gazdzicki et al. [NA61/SHINE Collaboration], PoS C POD2006, 016 (2006).
- (3) B. Friman, (ed.), C. Hohne, (ed.), J. Knoll, (ed.), S. Leupold, (ed.), J. Randrup, (ed.), R. Rapp, (ed.) and P. Senger, (ed.), Lect. Notes Phys. 814, 1 (2011).
- (4) A. N. Sissakian, A. S. Sorin and V. D. Toneev, Conf. Proc. C 060726, 421 (2006) [nucl-th/0608032].
- (5) Yu. B. Ivanov, Phys. Lett. B 690, 358 (2010) [arXiv:1001.0670 [nucl-th]].
- (6) Yu. B. Ivanov, Phys. At. Nucl. 75 621 (2012) [1101.2092 [nucl-th]].
- (7) Yu. B. Ivanov, Phys. Lett. B 721, 123 (2013) [arXiv:1211.2579 [hep-ph]].
- (8) Yu. B. Ivanov, Phys. Rev. C 87, no. 6, 064904 (2013) [arXiv:1302.5766 [nucl-th]].
- (9) Yu. B. Ivanov, V. N. Russkikh, and V.D. Toneev, Phys. Rev. C 73, 044904 (2006) [nucl-th/0503088].
- (10) V. M. Galitsky and I. N. Mishustin, Sov. J. Nucl. Phys. 29, 181 (1979).
- (11) A. S. Khvorostukhin, V. V. Skokov, K. Redlich, and V. D. Toneev, Eur. Phys. J. C48, 531 (2006) [nucl-th/0605069].
- (12) J. Steinheimer and J. Randrup, Phys. Rev. Lett. 109, 212301 (2012) [arXiv:1209.2462 [nucl-th]].
- (13) J. Steinheimer and J. Randrup, Phys. Rev. C 87, no. 5, 054903 (2013) [arXiv:1302.2956 [nucl-th]].
- (14) J. Steinheimer, J. Randrup and V. Koch, Phys. Rev. C 89, no. 3, 034901 (2014) [arXiv:1311.0999 [nucl-th]].
- (15) T. Klähn, R. Łastowiecki and D. B. Blaschke, Phys. Rev. D 88, no. 8, 085001 (2013) [arXiv:1307.6996].
- (16) T. Klähn, D. Blaschke and F. Weber, Phys. Part. Nucl. Lett. 9, 484 (2012) [arXiv:1101.6061 [nucl-th]].
- (17) S. P. Merz, S. V. Rasin and O. V. Rogachevsky, talk at the Russian Academy of Sciences (2012); http://mpd.jinr.ru/data/presentations/ras/merts.pdf
- (18) N. Xu, private communication (2015).
- (19) J. L. Klay et al. [E-0895 Collaboration], Phys. Rev. C 68, 054905 (2003) [nucl-ex/0306033].
- (20) J. Barrette et al. (E877 Collab.), Phys. Rev. C 62, 024901 (2000).
- (21) B. B. Back et al., (E917 Collab.), Phys. Rev. Lett. 86 , 1970 (2001).
- (22) J. Stachel, Nucl. Phys. A654, 119c (1999) [nucl-ex/9903007].
- (23) H. Appelshäuser et al. (NA49 Collab.), Phys. Rev. Lett. 82, 2471 (1999).
- (24) T. Anticic et al. (NA49 Collab.), Phys. Rev. C 69, 024902 (2004).
- (25) C. Alt et al. (NA49 Collab.), Phys. Rev. C 73, 044910 (2006) [nucl-ex/0512033].
- (26) C. Blume (NA49 Collab.), J. Phys. G34, S951 (2007) [nucl-ex/0701042].
- (27) T. Anticic et al. [NA49 Collaboration], Phys. Rev. C 83, 014901 (2011) [arXiv:1009.1747 [nucl-ex]].
- (28) B. I. Abelev et al. [STAR Collab.], Phys. Rev. C 79, 034909 (2009) [arXiv:0808.2041 [nucl-ex]].
- (29) M. Mitrovski, T. Schuster, G. Graf, H. Petersen and M. Bleicher, Phys. Rev. C 79, 044901 (2009) [arXiv:0812.2041 [hep-ph]].
- (30) C. M. Hung and E. V. Shuryak, Phys. Rev. Lett. 75, 4003 (1995) [hep-ph/9412360].
- (31) J. Steinheimer and M. Bleicher, Eur. Phys. J. A 48, 100 (2012) [arXiv:1207.2792 [nucl-th]].
- (32) Y. B. Ivanov and A. A. Soldatov, Phys. Rev. C 91, no. 2, 024915 (2015) [arXiv:1412.1669 [nucl-th]].