Witnessing the Emergence of a Carbon Star
Abstract
During the late stages of their evolution, Sun-like stars bring the products of nuclear burning to the surface. Most of the carbon in the Universe is believed to originate from stars with masses up to a few solar masses. Although there is a chemical dichotomy between oxygen-rich and carbon-rich evolved stars, the dredge-up itself has never been directly observed. In the last three decades, however, a few stars have been shown to display both carbon- and oxygen-rich material in their circumstellar envelopes. Two models have been proposed to explain this dual chemistry: one postulates that a recent dredge-up of carbon produced by nucleosynthesis inside the star during the Asymptotic Giant Branch changed the surface chemistry of the star. The other model postulates that oxygen-rich material exists in stable keplerian rotation around the central star. The two models make contradictory, testable, predictions on the location of the oxygen-rich material, either located further from the star than the carbon-rich gas, or very close to the star in a stable disk. Using the Faint Object InfraRed CAmera (FORCAST) instrument on board the Stratospheric Observatory for Infrared Astronomy (SOFIA) Telescope, we obtained images of the carbon-rich planetary nebula (PN) BD +30∘ 3639 which trace both carbon-rich polycyclic aromatic hydrocarbons (PAHs) and oxygen-rich silicate dust. With the superior spectral coverage of SOFIA, and using a 3D photoionisation and dust radiative transfer model we prove that the O-rich material is distributed in a shell in the outer parts of the nebula, while the C-rich material is located in the inner parts of the nebula. These observations combined with the model, suggest a recent change in stellar surface composition for the double chemistry in this object. This is evidence for dredge-up occurring yr ago.
keywords:
circumstellar matter – infrared: stars.1 Introduction
Planetary Nebulae (PNe) are the final evolutionary phase of low- and intermediate-mass stars. The nebulae form out of the mass lost by the star on the asymptotic giant branch (AGB), which may exceed 50% of the stellar mass. The ejecta mainly consist of gas, initially molecular and atomic but becoming ionised by the remnant white dwarf star. Some solid particles (‘dust’) condense in the ejecta. The ejecta quickly disperses and merges with the surrounding interstellar medium. This recycled gas fuels most of the star formation in late-type galaxies (Leitner & Kravtsov, 2011).
The chemical evolution of the Universe is driven by products of nucleosynthesis included in stellar ejecta. Low-mass stars are the primary source of new dust in the Milky Way (Matsuura et al., 2009), and the dominant producers of carbon and nitrogen (Kobayashi et al., 2011; Henning & Salama, 1998).
Low- and intermediate-mass stars produce PNe with a distinct molecular and dust composition. In the molecular zone, the highly stable but volatile carbon monoxide (CO) molecule locks away the less abundant element, leaving the remaining free oxygen (O) or carbon (C) to drive the chemistry and dust formation. If C/O1 all the carbon is trapped in CO, and the chemistry forms oxides and silicate dust, with spectral signatures at 9.8, 18.0, 23.5, 27.5, and 33.8m. If C/O1 then carbon dominates the chemistry and the main observed dust features are amorphous carbon (no spectral feature), SiC, complex hydrocarbons, including polycyclic aromatic hydrocarbons (PAHs) (features centred at 6.2, 7.7, 8.6, and 11.3m), and fullerenes (Cami et al., 2010). Such a dichotomy between O- and C-rich PNe is observed. Stars begin their life with C/O1 and are thus oxygen-rich. In the AGB phase, the dredge-up of newly synthesised carbon during a phase of helium flashes can raise the C/O ratio above unity to form a carbon star. The details of this process are still very uncertain (Karakas, 2011; Karakas & Lattanzio, 2014).
A small fraction of PNe show both O- and C-rich features in their dust spectra, and are therefore classified as dual chemistry objects (Waters et al., 1998; Zijlstra et al., 1991; Waters et al., 1998; Cohen et al., 1999, 2002; Gutenkunst et al., 2008; Perea-Calderon et al., 2009; Guzman-Ramirez et al., 2011, 2014). Such objects can provide indirect evidence for dredge-up and allow the study of the environment in which it takes place. Two models have been proposed to explain this dual chemistry. One model requires oxygen-rich material to be present in an old and stable disk around the carbon-rich central star, and is not related to recent mass loss (Zijlstra et al., 1991). There is evidence for the existence of old, stable disks around post-AGB stars (de Ruyter et al., 2006). The other postulates that a recent dredge-up of carbon produced by nucleosynthesis changed the surface chemistry of the star (Waters et al., 1998). Finding objects in the process of changing from O-rich to C-rich chemistry has remained elusive (Zijlstra et al., 2004).
BD +30∘ 3639 (PNG 064.7+05.0) is one of the few planetary nebulae to host a Wolf-Rayet [WC] central stars. These objects show emission-line spectra similar to those of Population I Wolf-Rayet stars but have lower masses, expected for intermediate-mass stars in the post-AGB evolution (Leahy et al., 2000). Their spectra show strongly enhanced carbon and helium but have little or no hydrogen in the atmosphere. The central star of BD +30∘ 3639 (HD 184738) is a hydrogen-deficient, carbon-rich ([WC9]) star (Méndez, 1991) with an effective temperature of 55,000 K, a luminosity of 4.25103 L⊙, and a post-ejection mass of 0.6 M⊙ (Li et al., 2002). BD +30∘ 3639 is active in all spectral regions. While most of its energy is emitted in the mid-infrared (peaking at 30m), it is also a strong radio source (Zijlstra et al., 1989). It also has a molecular envelope with a mass of 0.016 M⊙ estimated from millimetre rotational lines of CO (Bachiller et al., 1991).
2 Observations
Using the Faint Object InfraRed CAmera (FORCAST) for the Stratospheric Observatory for Infrared Astronomy (SOFIA) Telescope (Adams et al., 2010) we obtained images of BD +30∘ 3639. The observations cover the wavelength ranges of both the PAHs and crystalline silicate features. SOFIA uniquely allows for the imaging of the long wavelength emission from crystalline silicate features at high angular resolution.
The FORCAST instrument has a short wavelength camera (SWC) that operates from 5-25m and a long wavelength camera (LWC) that operates from 25-40m, with several filters available in both cameras. FORCAST samples at 0.75′′/pixel, giving a 3.2 3.2′ instantaneous field-of-view. Five different filters were used: FOR_F064 (centred at 6.4m with a =0.14m), FOR_F077 (centred at 7.7m with a =0.47m), FOR_F111 (centred at 11.1m with a =0.95m), FOR_F113 (centred at 11.3m with a =0.24m), and FOR_F336 (centred at 33.6m with a =1.9m). We used the symmetric nod-match-chop (NMC) imaging mode, the chop is symmetric about the optical axis of the telescope with one of the two chop positions centred on the target. The nod throw is oriented 180∘ from the chop, such that when the telescope nods, the source is located in the opposite chop position.
3 Results
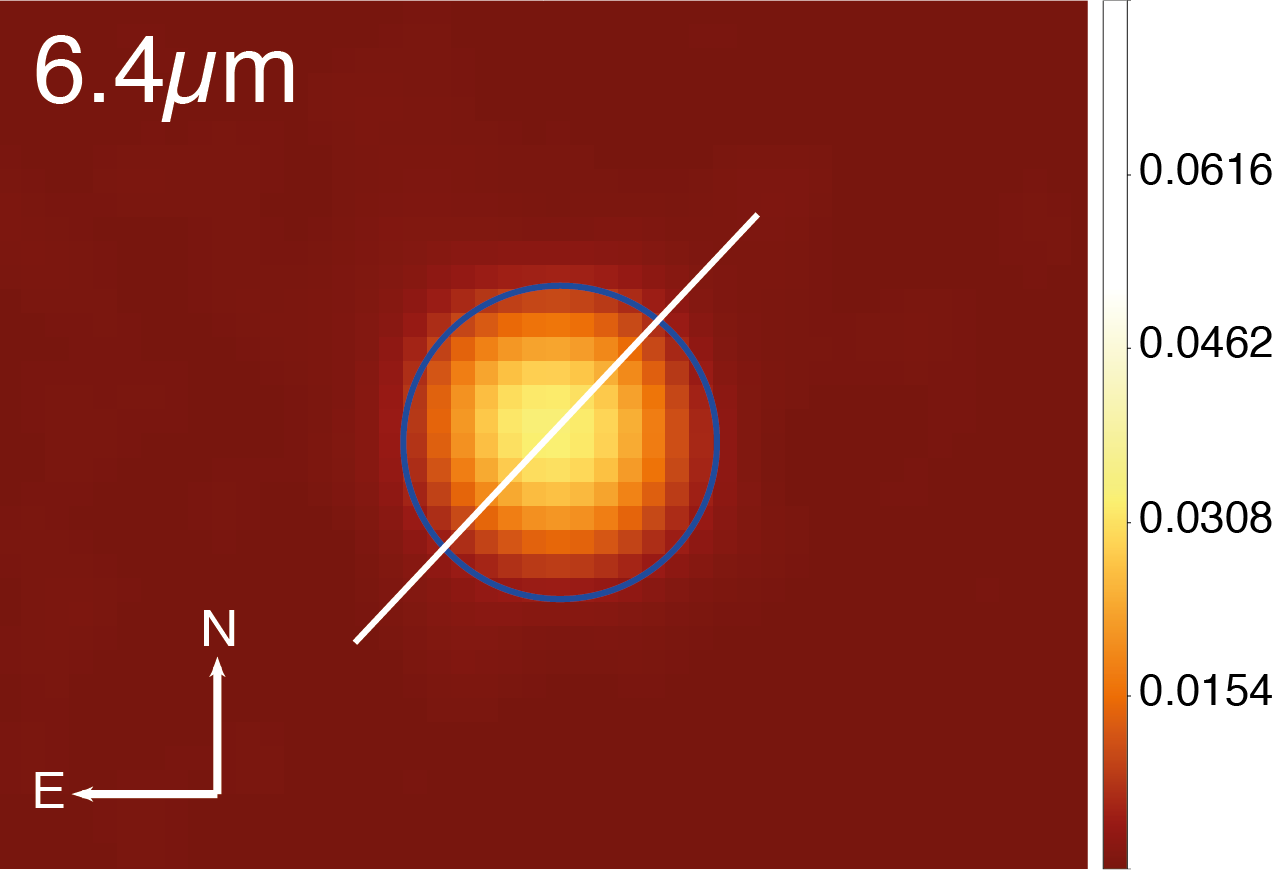
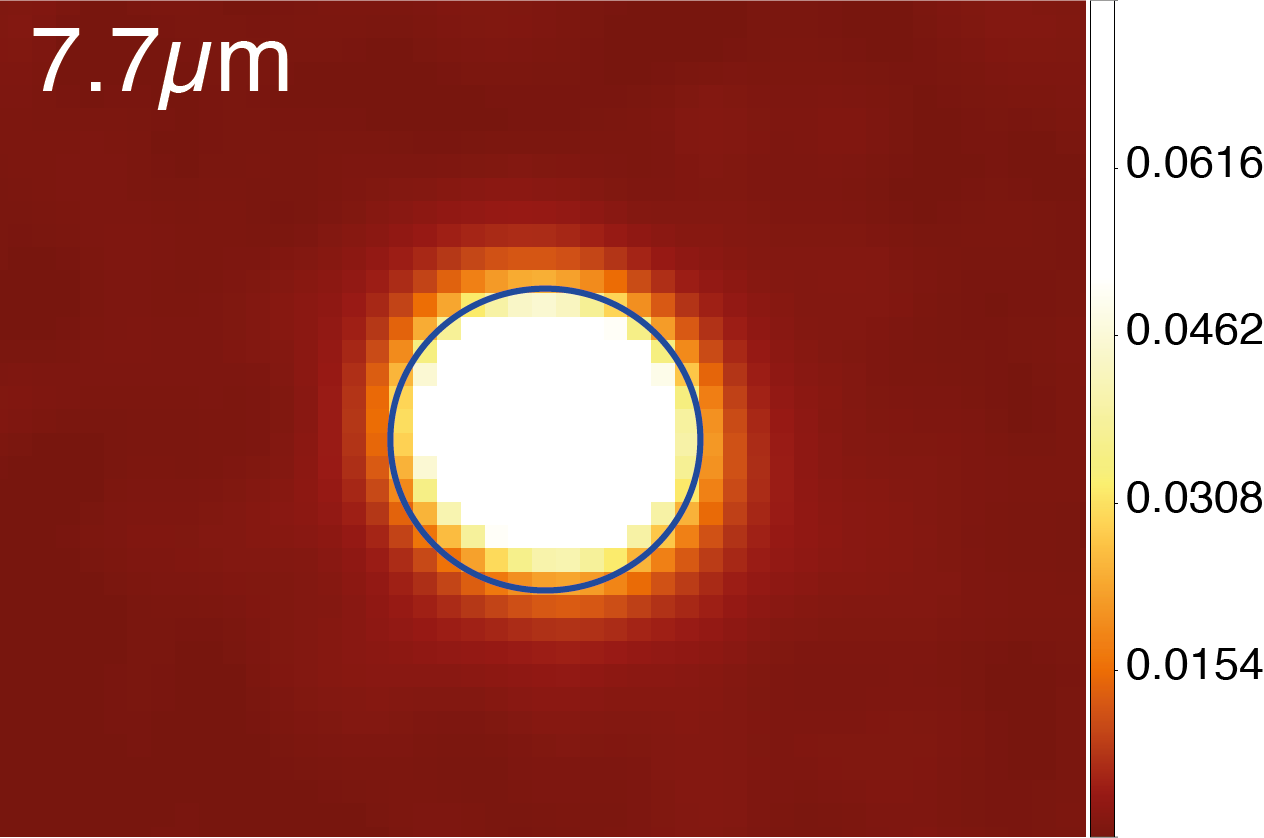
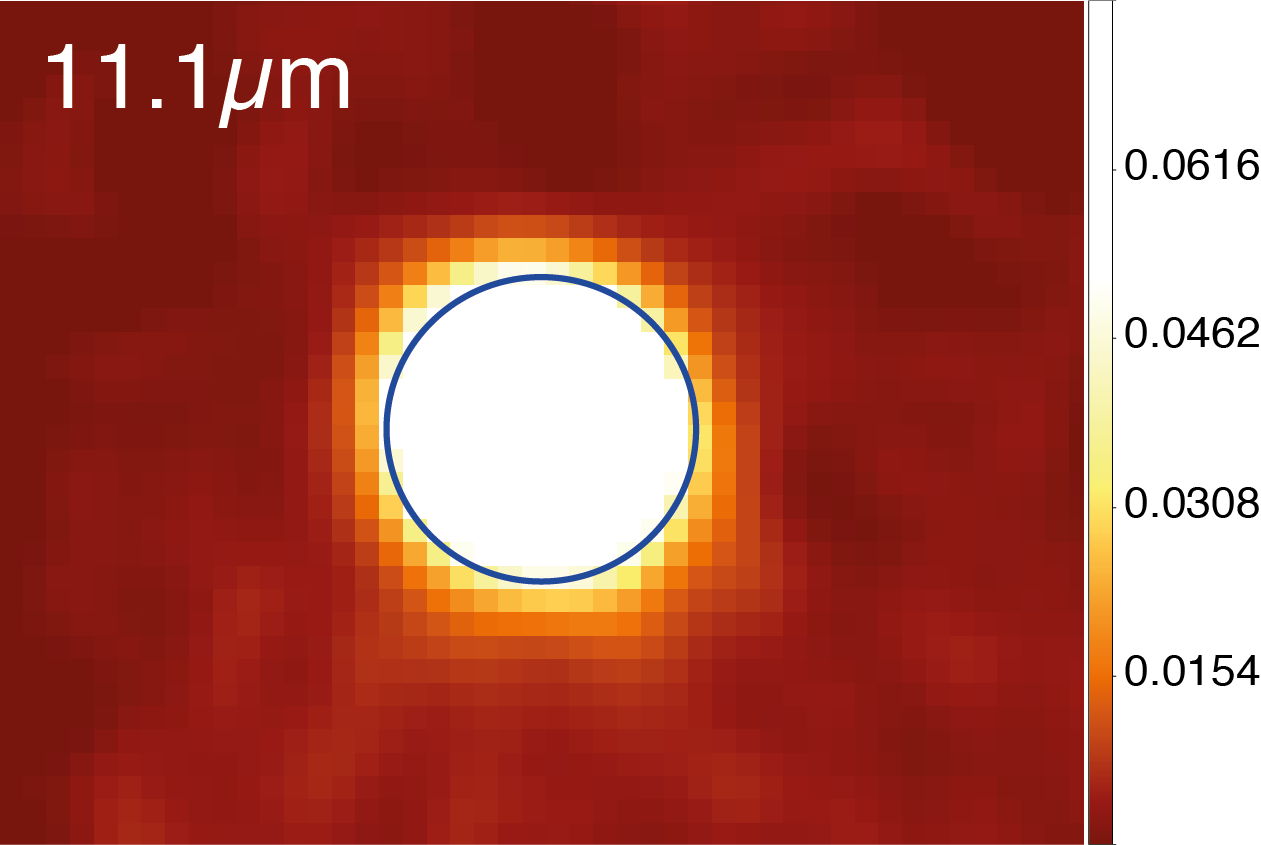
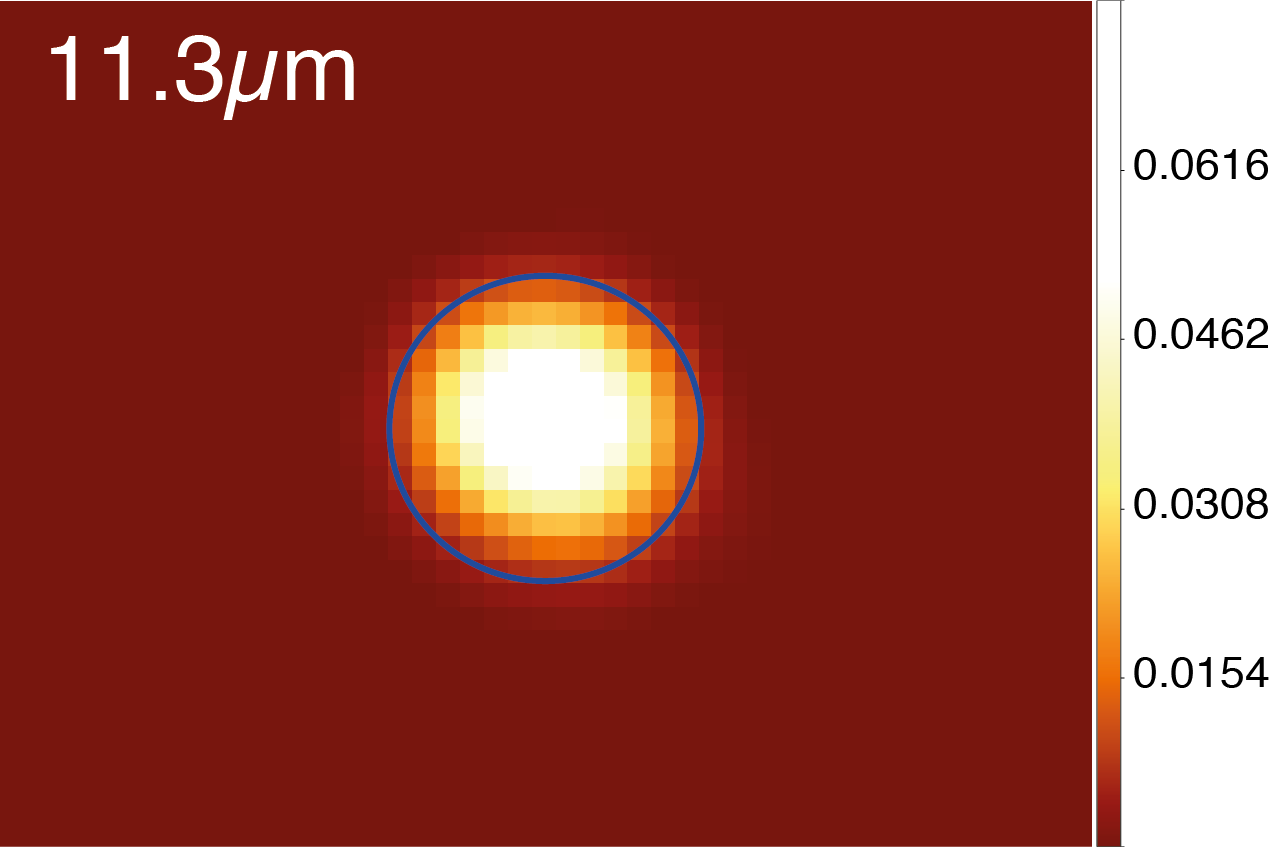
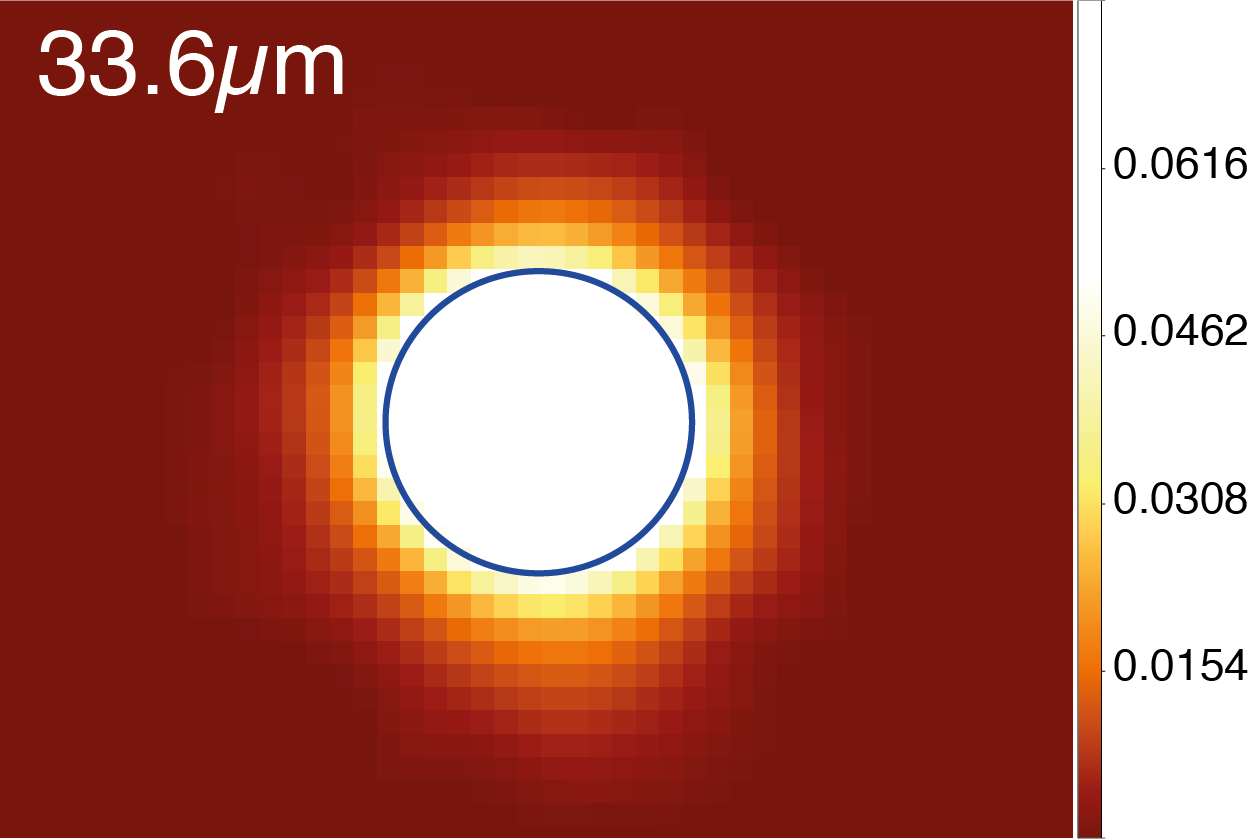
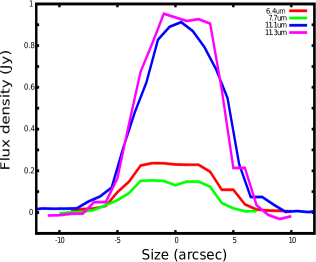
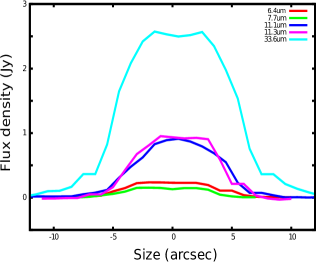
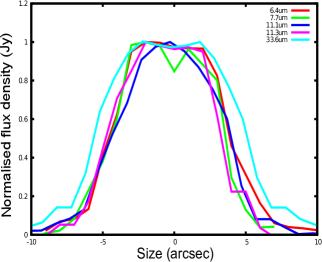
In Figure 1 we present the images of BD +30∘ 3639 obtained using the filters centred at 6.4, 7.7, 11.1, 11.3, and 33.6m. Each image has an over-plotted blue circle of 5′′ in radius. To study the spatial extension of the different dust features in the PN, we performed a radial cut along the major axis of the nebula (PA=135∘) for all the SOFIA images (the white line in the top left panel represents the PA of this cut). Figure 2 shows these cuts, the top plot shows the cut made using the PAH filters (centred at 6.4m, 7.7m, 11.1m, 11.3m). The extent of the shells in the PAHs filters is very similar. The cuts of the 7.7 and the 11.3m images show a double peaked emission, as expected for a shell surrounding a hollow interior. The measured full width at half maximum (FWHM) is 8′′ at these wavelengths. The middle image shows the PAHs filters and the silicates filter (centred at 33.6m). The emission at 33.6m is 1.5 times more extended than the C-rich material, with a FWHM of 12′′. The bottom plot shows the same radial cuts done in all the filters with the normalised flux.
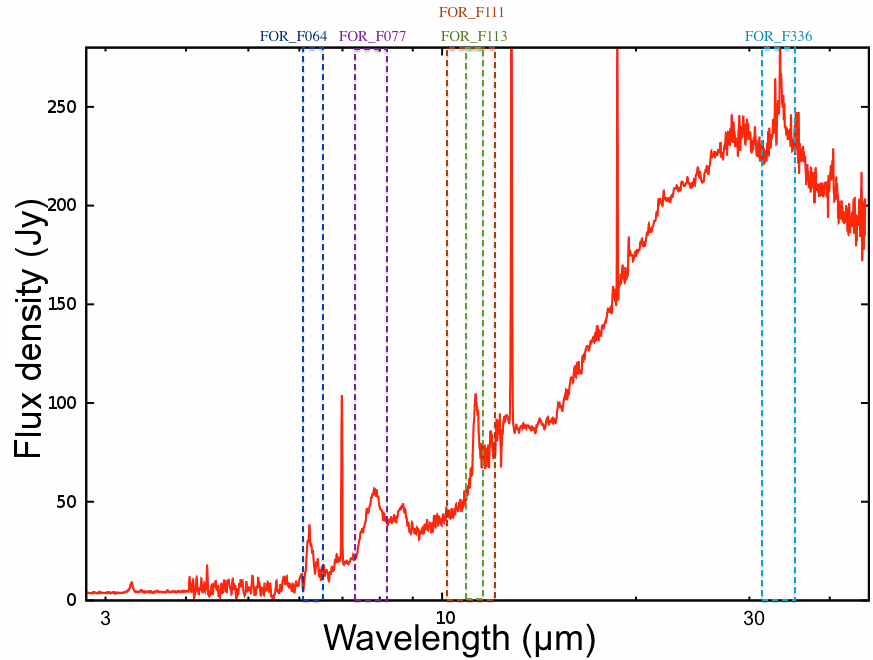
Figure 3 shows the Infrared Space Observatory (ISO) Short Wavelength Spectrometer (SWS) spectrum of BD +30∘ 3639 (reproduced from Sloan et al. 2003), with the bandpass of the SOFIA filters overlaid by a dashed line of different colours depending on the filter. Dark-blue represents the bandpass for the FOR_F064 filter, the FOR_F077 filter bandpass is in purple, brown for the FOR_F111 filter, green for the FOR_F113 filter, and light-blue for the FOR_F336 filter. Using the ISO spectrum we can clearly see the PAHs and the silicates features covered by each filter. We can see the main PAHs (6.25m, 7.7m, and 11.3m) as well as the crystalline silicates (33.6m) features.
Previous observations of BD +30∘ 3639 show a shell-like structure with a radius of 54′′ in the visible (Li et al., 2002) and 65′′ in radio (Bryce et al., 1997), while a much larger extension of the faintest part of the nebula is detected in the near-infrared (Phillips & Ramos-Larios, 2007). Previous mid-infrared imaging observations of BD +30∘ 3639 with a spatial resolution of 1.5′′ found that the 8.6 and 11.3m (PAHs) bands are slightly more extended than the continuum emission (Bentley et al., 1984). Higher spatial resolution imaging and spectroscopic observations of BD +30∘ 3639, taken with the Subaru telescope, confirmed that the PAH emission bands are more extended than the dust continuum emission, but show a similar extent to the [Ne II] 12.8m emission (Matsumoto et al., 2008). These observations also show evidence for a 10m absorption feature, attributed to silicates.
Until SOFIA, it was not possible to map the silicate emission features in this object, because the features emit at longer infrared wavelengths where no instrument was able to offer the necessary combination of wavelength coverage, sensitivity, and spatial resolution. Using the expansion velocity of the silicate shell of 10 km/s, and a distance of 1.2 kpc (Li et al., 2002), the expansion rate of the shell is 1.760.25 mas yr-1 in radius. Using the images we compared the size of the C-rich to the O-rich shell. For the C-rich shell we averaged all the images of the PAHs filters (6.4 to 11.3m), for the O-rich shell we used the image of the silicates filter (33.6m). We measure the size (radius) of the C-rich and the O-rich shells to be 50.75′′ and 7.50.75′′, respectively. These correspond to dynamical ages of 2,800580 yr for the C-rich shell and 4,300740 yr for its O-rich counterpart. This means that the transition of the star from O- to C-rich took place within a window of 1,500940 yr. These values are entirely consistent with the post-AGB age of the central star determined by comparison of its luminosity and temperature to evolutionary tracks (Vassiliadis & Wood, 1993; Blcker, 2001).
4 Analysis & Discussion
In Figure 1 and 2, we can see the different extensions of the two major components presented here, PAHs and silicates. It is important to note that no continuum filter observations were made, as such, the dust continuum contribution is not subtracted from any of the presented observations. Therefore, one must consider the level of continuum contamination in each filter before drawing conclusions as to the relative distribution of PAHs and silicates.
In the case of PAHs, from Figure 3, we can see that the FOR_F064 filter has a negligible contamination by dust continuum and thus traces the PAHs emission. From Figure 2 we can see that the emission in this filter has the same extension as the other PAHs filters, as such, we can assume that the measurements made in the PAHs filters are tracing the PAH emission, rather than just extended dust continuum.
Unfortunately, the observation made in the filter encompassing the silicates emission, the FOR_F336 filter, includes a significant contribution of dust continuum, as shown in Figure 3. Based on the images alone, we are unable to determine the spatial distribution of the silicates with respect to the dust continuum in the nebula. In order to resolve this degeneracy, a radiative transfer model of the nebula was created.
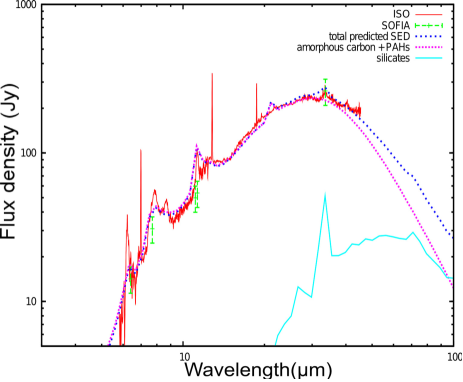
We constructed simple 3D photoionisation and dust radiative transfer models using the mocassin code (Ercolano et al., 2003, 2005, 2008). The model consists of neutral PAHs and graphitic carbon (optical constants from Li & Draine 2001), and amorphous silicates (optical constants from Laor & Draine 1993) and crystalline fosterite (optical constants from Jager et al. 1998). In both the dust density is proportional to r-2 and the grain size distribution is standard Mathis, Rumpl, & Nordsieck (1977 [MRN]). We adopted a distance of 1.2 kpc, and a central star luminosity and temperature of 4.25103 L⊙ and 55,000 K. We varied the shell
radii, the position of the silicates and carbon, and the mass of dust in each shell to obtain a good fit to the data. For the model to fit the ISO spectrum and the SOFIA data points, the carbon material has to be in the inner parts, while the silicates need to be in the outer parts of the nebula. If silicate dust is present in the inner warmer regions of the shell, emission features at 10 and 18m are predicted, opposite to what it is observed. The total mass is constrained to within 10% by the models.
In the best fitting model (Figure 4), the carbon shell extends from 1.5 to 5.5′′ on the plane of the sky and contains 6.610-5 M⊙ of dust, while the silicate shell extends from 5.5 to 7.5′′ and has a mass of 8.110-5 M⊙. The carbon dust mass loss rate, assuming the switch happened 2,800 yr ago, would be 2.410-8 M⊙ yr-1, so a total mass loss rate of 7.010-6 M⊙ yr-1 if the gas-to-dust ratio is 300. The silicate dust mass loss rate would be 5.410-8 M⊙ yr-1 for a total mass loss rate of 1.610-5 M⊙ yr-1.
The observed C/O ratio in the ionized region is (Bernard-Salas et al., 2003). Assuming instant, homogeneous mixing, and a solar O abundance, an initial C/O ratio of 0.8, and an envelope mass of 0.01 M⊙, the numbers suggest that the thermal pulse dredged-up of carbon, this is almost the same value we obtain. However, the current wind from the central star has (Yu et al., 2009), so that even if the mass-loss rates are low, the current wind can still add significantly to the carbon budget. The range of C/O and the somewhat low carbon dust mass may suggest that the carbon dredge-up was not instantaneous but that the C/O increased while the mass loss continued.
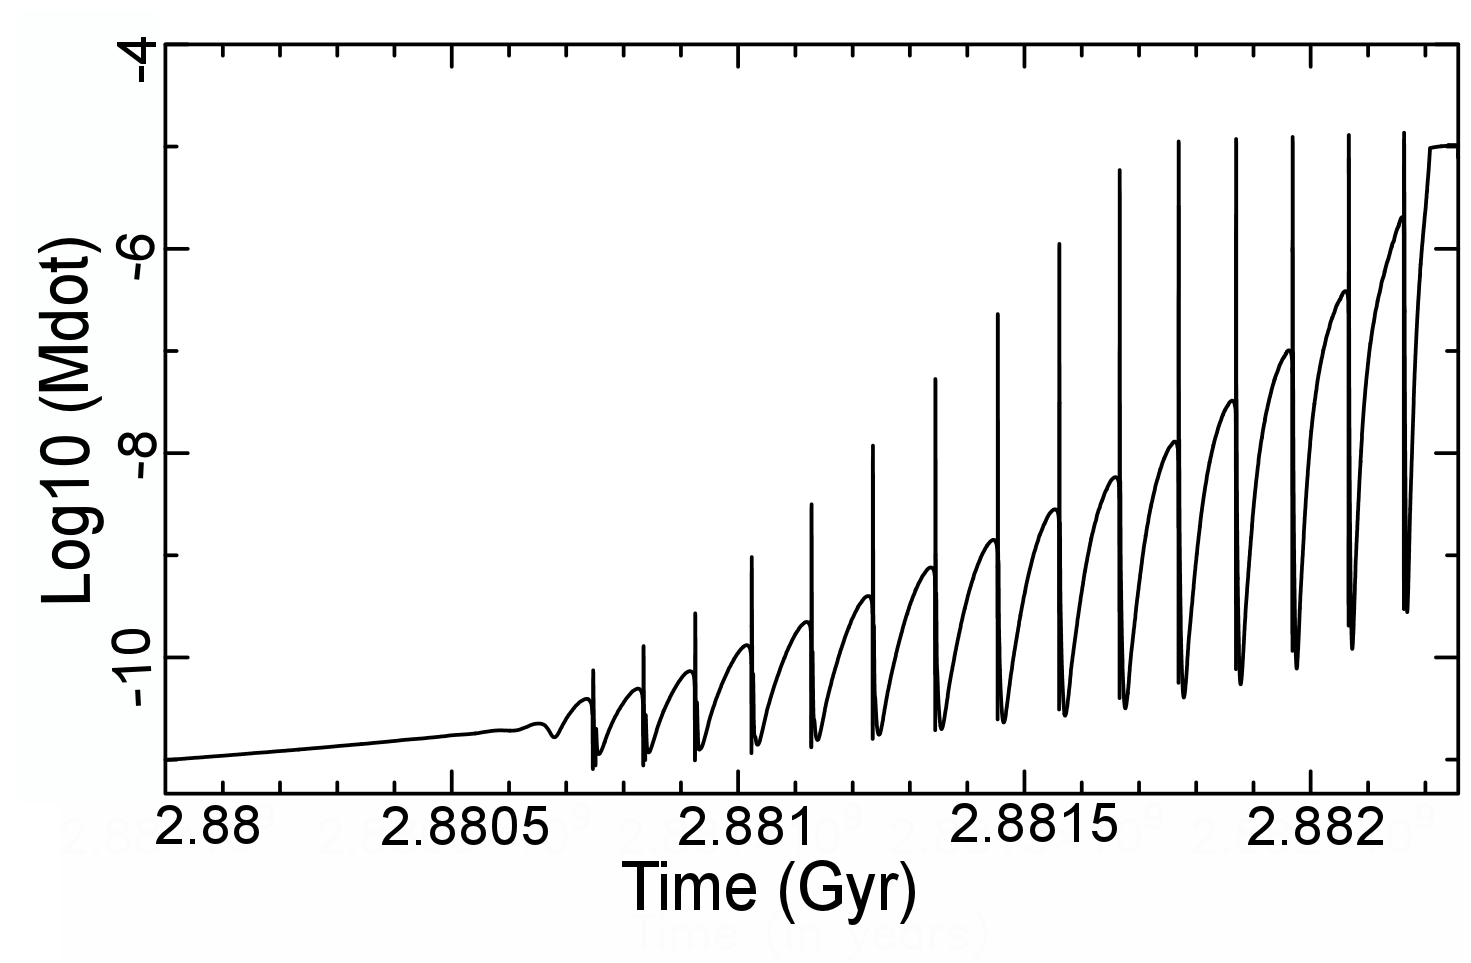
Independently, a stellar evolutionary model was constructed with an initial stellar mass of 1.5 M⊙ and solar metallicity, fairly typical values for a Galactic Disk PN. This model (Figure 5) derives a peak mass-loss rate at the point where the model star becomes C-rich of 110-5 M⊙ yr-1 and a final central star remnant mass of 0.62 M⊙ (Karakas, 2014), closely matching those values determined from the observations and photoionisation modelling. The model shows that the typical interpulse period near the end of the star’s life is 1105 years, while the total duration of a thermal pulse, a third dredge-up, and relaxation back to H-shell burning is of the order of 1000 years or more. The numbers fit the duration of the change from oxygen-rich to carbon-rich mass loss observed with SOFIA, and confirm that this is the likely explanation. At the last thermal pulse, is dredged-up to the envelope. About of this is 12C. This is higher than derived from the observations. Incomplete mixing (Hajduk et al., 2005) can therefore not be ruled out.
The observations and modelling suggest that the thermal pulse took place while the envelope mass was already very low. This is consistent with an AGB final (or fatal) thermal pulse (AFTP) occurring immediately before the star moves off the AGB. An AFTP can lead to both a considerable enrichment with carbon and oxygen and to the dilution of hydrogen, and also explains the current hydrogen-poor nature of the current central star (Blcker, 2001).
The short duration of this phase compared to the long interpulse period suggests that such observations of carbon dredge-up will remain uncommon. BD+30 3639 provides a rare glimpse into a phase of stellar evolution which is crucial to the origin of carbon in the Universe.
Acknowledgments
This work was co-funded under the Marie Curie Actions of the European Commission (FP7-COFUND). AIK was supported through an Australian Research Council Future Fellowship (FT110100475). LGR thanks Thomas Krhler for all the proactivity, the high level suggestions, the world class comments, and the highly efficient discussion on this paper. The authors thank the important comments of the referee (Jeronimo Bernard-Salas) that made the paper clearer and more precise.
References
- Adams et al. (2010) Adams et al., 2010, Proc. SPIE 7735, 77351U
- Bachiller et al. (1991) Bachiller et al., 1991, A&A, 247, 525
- Bentley et al. (1984) Bentley et al., 1984, ApJ, 278, 665
- Bernard-Salas et al. (2003) Bernard-Salas et al., 2003, A&A, 406, 165
- Blcker (2001) Blcker, 2001, Ap&SS, 275, 1
- Bryce et al. (1997) Bryce et al., 1997, MNRAS, 284, 815
- Cami et al. (2010) Cami et al., 2010, Science, 329, 1180
- Cohen et al. (1999) Cohen et al., 1999, ApJ, 513, L135
- Cohen et al. (2002) Cohen et al., 2002, MNRAS, 332, 879
- de Ruyter et al. (2006) de Ruyter et al., 2006, A&A, 448, 641
- Ercolano et al. (2003) Ercolano et al., 2003, MNRAS, 340, 1136
- Ercolano et al. (2005) Ercolano et al., 2005, MNRAS, 362, 1038
- Ercolano et al. (2008) Ercolano et al., 2008, ApJS, 175, 534
- Gutenkunst et al. (2008) Gutenkunst et al., 2008, ApJ, 680, 1206
- Guzman-Ramirez et al. (2011) Guzman-Ramirez et al., 2011, MNRAS, 414, 1667
- Guzman-Ramirez et al. (2014) Guzman-Ramirez et al., 2014, MNRAS, 441, 364
- Hajduk et al. (2005) Hajduk et al., 2005, Science, 308, 231
- Henning & Salama (1998) Henning & Salama, 1998, Science, 282, 2204
- Jager et al. (1998) Jager et al., 1998, A&A, 332, 291
- Karakas (2011) Karakas, 2011, ASPC, 445, 3
- Karakas & Lattanzio (2014) Karakas & Lattanzio, PASA, 2014, 31, 30
- Karakas (2014) Karakas, 2014, MNRAS, 445, 374
- Kausch et al. (2014) Kausch et al., 2014, submitted to A&A
- Kobayashi et al. (2011) Kobayashi et al., 2011, MNRAS, 414, 3231
- Laor & Draine (1993) Laor & Draine, 1993, ApJ, 402, L441
- Leahy et al. (2000) Leahy et al., 2000, ApJ, 540, 442
- Leitner & Kravtsov (2011) Leitner & Kravtsov, 2011, ApJ, 734, 48
- Li & Draine (2001) Li & Draine, 2001, ApJ, 550, L213
- Li et al. (2002) Li et al., 2002, AJ, 123, 2676
- Mathis et al. (1977) Mathis et al., 1977, ApJ, 217, 425
- Matsuura et al. (2009) Matsuura et al., 2009, MNRAS, 396, 918
- Matsumoto et al. (2008) Matsumoto et al., 2008, ApJ, 667, 1120
- Méndez (1991) Méndez, 1991, IAU Symp. 145, 375
- Perea-Calderon et al. (2009) Perea-Calderón et al., 2009, A&A, 495, L5
- Phillips & Ramos-Larios (2007) Phillips & Ramos-Larios, 2007, AJ, 133, 347
- Siebenmorgen et al. (1994) Siebenmorgen et al., 1994, MNARS, 271, 449
- Sloan et al. (2003) Sloan et al., 2003, ApJS, 147, 379
- Smette et al. (2015) Smette et al., 2015, A&A, in press
- Vassiliadis & Wood (1993) Vassiliadis & Wood, 1993, ApJ, 413, 641
- Waters et al. (1998) Waters et al., 1998, A&A, 331, L61
- Waters et al. (1998) Waters et al., 1998, Nature, 391, 868
- Yu et al. (2009) Yu et al., 2009, ApJ, 690, 440
- Zijlstra et al. (1989) Zijlstra et al., 1989, A&AS, 79, 329
- Zijlstra et al. (1991) Zijlstra et al., 1991, A&A, 243, L9
- Zijlstra et al. (2004) Zijlstra et al., 2004, MNRAS, 352, 325