Consequences of critical interchain couplings and anisotropy on a Haldane-chain
Abstract
Effects of interchain couplings and anisotropy on a Haldane chain have been investigated by single crystal inelastic neutron scattering and density functional theory (DFT) calculations on the model compound SrNi2V2O8. Significant effects on low energy excitation spectra are found where the Haldane gap (; where is the intrachain exchange interaction) is replaced by three energy minima at different antiferromagnetic zone centers due to the complex interchain couplings. Further, the triplet states are split into two branches by single-ion anisotropy. Quantitative information on the intrachain and interchain interactions as well as on the single-ion anisotropy are obtained from the analyses of the neutron scattering spectra by the random phase approximation (RPA) method. The presence of multiple competing interchain interactions is found from the analysis of the experimental spectra and is also confirmed by the DFT calculations. The interchain interactions are two orders of magnitude weaker than the nearest-neighbour intrachain interaction = 8.7 meV. The DFT calculations reveal that the dominant intrachain nearest-neighbor interaction occurs via nontrivial extended superexchange pathways Ni–O–V–O–Ni involving the empty orbital of V ions. The present single crystal study also allows us to correctly position SrNi2V2O8 in the theoretical - phase diagram [T. Sakai and M. Takahashi, Phys. Rev. B 42, 4537 (1990)] showing where it lies within the spin-liquid phase.
pacs:
75.50.Ee, 75.40.Gb, 75.50.Mm, 71.20.–bI Introduction
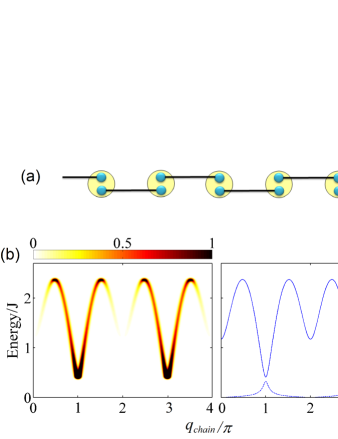
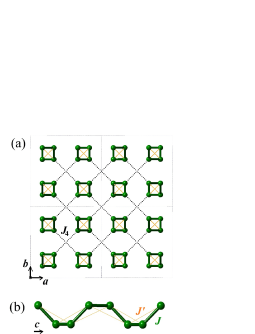
Spin-1 Heisenberg antiferromagnetic (AFM) chains or Haldane chains are of current interest due to their novel magnetic properties Affleck (1989); Smirnov and Glazkov (2007). In such systems, the magnetic ions interact with their nearest neighbors in only one direction (1D) and the long-range magnetic order is suppressed even at = 0 K by strong quantum spin fluctuations. They have exceptional dynamical properties with exponential decay of spin correlation functions. Haldane predicted a unique many body singlet ground state and gapped magnetic excitations Haldane (1983a, b). The energy gap between the singlet ground state and the 1st excited state (triplet) is known as the Haldane gap. This is in contrast to a gapless continuum of multi-spinon excitations ( = 1/2) of its half-integer counterpart, the Spin-1/2 Heisenberg uniform AFM chain Haldane (1983a, b). The singlet ground state of the Haldane chain can be visualized in a simple way similar to the valence bond solid (VBS) state. Here, the VBS state is constructed by representing each S =1 spin as two separate S =1/2 spins which form a singlet with their counterparts on the two neighboring sites Affleck et al. (1987) as schematically shown in Fig. 1(a). Each exchange bond carries exactly one valence bond, and the periodicity of the underlying lattice remains unbroken.
The excitation spectra of an isolated Haldane chain were investigated in great detail by several theoretical methods including quantum monte-carlo (QMC) Takahashi (1989), Exact diagonalization (ED) Golinelli et al. (1993a) and density matrix renormalization group (DMRG) White and Affleck (2008) as well as experimental techniques Ma et al. (1992); Xu et al. (2000). The excitation spectra were well understood as gapped dispersive excitation of magnons ( = 1). The minimum gap of the excitation spectra (Haldane gap) appears at the AFM zone centre (). DMRG calculations estimate the gap value , where is the intrachain antiferromagnetic coupling White and Affleck (2008). The one-magnon excitations disperse up to a maximum energy of 2.4 at the zone boundary ( and 3). A schematic excitation spectrum of an isolated isotropic Haldance chain is shown in Fig. 1(b). One of the interesting characteristics of the excitation spectrum of Haldane chain is that the dispersion relation is asymmetric about and 3 [Fig. 1(b) and (c)] since the translational symmetry of the lattice is not broken Ma et al. (1992); Zaliznyak et al. (2001). This is in contrast to the conventional Néel antiferromagnets where the unit cell is doubled and and 3 are of high symmetry points of the spin-wave dispersion relation. The intensity of the excitations [Fig. 1(b) and (c)] is well accounted by the single mode approximation Ma et al. (1992) which shows a maximum at the zone center and decreases continuously away from and disappears rapidly beyond the zone boundary Ma et al. (1992); Xu et al. (2000). In addition to the one-magnon excitations, multi-magnon excitations are also present. Even- and odd-magnon excitations are predicted around the wavevectors , and , respectively, where is an integer White and Affleck (2008). Thus the dynamics of the isolated Haldane chain are now well understood theoretically and experimentally. Our present research activities aim to explore and understand the influence of interchain interactions and anisotropy on Haldane chains.
The presence of interchain interactions and anisotropy leads to complex behaviors and a rich phase diagram as mapped theoretically by Sakai and Takahashi Sakai and Takahashi (1990). The Haldane gap can even be suppressed by critical values of interchain interactions and anisotropy which results in three dimensional (3D) long-range magnetic ordering Morra et al. (1988). Experimental challenges are to investigate the effects of interchain interactions and anisotropy on a model compound, to verify the theoretical predictions as well as to explore the critical properties. In this context, among the experimentally reported Haldane chain compounds, Ni2V2O8 where = Sr or Pb are of particular interest since they have substantial interchain interactions and single ion uniaxial anisotropy Zheludev et al. (2000, 2001). The compound SrNi2V2O8 is of present interest. The spin Hamiltonian for SrNi2V2O8 can be defined as
| (1) |
where the first and second terms are the nearest neighbor (NN) and next-nearest neighbor (NNN) intrachain interactions with exchange constants , and , respectively. The third term is due to interchain interactions where is the effective interchain exchange constant. The fourth term is due to single-ion-anisotropy parameter .
SrNi2V2O8 was proposed to be situated close to the phase boundary between the ordered and spin-liquid states in the Sakai-Takahashi phase diagram Zheludev et al. (2000). Based on initial powder inelastic neutron scattering (INS) studies, Zheludev et al. Zheludev et al. (2000, 2001) proposed an ordered AFM ground state for SrNi2V2O8 unlike the iso-structural compound PbNi2V2O8. However, a later nuclear magnetic resonance (NMR) study on powder samples of SrNi2V2O8 by Pahari et al. Pahari et al. (2006) found a nonmagnetic spin-liquid (singlet) ground state. Moreover, our earlier bulk properties and preliminary neutron scattering measurements on a single crystal confirmed that SrNi2V2O8 has a non-magnetic spin-singlet ground state and gapped magnetic excitations Bera et al. (2013).
Our previous single crystal study also revealed that a magnetic field induced quantum phase transition occurs from the gapped spin-liquid state to a 3D AFM ordered state Bera et al. (2013). The AFM ordered state is in contrast to the theoretical prediction of a field-induced ‘Luttinger liquid’ state for an isolated Haldane chain without anisotropy Konik and Fendley (2002). Moreover, when comparing the gap values to the critical magnetic fields, the Boson model Affleck (1992); Farutin and Marchenko (2007) correctly estimates gap value, in contrast to the Fermion and perturbative models Affleck (1992); Golinelli et al. (1993b). In contrast, for most of the studied Haldane chain compounds, which have planar anisotropy, the Fermion model estimates the gap values more accurately Regnault et al. (1994); Zheludev et al. (2003). In agreement with our finding, the gap values of the isostructural compound PbNi2V2O8 which also has uniaxial anisotropy were also better described by the Bosonic model Smirnov et al. (2008). It was predicted that the interchain interactions and the uniaxial single-ion anisotropy in SrNi2V2O8 play a crucial role in determining the magnetic properties as well as in inducing the 3D AFM ordered state above the critical magnetic field (). However, the nature of interchain interactions and anisotropy, as well as their role in the spin correlations are still unknown and are of present research interest.
In this paper, we report the results of single crystal inelastic neutron scattering measurements on SrNi2V2O8 and DFT calculations to investigate the role of complex interchain interactions and single-ion anisotropy on the Haldane chain. Neutron scattering measurements were performed over a wide reciprocal space region to probe several Brillouin zones as well as over a wide energy range to map out the dispersions fully. The strengths of intrachain and interchain interactions are estimated from the experimental excitation spectra by the Random phase approximation (RPA) method, and the exchange interaction geometry is proposed. The magnetic interactions are further investigated and verified by DFT based electronic band structure calculations. These calculations also provide insight into the complex superexchange paths which give rise to these interactions. Finally, the position of the SrNi2V2O8 in the theoretical - (Sakai-Takahashi) phase diagram has been proposed showing where it lies within the spin-liquid phase.
II Methods
Single crystals of SrNi2V2O8 were grown in the Crystal Laboratory at Helmholtz Zentrum Berlin für Materialen and Energie (HZB), Berlin, Germany. The starting material for crystal growth was prepared from high purity powders of SrCO3 (99.994%, Alfa Aesar, Puratronic), NiO (99.998%, Alfa Aesar, Puratronic) and V2O5 (99.99% Alfa Aesar, Puratronic) by solid state reactions. Crystal growth was performed in a four mirror type optical image furnace (Crystal Systems Corp., Japan) by the Traveling-solvent-floating-zone (TSFZ) technique. After growth the as-grown crystals were checked by x-ray and neutron Laue diffraction. Ground single crystals were also checked with x-ray powder diffraction (Brucker D8) for phase purity. Detail of the crystal growth and characterization will be reported in a separate paper Islam and et al. (2015).
A powder neutron diffraction pattern of SrNi2V2O8 was recorded at 2 K by using the high resolution powder diffractometer E9 ( = 1.7982 Å), at HZB, Germany. The diffraction pattern was analyzed by the Rietveld method using the FULLPROF software Ful .
Excitation spectra were measured by single crystal inelastic neutron scattering using the triple axis spectrometers with incident beams of thermal neutrons (PUMA at Heinz Maier-Leibnitz Zentrum (MLZ), Garching, Germany and IN8 at Institut Laue-Langevin (ILL), Grenoble, France) as well as cold neutrons (PANDA at MLZ, Garching, Germany). For PUMA and IN8, the measurements were performed with fixed final neutron wave vector = 2.662 and a Pyrolytic Graphite filter on the scattered side was used to remove higher order neutrons. For PANDA, the final neutron wave vector was fixed to = 1.57 and a cooled beryllium filter was used. Magnetic excitations were measured at base temperatures [at 3.1 and 3.5 K (using CCRs) for PANDA and PUMA, respectively, and at 1.5 K (using an orange cryostat) for IN8]. All measurements were performed on a large cylindrical single crystal of mass 2.5 g (diameter: 6 mm and length: 30 mm) which was mounted on an aluminum sample holder.
Density functional theory (DFT) calculations were performed using the full-potential code fplo9.07-41 Koepernik and Eschrig (1999). For the generalized gradient approximation (GGA) and GGA+ calculations, we used the parameterization from Ref. Perdew et al., 1996. All calculations were performed for the experimentally determined crystal structure at 2 K. Nonmagnetic GGA calculations were done on a 161616 -mesh (648 points in the irreducible wedge). Wannier functions centered on Ni sites were computed according to the procedure described in Ref. Eschrig and Koepernik, 2009. For the local and axes we used Ni–O1 and Ni–O4 vectors, respectively. Spin-polarized GGA+ calculations were done using symmetry-reduced cells (sp. gr. ) on a 222 -mesh. We used the on-site Coulomb repulsion of = 4.5 eV and the Hund’s exchange of = 1 eV within the fully localized limit.
III RESULTS AND DISCUSSION
III.1 Crystal structure
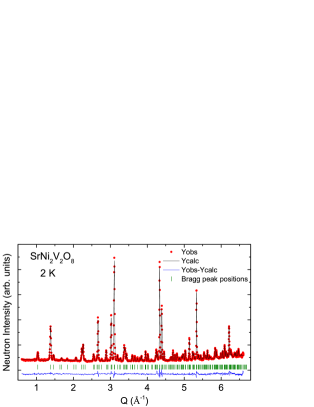
First we discuss briefly the crystal structure of SrNi2V2O8 which is important to understand the exchange interaction geometry. Powder neutron diffraction at 2 K using the E9 diffractometer at HZB, Berlin, Germany, was used to determine the low temperature structural parameters. The parameters were used for the analysis of the low temperature magnetic excitation spectra. The Rietveld refined diffraction pattern is shown in Fig. 2. The analysis confirms that the compound crystallizes in the tetragonal space group 4 as found earlier at room temperature Bera and Yusuf (2012). The refined lattice parameters are = = 12.135(1) Å and = 8.3159(1) Å. The positions of Sr, Ni and O were refined during the analysis. The refined values of their fractional coordinates at 2 K are given in Table 1. Since neutrons are not sensitive to the V nuclear position, the respective atomic coordinates were adopted from Ref. Wichmann and Müller-Buschbaum, 1986 and were kept fixed during the refinement.
| Atom | Wyckhoff | ||||
|---|---|---|---|---|---|
| position | (Å2) | ||||
| Sr | 0 | 0 | 0.87(1) | ||
| V111the values of the atomic coordinates and were adopted from Ref. Wichmann and Müller-Buschbaum,1986 | 0.0802 | 0.2596 | 0.1485 | 0.22 | |
| Ni | 0.3304(4) | 0.1678(3) | 0.2793(1) | 0.40(4) | |
| O1 | 0.1476(5) | 0.0019(10) | 0.5051(15) | 0.49(1) | |
| O2 | 0.1601(9) | 0.3335(9) | 0.0214(11) | 0.77(3) | |
| O3 | 0.3196(7) | 0.1623(3) | 0.0371(1) | 0.26(3) | |
| O4 | 0.3326(6) | 0.0021(9) | 0.3071(12) | 0.41(0) |
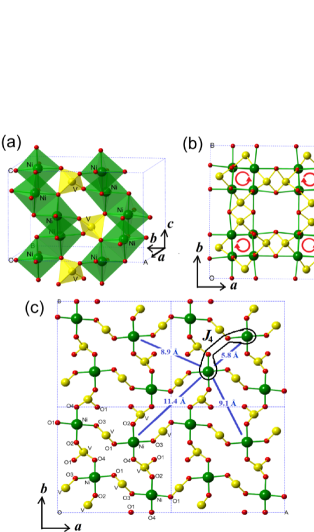
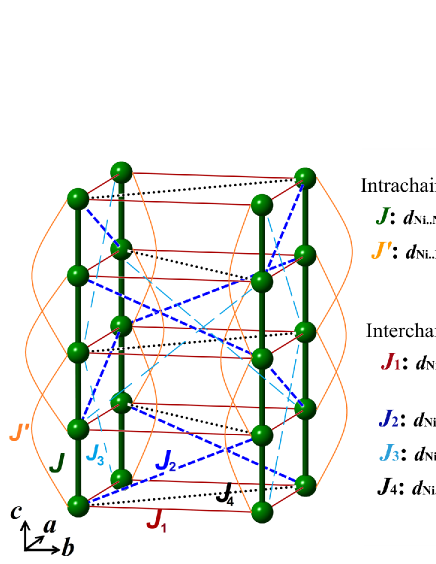
The spin chains in SrNi2V2O8 are formed by edge-shared NiO6 (Ni2+; 3, = 1) octahedra along the axis [Fig. 3(a)]. The screw chains are connected by nonmagnetic VO4 (V5+; 3, = 0) tetrahedra. There are four screw chains per unit cell which are centered around (1/4, 1/4); (1/4, 3/4); (3/4, 1/4); and (3/4, 3/4) in the plane [Fig. 3(b)]. Each of these screw chains is 4-fold and contains four Ni ions along the axis within one unit cell. The two diagonal chains rotate clockwise while the other two chains rotate anti-clockwise when propagating along the axis. Furthermore, a phase shift of /2 is present between diagonal chains [between (1/4, 1/4) and (3/4, 3/4), and between (1/4, 3/4) and (3/4, 1/4)]. This results in a rotation of all the bonds within an plane [as shown in Fig. 3(c)] with respect to the neighboring plane along the axis. This peculiar crystal structure provides multiple interchain interactions between neighboring chains Bera and Yusuf (2012). The interchain interactions are not confined within the planes but can also have an out-of-plane component. For instance, the interchain interactions are possible between two Ni2+ ions (from two neighboring chains) which have an offset relative to each other of /4 and /2 along the axis. In addition, next-nearest neighbor intrachain interactions, coupling two Ni ions separated by /2, are also present due to the screw nature of the chains.
III.2 Inelastic neutron scattering
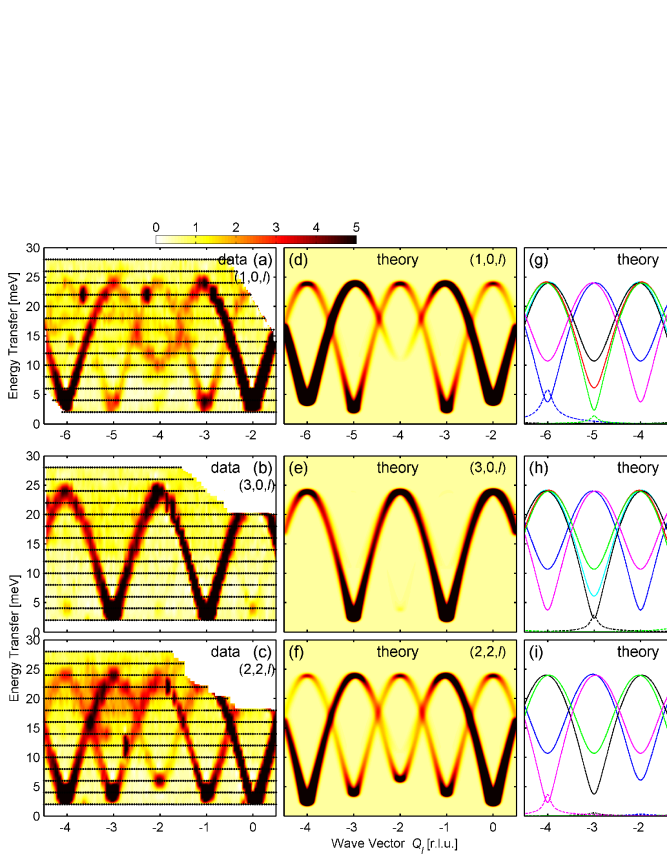
The excitation spectra [] along the chain direction, measured at 3.5 K using the PUMA spectrometer, show gapped magnetic excitations with strongly dispersive modes up to 23 meV [Figs. 4(a), 4(b) and 4(c)]. Complicated variations in the intensity of the excitation modes are found. In addition to the intensity modulation of Haldane chains (as discussed in Fig. 1), additional complexity arises due to the screw nature of the spin-chains in SrNi2V2O8. As discussed in the previous section the screw chains have four fold periodicity along the chain axis and each of the magnetic ions is shifted from the center of the chain axis. This leads to step-4 periodicity in the transverse displacement of the magnetic sites from the chain axis. Exact analytical calculation shows that the screw chains result in six modes with different structure factors Zheludev et al. (2000). All the individual modes have a periodicity of 4 r.l.u. along the chain direction (along the ) since there are four Ni ions per unit cell along the chain axis. However, the modes are shifted in the reciprocal space (discussed later in detail). In a measurement along the [such as along (1,0,), (3,0,), and (2,2,) in Figs. 4(a)–(c)], the individual modes appear with a shift of integer units with respected to each other [Figs. 4(g)–(i)]. This leads to energy minima of one of the modes at each of the reciprocal lattice points (any integer combinations of , , and ) which are refered to as AFM zone centers [Figs. 4(g)–(i)]. As the structure factor of individual modes is decided by the momentum transfer perpendicular to the chain axis (values of and ) (discussed later in detail) a substantial variation of relative intensity of the modes appears in the measured spectra [Fig. 4(a)–(c)]. For example, in the case of (3,0,) finite intensities are present only for the black [AFM zone center at (3,0,-3)] and the green [AFM zone center at (3,0,-1)] modes [Fig. 4(h)]. Intensities for the other four modes (red, blue, cyan, and magenta) are zero over the given reciprocal space.
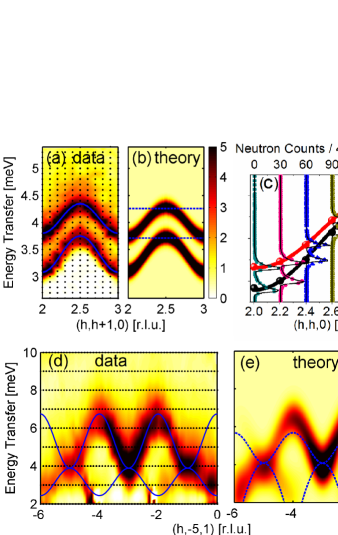
Three different energy minima (sizes 2.3 meV, 3.6 meV and 6.1 meV) are found at different AFM zone centers due to the complex interchain couplings. Furthermore, high resolution measurements using the cold neutron PANDA spectrometer [Figs. 5(a) and 5(c)] confirm that each of the modes is split into two branches by anisotropy, giving the energy minima: (i) 1.57 0.01 and 2.58 0.01 meV, (ii) 3.07 0.01 and 3.76 0.01 meV, and (iii) 5.78 0.01 and 6.18 0.01 meV, respectively. The measured energy minima patterns for the AFM zone centers in two representative reciprocal planes and are shown in Figs. 6(a) and 6(b), respectively. For simplicity, only the average values of the anisotropy split gaps are presented. Complex patterns arise due to several competing interchain interactions (discussed later) and the screw nature of the chains. It is evident that all the energy minima values along some diagonal directions are the same (intermediate value of 3.6 meV) for particular combination of and values i.e., even-odd for the and both even-even and odd-odd for the . It may be worth to mention that the gap minima [red points in Figs. 6(a) and 6(b)] become magnetic Bragg peaks in a magnetic field ().
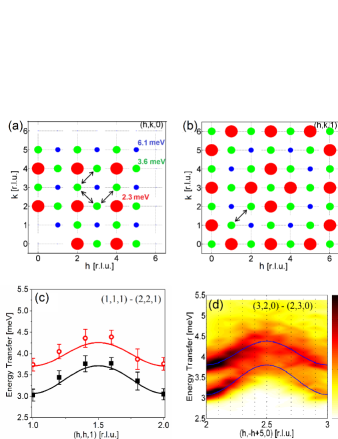
The presence of dispersions [Figs. 5 and 6] perpendicular to the chain direction confirms that there are finite interchain interactions. The maximum bandwidth of the perpendicular dispersions ( meV) is about 20 of the dispersion along the chain-direction. For the dispersion along (,-5,1) [Figs. 5(d)], two modes (anti-modes) are present with the same periodicity (2 r.l.u.) in which one mode disperses between 2.5–3.9 meV (lower energy mode) and the other mode disperses between 3.9–6.6 meV (higher energy mode). It may be noted that the bandwidth of the higher energy mode ( 2.7 meV) is larger than that of the lower energy mode ( 1.4 meV) which is found to be due to the competing interchain interactions (discussed later in detail). In addition, dispersions are also found along the diagonal directions between two neighboring reciprocal points having intermediate energy minima values (mean value of 3.6 meV) as shown in Fig. 5(a), Fig. 6(c), and Fig. 6(d). These dispersions indicate the presence of interchain interactions along the diagonal directions as found from the detailed analysis (discussed later).
To explain the observed features in the excitation spectra and to investigate the interactions and anisotropy, a model of the magnetic dynamical structure factor (, ) (Eq. 6) was derived by the RPA method for the Hamiltonian (Eq. 1) according to the method described by Zheludev et. al. in Ref. Zheludev et al., 2000 and Ref. Zheludev et al., 2001. The (, ) for SrNi2V2O8 was calculated in two steps; (i) first the calculation of (, ) for an equivalent Bravais spin-lattice of straight chains with an appropriate interaction topology [Fig. 7] and then (ii) the adaptation of the results for the more complex real crystal structure of SrNi2V2O8 having screw chains with a fourfold periodicity Zheludev et al. (2000).
The dynamical structure factors of a straight chain (in the single mode approximation) along the longitudinal () and transverse () directions are given as
| (2) |
where (= 2.49) is the spin-wave velocity, and = 1.26 Zheludev et al. (2000) and is the reduced momentum transfer along the chain direction. For SrNi2V2O8, = /4 = /4 where (= ) is the actual wave vector transfer, since there are four equivalent Ni2+ ions per unit cell along the chain direction ( axis).
The dispersion relations for a coupled Haldane chain, like SrNi2V2O8, can be written (within the RPA) as
| (3) |
where are the longitudinal and transverse Haldane gaps, respectively, for noninteracting chains. Two energy gaps appear due to the zero-field splitting of the triplet states by single-ion anisotropy Regnault et al. (1993). The relations between the energy gaps and single-ion anisotropy were proposed as Golinelli et al. (1993b, 1992)
| (4) |
where is the intrinsic Haldane gap ( 0.41) White and Affleck (2008) in the absence of single-ion anisotropy. The 2nd and 3rd terms give the intrachain dispersions. The (=1.1) in Eq. 3 characterizes the asymmetry of the dispersion relation Zheludev et al. (2001); Zaliznyak et al. (2001). The asymmetry arises due to the fact that the translational symmetry is not broken in the Haldane ground state Takahashi (1989). The fourth term is due to the contribution from the NNN intra-chain exchange interaction which is possible due to the screw chain crystal structure of edge sharing NiO6 tetrahedra [Fig. 3]. The in Eq. 3 is the combined Fourier transform of all interchain interactions between the magnetic sites in a crystallographic unit cell (Bravais spin-lattice) [earlier referred as in Eq. 1].
Now we consider the interchain interactions for the straight-chain spin-lattice. Only the interactions which are possible in the real screw-chain crystal structure of SrNi2V2O8 are considered (Fig. 7). The interactions are (i) : between two Ni ions from neighboring chains having the same values (in the plane) along the crystallographic directions [ in the real crystal structure and the coordination number () is four], (ii) : between two Ni ions from neighboring chains offset by /4 [ in the real crystal structure and the coordination number = 2], (iii) : between two Ni ions from neighboring chains having an offset of /2 [ in the real crystal structure and the coordination number = 2], and (iv) : between two Ni ions from diagonal chains within the plane [ in the real crystal structure and the coordination number = 1]. Combining all these contributions, becomes
| (5) | |||||
Finally, the dynamical structure factors (, ) for the real crystal structure of SrNi2V2O8 are given by [Ref. Zheludev et al., 2000]
| (6) |
where
| (7) |
are the 3D structure factors that arise due to the screw nature of the spin chains and ( 0.8) is the offset of each Ni2+ ion along the or axis with respect to the central axis of the corresponding screw chains [(1/4, 1/4) or (1/4, 3/4) or (3/4, 1/4) or (3/4, 3/4)]. The dynamical structure factors (, ) were simulated by using Eq. 6 and compared to the measured spectra. By adjusting the values of the interactions a good solution could be found which is given in Table 2 and the corresponding simulated excitation patterns are depicted in Fig. 4 and Fig. 5 alongside the measured patterns.
| Interac- | () | |||
|---|---|---|---|---|
| tion | ||||
| Value | 8.700.05 | 0.1490.004 | 0.2860.006 | 0.320.01 |
| 0.01 |
The analysis of the neutron scattering data reveals that the strongest interaction is the nearest neighbor intrachain AFM interaction = 8.7 meV. All other interactions are quite weak compared to , although, comparable in strength to each other. Note that in the proposed model it is not possible to determine the individual values of , and since these interactions result in virtually identical dispersion relations. Only the linear combination of these parameters, () (since the coordination numbers for , and are = 4, = 2, and = 2, respectively) can be determined and is found to be AFM in overall. The minus sign of expresses the fact that it competes with and if it has the same sign (e.g., AFM) but reinforces if it has opposite sign (e.g., FM). The diagonal interchain interaction is AFM and frustrated. strongly influences the dispersion relation perpendicular to the chain direction, it (i) makes the band widths asymmetric [Fig. 5(d)], (ii) introduces dispersion along the diagonal directions [Fig. 5(a) and Figs. 6(c)-(d)], as well as (iii) reduces the overall gap values. The NNN intrachain exchange interaction is also AFM and frustrated which increases the gap values. The resulting effect of all the interchain interactions leads to the three different energy minima 2.3, 3.6, and 6.1 meV [Figs. 4, 5, and 6] at the AFM zone centers as compared to the intrinsic Haldane gap of ()=3.57 meV. The fitted value of the uniaxial single-ion anisotropy parameter is found to be 0.01 meV. The value of the anisotropy parameter is in good agreement with the value = -0.29 meV obtained from the electron spin resonance measurements Wang et al. (2013).
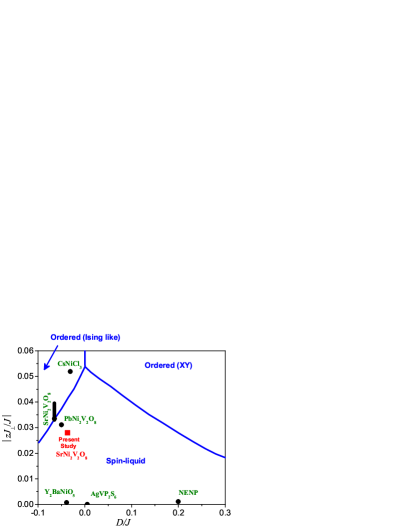
In SrNi2V2O8, the values of all the interactions are such that the mean value (3.56 meV) of the intermediate energy minima (3.07 and 3.76 meV) is equal to the theoretically predicted intrinsic Haldane gap value of (0.41 = 0.41 8.7 meV) 3.57 meV White and Affleck (2008). The first availability of good quality large single crystal has enabled us to perform such detailed investigations which give accurate values of exchange interactions as well as single-ion anisotropy. The present investigation estimates the values = 0.028 and = meV, respectively, and allows us to correctly position SrNi2V2O8 in the theoretical – phase diagram Sakai and Takahashi (1990), showing where it lies within the spin-liquid phase [Fig. 8].
Now we focus on the diagonal interchain interaction which is of special interest. The presence of a diagonal interaction is strongly evident from the experimentally observed dispersions along the diagonal directions within the () planes between two reciprocal lattice points having intermediate values (3.07 meV and 3.76 meV). For example, dispersions between (i) (2,3,0) and (3,4,0) [Fig. 5(a)], (ii) (1,1,1) and (2,2,1) [Fig. 6(c)], as well as (iii) (2,3,0) and (3,2,0) [Fig. 6(d)]. The simulated curves without considering the diagonal interchain interaction (i.e., = 0) reveal no dispersion between these reciprocal lattice points. Such a simulated curve between the (2,3,0) and (3,4,0) reciprocal lattice points is shown by the dotted lines in Fig. 5(b). The presence of frustrated AFM is further evident from the fact that the bandwidth of the higher energy mode is larger than that of the lower energy mode for (,-5,1) [Fig. 5(d)]. Here again, the patterns simulated with = 0 do not match with the observed excitation patterns. In contrast to the data, the simulation with = 0 results in a larger bandwidth of the lower energy mode than that of the higher energy mode as shown by the dotted curves in Fig. 5(e).
Although the presence of diagonal interactions is confirmed from the experimental data, the nature of the exchange pathways is unclear for the real crystal structure of SrNi2V2O8. In the real crystal, the direct distances between Ni-ions along the diagonal directions are large 5.8 and 11.4, 8.9 and 9.1 Å [Fig. 3(c)] which are far beyond the limit of any possible direct exchange interactions. Moreover, along the diagonal directions, the Ni ions are not connected directly by any obvious pathways (constructed from Ni–O and V–O bonds) [Fig. 3(c)] that can provide superexchange interactions. A superexchange interaction () is only possible between the Ni ions having shortest distance (5.8 Å) via nontrivial Ni–O..O–Ni pathways [Fig. 3(c)]. This is confirmed from the DFT calculations (discussed later).
The continuous propagation of this single interaction along a diagonal is not possible in SrNi2V2O8. If two Ni ions are separated along the diagonal by 5.8 Å and coupled by , the next Ni ion in the same diagonal direction will be situated far away (11.4 Å) [Fig. 3(c)]. Thus there is no possible continuous exchange path along the inplane diagonal direction (1,1,0). Nevertheless, an effective diagonal interaction along the body diagonal (1,1,1) direction may be plausible by a combination of and the NNN intrachain interaction (). Such an interaction scheme is shown in Fig. 9. As mentioned in the crystal structure section all the bonds within a plane rotate by 90 degrees with respect to the neighboring planes along the axis due to the 41 glide symmetry of the space group . Therefore, the shortest diagonal distances (5.8 Å) which are parallel to each other are shifted by /2 along the axis. These two paths can be connected to each other by the NNN intrachain interaction () which occurs between two Ni ions shifted by /2 along the axis within a given chain. Thus, a combination of and results in an effective diagonal interaction along the (1,1,1) direction.
III.3 DFT calculations
To get further insight in the microscopic exchange interaction model, we employed DFT calculations. As discussed in the previous section, the INS study can estimate the sums of different interchain couplings, yet in some cases their individual values remain unknown. The purpose of our DFT calculations is twofold. In DFT calculations, we can directly access all individual exchange couplings, our primary goal is to verify the exchange interactions provided by INS, to estimate their individual values, as well as supplement our microscopic magnetic model with the missing terms. Second, we are interested in the mechanism of the magnetic exchange, i.e. which orbitals (including those on nonmagnetic sites) have a sizable contribution to the magnetic exchange.
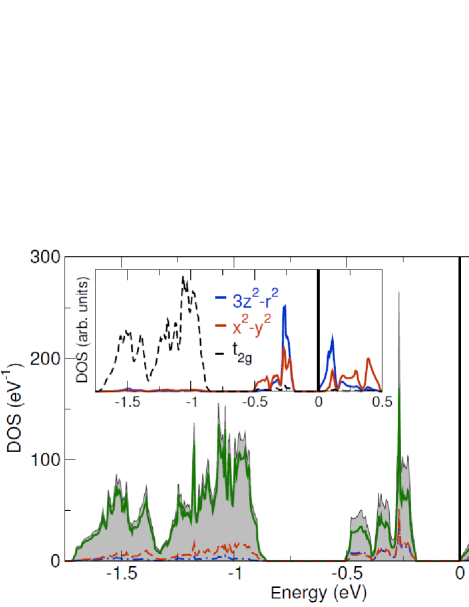
Before we proceed to the DFT results, several remarks on the electronic structure of Ni2+ systems should be made. In SrNi2V2O8, the magnetic Ni atoms have a distorted octahedral environment. Hence, the electrical crystal field splits the orbitals into two manifolds: comprising , , and orbitals, and , comprising and orbitals. The electronic configuration of Ni2+ implies that the lower-lying orbitals are fully filled, while the orbitals are half-filled (one electron per orbital). Since the number of electrons is even, we expect a gap in the electronic excitation spectrum (band insulator). This intuitive picture is fully supported by our non-magnetic GGA calculations that yield a valence band dominated by Ni states split into two manifolds and a gap of 0.2 eV (Fig. 10). Such a small band gap renders SrNi2V2O8 as a semiconductor, which is at odds with the yellow color of the crystals, indicating the importance of strong electronic correlations that are severely underestimated in the GGA. We should also note that the valence band is dominated by the Ni states, yet there is a substantial contribution of O and V states especially in the channel (Fig. 10). Both O and V states play a crucial role for the intra-chain exchange, as will be demonstrated below.
| path | (GGA+) | (INS) | interactions | |||||
|---|---|---|---|---|---|---|---|---|
| 2.866 | 84 | 216 | 8.43 | 8.7 | ||||
| 5.008 | 31 | 35 | 10 | 0.21 | 0.15 | |||
| 6.376 | 12 | =0.29] | ||||||
| 6.387 | 14 | |||||||
| 4.998 | 20 | 7 | ||||||
| 5.851 | 5 | 10 | 5 | |||||
| 5.790 | 45 | 0.16 | 0.32 |
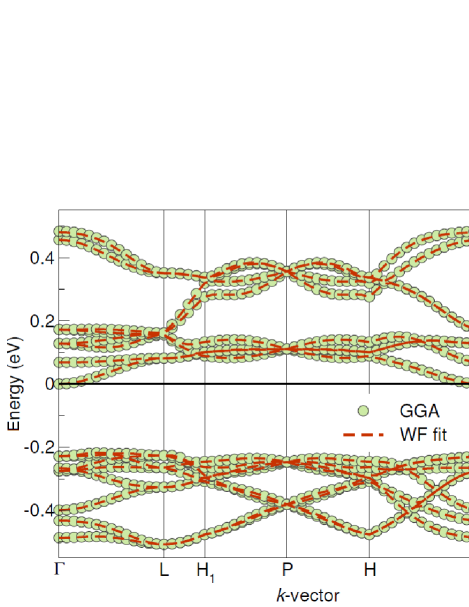
The primitive unit cell of SrNi2V2O8, whose volume is twice smaller than the conventional body-centered tetragonal cell, contains 8 magnetic Ni atoms, i.e. we expect 85 = 40 bands with dominant Ni character. Since the magnetism pertains to low-energy excitations, we restrict our analysis to the states (Fig. 11) that lie in the vicinity of the Fermi energy. These 16 bands are projected onto a real-space basis of Ni-based Wannier functions, while the resulting overlap integrals parameterize an effective two-orbital ( and ) tight-binding model. Going back to the -space, the tight-binding Hamiltonian yields excellent agreement with the GGA bands (Fig. 11).
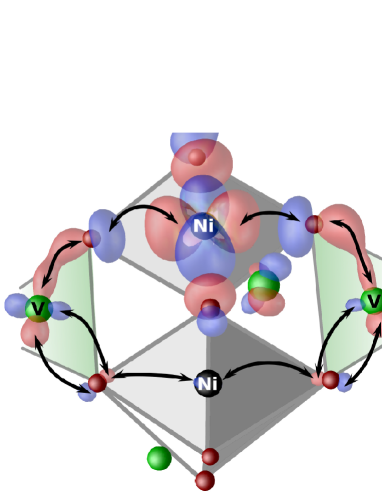
For each pair of Ni atoms, electron transfer can involve (i) two orbitals, (ii) two orbitals, or two orbitals of different character. Since SrNi2V2O8 lacks inversion symmetry, the and couplings are not equivalent, hence there are four terms for each pair of Ni atoms and . The resulting transfer integrals are provided in Table 3. All the leading terms correspond to the NN intrachain coupling (), and the contribution to this coupling is by far the largest. The AFM ( 8.7 meV [Table 2]) is surprisingly strong for an almost Ni–O–Ni superexchange pathways between two intrachain NN Ni ions. According to the Goodenough-Kanamori rules Goodenough (1955); Kanamori (1959), a ferromagnetic interaction is preferable for superexchange pathways. To pinpoint the cause of this dominance, we plot one of the Ni -based Wannier function in Fig. 12. By examining the nonlocal contributions, we find that the bridging O atom in the Ni–O–Ni intrachain path only moderately contributes to the electron transfer, while the main contribution is facilitated by the V -orbitals and follows the nontrivial Ni–O–V–O–Ni superexchange pathways.
Long-range superexchange paths involving empty orbitals are quite common in V5+ systems. For instance, Cu–O–V–O–Cu hopping gives rise to a sizable exchange of 330 K in the spin-chain compound AgCuVO4 Möller et al. (2009). A similar hopping process in -Cu2V2O7 leads to the honeycomb-lattice magnetism Tsirlin et al. (2010), which is not observed in isostructural -Cu2P2O7 (coupled dimers, Ref. Janson et al., 2011) and -Cu2As2O7 (alternating chains, Ref. Arango et al., 2011). Hence, we can expect that the replacement of the -element V in SrNi2V2O8 with a element, such as P and As, would also drastically affect the magnetic coupling regime.
After establishing the mechanism of the NN intrachain couplings , we turn to the much smaller interchain terms as well as the NNN intrachain term. These transfer integral terms are weak and amount to several meV at most, and this extremely low magnetic energy scale severely impedes the accuracy of DFT results. As follows from Table 3, several interchain couplings in SrNi2V2O8 have similar strengths. To estimate the numerical values of these small terms, we employ spin-polarized GGA+ calculations for magnetic supercells and map the resulting total energies onto a classical Heisenberg model. The main drawback of this method is the dependence of the resulting exchange integrals on the value used in GGA+. To eliminate this problem, we investigated a range of values and evaluated the optimal value of 4.5 eV, which reproduces the experimental value for (8.7 meV) within the error bars.
The resulting interchain exchange couplings are given in Table 3. A reasonably good agreement between the exchange interactions from the GGA+ and INS is found. The possible intra and interchain interactions (for any transfer integral 5 meV) agree well with the INS results and, hence, further long-range couplings in SrNi2V2O8 can be neglected. In agreement with the INS results, the DFT calculations reveal the presence of the AFM NNN intrachain interaction . The DFT calculations provide the individual values of , , and which are indistinguishable in the INS. In agreement with the INS, the overall sign of () is found to be antiferromagnetic. The DFT calculations further reveal that all the , , and are ferromagnetic and the is the strongest interaction among them. The presence of the antiferromagnetic is also confirmed between two Ni ions having the shortest distance of 5.8 Å along the diagonal direction within a given plane.
The exchange mechanism for the diagonal interaction was also revealed by the Ni -based Wannier function. By examining the nonlocal contributions, we find that the mechanism for is superexchange along Ni–O..O–Ni paths. It is quite efficient, because (i) the magnetically
active orbitals of the respective Ni atoms lie in the same plane and (ii) the direct O..O distance (2.84 Å) is short enough to facilitate overlapping of O 2 states. This is very similar to the situation in the edge-sharing chain cuprate LiVCuO4 Nishimoto et al. (2012), where the same mechanism gives rise to next-nearest-neighbor
exchange interactions.
IV Summary and conclusions
In summary, our detailed single crystal inelastic neutron scattering study reveals that the ground state of the Haldane chain compound SrNi2V2O8 is a non-magnetic singlet, however, the low energy excitation spectra are significantly modified by the complex interchain interactions and single-ion anisotropy. The effective energy gap (1.57 meV) is reduced from the intrinsic Haldane gap value of 3.57 meV, and the system is pushed close to the phase boundary to long-range order. Comprehensive experimental data along with DFT calculations reveal the important interactions, and estimate their strengths as well as the size of the single-ion anisotropy that allows SrNi2V2O8 to be accurately positioned in the theoretical – phase diagram. The position of SrNi2V2O8 within the spin-liquid phase is shown and compared with previous results. The presence of multiple competing inter-chain interactions is confirmed by both INS measurements and DFT calculations. The interchain interactions are quite weak (in the order of one tenth of meV) as compared to the strongest nearest neighbor intrachain interaction = 8.7 meV. The DFT analysis reveals the mechanism of the exchange interactions, for example, (i) the strongest intrachain exchange occurs via nontrivial Ni–O–V–O–Ni paths involving the empty orbitals of the V ion and (ii) the diagonal interaction occurs via Ni–O..O–Ni paths with a direct overlapping of O 2 states.
Acknowledgements.
We would like to thank A. Zheludev for a fruitful discussion on the inelastic neutron scattering data. We acknowledge the Helmholtz Virtual Institute (Project No. VH-VI-521).References
- Affleck (1989) I. Affleck, J. Phys.: Condens. Matter. 1, 3047 (1989).
- Smirnov and Glazkov (2007) A. Smirnov and V. Glazkov, J. Exp. Theore. Phys. 105, 861 (2007).
- Haldane (1983a) F. D. M. Haldane, Phys. Rev. Lett. 50, 1153 (1983a).
- Haldane (1983b) F. D. M. Haldane, Phys. Lett. A 93, 464 (1983b).
- Affleck et al. (1987) I. Affleck, T. Kennedy, E. H. Lieb, and H. Tasaki, Phys. Rev. Lett. 59, 799 (1987).
- Takahashi (1989) M. Takahashi, Phys. Rev. Lett. 62, 2313 (1989).
- Golinelli et al. (1993a) O. Golinelli, T. Jolicoeur, and R. Lacaze, Journal of Physics: Condensed Matter 5, 1399 (1993a).
- White and Affleck (2008) S. R. White and I. Affleck, Phys. Rev. B 77, 134437 (2008).
- Ma et al. (1992) S. Ma, C. Broholm, D. H. Reich, B. J. Sternlieb, and R. W. Erwin, Phys. Rev. Lett. 69, 3571 (1992).
- Xu et al. (2000) G. Xu, G. Aeppli, M. E. Bisher, C. Broholm, J. F. DiTusa, C. D. Frost, T. Ito, K. Oka, R. L. Paul, H. Takagi, and M. M. J. Treacy, Science 289, 419 (2000).
- Zaliznyak et al. (2001) I. A. Zaliznyak, S.-H. Lee, and S. V. Petrov, Phys. Rev. Lett. 87, 017202 (2001).
- Sakai and Takahashi (1990) T. Sakai and M. Takahashi, Phys. Rev. B 42, 4537 (1990).
- Morra et al. (1988) R. M. Morra, W. J. L. Buyers, R. L. Armstrong, and K. Hirakawa, Phys. Rev. B 38, 543 (1988).
- Zheludev et al. (2000) A. Zheludev, T. Masuda, I. Tsukada, Y. Uchiyama, K. Uchinokura, P. Böni, and S.-H. Lee, Phys. Rev. B 62, 8921 (2000).
- Zheludev et al. (2001) A. Zheludev, T. Masuda, K. Uchinokura, and S. E. Nagler, Phys. Rev. B 64, 134415 (2001).
- Pahari et al. (2006) B. Pahari, K. Ghoshray, R. Sarkar, B. Bandyopadhyay, and A. Ghoshray, Phys. Rev. B 73, 012407 (2006).
- Bera et al. (2013) A. K. Bera, B. Lake, A. T. M. N. Islam, B. Klemke, E. Faulhaber, and J. M. Law, Phys. Rev. B 87, 224423 (2013).
- Konik and Fendley (2002) R. M. Konik and P. Fendley, Phys. Rev. B 66, 144416 (2002).
- Affleck (1992) I. Affleck, Phys. Rev. B 46, 9002 (1992).
- Farutin and Marchenko (2007) A. Farutin and V. Marchenko, J. Exp. Theo. Phys. 104, 751 (2007).
- Golinelli et al. (1993b) O. Golinelli, T. Jolicoeur, and R. Lacaze, J. Phys.: Condens. Matter 5, 7847 (1993b).
- Regnault et al. (1994) L. P. Regnault, I. Zaliznyak, J. P. Renard, and C. Vettier, Phys. Rev. B 50, 9174 (1994).
- Zheludev et al. (2003) A. Zheludev, Z. Honda, C. L. Broholm, K. Katsumata, S. M. Shapiro, A. Kolezhuk, S. Park, and Y. Qiu, Phys. Rev. B 68, 134438 (2003).
- Smirnov et al. (2008) A. I. Smirnov, V. N. Glazkov, T. Kashiwagi, S. Kimura, M. Hagiwara, K. Kindo, A. Y. Shapiro, and L. N. Demianets, Phys. Rev. B 77, 100401 (2008).
- Islam and et al. (2015) A. T. M. N. Islam and et al., (2015), unpublished .
- (26) “Fullprof suite,” http://www.ill.eu/sites/fullprof/.
- Koepernik and Eschrig (1999) K. Koepernik and H. Eschrig, Phys. Rev. B 59, 1743 (1999).
- Perdew et al. (1996) J. P. Perdew, K. Burke, and M. Ernzerhof, Phys. Rev. Lett. 77, 3865 (1996).
- Eschrig and Koepernik (2009) H. Eschrig and K. Koepernik, Phys. Rev. B 80, 104503 (2009).
- Bera and Yusuf (2012) A. K. Bera and S. M. Yusuf, Phys. Rev. B 86, 024408 (2012).
- Wichmann and Müller-Buschbaum (1986) R. Wichmann and H. Müller-Buschbaum, Rev. Chim. Mineral. 23, 1 (1986).
- Regnault et al. (1993) L. P. Regnault, I. A. Zaliznyak, and S. V. Meshkov, J. Phys.: Condens. Matter 5, L677 (1993).
- Golinelli et al. (1992) O. Golinelli, T. Jolicoeur, and R. Lacaze, Phys. Rev. B 46, 10854 (1992).
- Wang et al. (2013) Z. Wang, M. Schmidt, A. K. Bera, A. T. M. N. Islam, B. Lake, A. Loidl, and J. Deisenhofer, Phys. Rev. B 87, 104405 (2013).
- Goodenough (1955) J. B. Goodenough, Phys. Rev. 100, 564 (1955).
- Kanamori (1959) J. Kanamori, J. Phys. Chem. Solids 10, 87 (1959).
- Möller et al. (2009) A. Möller, M. Schmitt, W. Schnelle, T. Förster, and H. Rosner, Phys. Rev. B 80, 125106 (2009).
- Tsirlin et al. (2010) A. A. Tsirlin, O. Janson, and H. Rosner, Phys. Rev. B 82, 144416 (2010).
- Janson et al. (2011) O. Janson, A. A. Tsirlin, J. Sichelschmidt, Y. Skourski, F. Weickert, and H. Rosner, Phys. Rev. B 83, 094435 (2011).
- Arango et al. (2011) Y. C. Arango, E. Vavilova, M. Abdel-Hafiez, O. Janson, A. A. Tsirlin, H. Rosner, S.-L. Drechsler, M. Weil, G. Nénert, R. Klingeler, O. Volkova, A. Vasiliev, V. Kataev, and B. Büchner, Phys. Rev. B 84, 134430 (2011).
- Nishimoto et al. (2012) S. Nishimoto, S.-L. Drechsler, R. Kuzian, J. Richter, J. Málek, M. Schmitt, J. van den Brink, and H. Rosner, EuroPhys. Lett. 98, 37007 (2012).