Site occupancy and magnetic properties of Al-substituted M-type strontium hexaferrite
Abstract
We use first-principles total-energy calculations based on density functional theory to study the site occupancy and magnetic properties of Al-substituted -type strontium hexaferrite SrFe12-xAlxO19 with and . We find that the non-magnetic Al3+ ions preferentially replace Fe3+ ions at two of the majority spin sites, and , eliminating their positive contribution to the total magnetization causing the saturation magnetization to be reduced as Al concentration is increased. Our formation probability analysis further provides the explanation for increased magnetic anisotropy field when the fraction of Al is increased. Although Al3+ ions preferentially occupy the sites at a low temperature, the occupation probability of the site increases with the rise of the temperature. At a typical annealing temperature () Al3+ ions are much more likely to occupy the site than the site. Although this causes the magnetocrystalline anisotropy to be reduced slightly, the reduction in is much more significant. Their combined effect causes the anisotropy field to increase as the fraction of Al is increased, consistent with recent experimental measurements.
pacs:
61.50.-f, 75.20.En, 75.30.Cr, 75.30.GwI Introduction
Strontium hexaferrite, SrFe12O19 (SFO) is one of the most commonly used materials for permanent magnets, magnetic recording and data storage, and components in electrical devices operating at microwave/GHz frequencies, due to its high Curie temperature, large saturation magnetization, excellent chemical stability and low manufacturing cost Wang et al. (2012); Pullar (2012); Pang et al. (2010); Davoodi and Hashemi (2011); Ashiq et al. (2012). However, in comparison with Nd-Fe-B and magnet, the coercivity of the SFO is low and presents a significant limitation in its application. Therefore, enhancement of the coercivity is an important research topic for the strontium hexaferrite.
In order to tailor the magnetic properties such as magnetization and coercivity, various cation substitutions in the M-type hexaferrites have been investigated. For example, the substitution of La Seifert et al. (2009); Wang et al. (2004), Sm Wang et al. (2001), Pr Wang et al. (2005) and Nd Wang et al. (2002) in the SFO increased coercivity moderately while the substitution of Zn-Nb Fang (2004), Zn-Sn Ghasemi et al. (2010); Ghasemi and Šepelák (2011); Liyanage et al. (2013) and Sn-Mg Davoodi and Hashemi (2011) decreased coercivity. However, the coercivity of the M-type hexaferrites is not increased significantly by these cation substitutions, and is still much smaller than that of Nd-Fe-B magnet Liu et al. (2010).
Al substitution in the M-type hexaferrite has been more effective in enhancing coercivity Bertaut et al. (1959); Wang et al. (2000); Liu et al. (2011); Luo et al. (2012); Harward et al. (2013). Particularly, Wang et al synthesized Al-doped SFO SrFe12-xAlxO19 (SFAO) with Al content of using glycin–nitrate method and subsequent annealing in a temperature over obtaining the largest coercivity of 17.570 kOe, which is much larger than that of SFO (5.356 kOe) and exceeds even the coercivity of the Nd2Fe17B (15.072 kOe) Wang et al. (2012). Wang and co-workers also observed that the coercivity of the SFAO increases with increasing Al concentration at a fixed annealing temperature. These results call for a systematic understanding, from first principles, of why certain combinations of dopants lead to particular results. This theoretical understanding will be essential in systematically tailoring the properties of SFO.
There have been several previous first-principles investigations of SFO. Fang et al investigated the electronic structure of SFO using density-functional theory (DFT) Fang et al. (2003). Park et al have calculated the exchange interaction of SFO from the differences of the total energy of different collinear spin configurations Park et al. (2014). In spite of the importance of substituted SFO, only a few theoretical investigations have been done. Magnetism in La substituted SFO has been studied using DFT Küpferling et al. (2005); Novák et al. (2005). The site occupancy and magnetic properties of Zn-Sn substituted SFO has been investigated Liyanage et al. (2013).
In this work we use first-principles total-energy calculations to study the site occupation and magnetic properties of Al substituted -type strontium hexaferrite SrFe12-xAlxO19 with and . Based on DFT calculations, we determine the the structure of various configurations of SFAO with different Al concentrations and compute the occupation probabilities for different substitution sites at elevated temperatures. We show that our model predicts an decrease of saturation magnetization as well as a decrease in magnetocrystalline anisotropy , and the increase of the anisotropy field as the fraction of Al is increased, consistent with recent experimental measurements.
II Methods
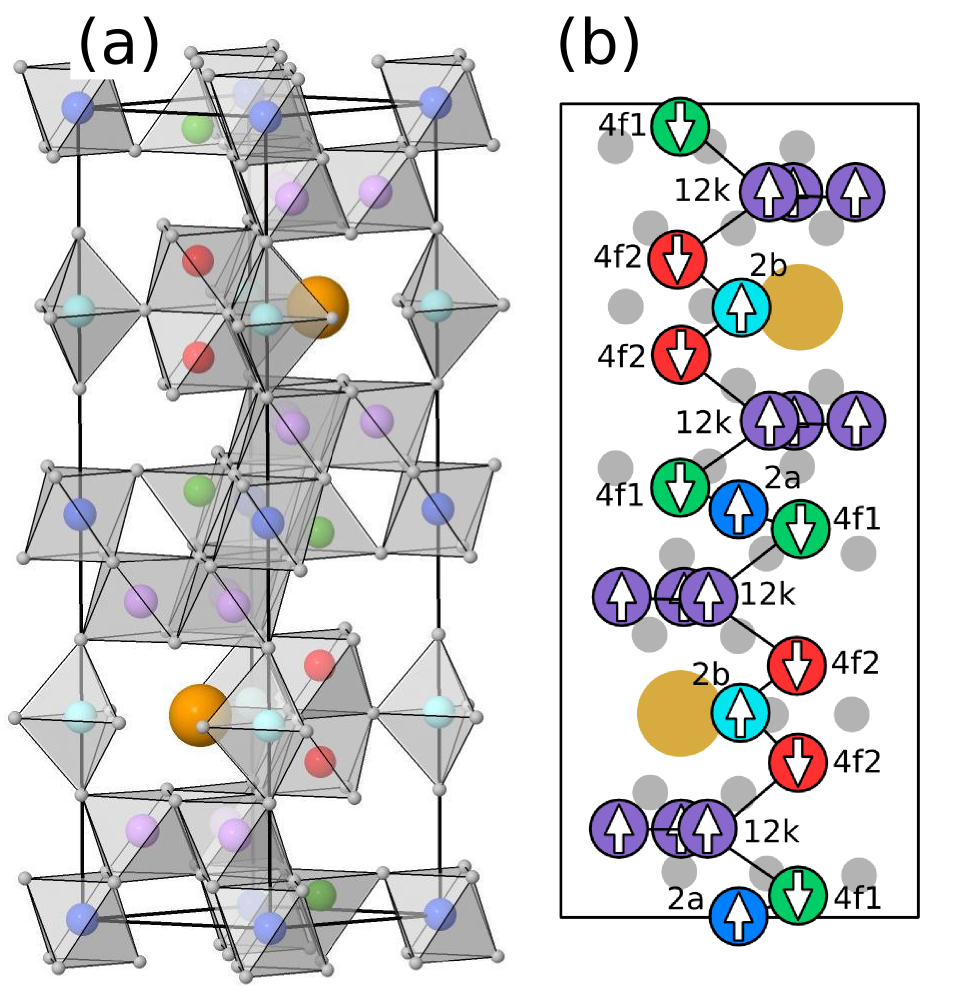
SFO has a hexagonal magnetoplumbite crystal structure that belongs to space group. Fig. 1 shows a unit cell of SFO used in the present work that contains 64 atoms of two formula units. Magnetism in SFO arises from Fe3+ ions occupying five crystallographically inequivalent sites in the unit cell, three octahedral sites (, , and ), one tetrahedral site (), and one trigonal bipyramidal site () as represented by the polyhedra in Fig. 1(a). SFO is also a ferrimagnetic material that has 16 Fe3+ ions with spins in the majority direction (, , and sites) and 8 Fe3+ ions with spins in the minority direction ( and sites) as indicated by the arrows in Fig. 1(b).
Total energies and forces were calculated using DFT with projector augmented wave (PAW) potentials as implemented in VASP Kresse and Furthmüller (1996); Kresse and Joubert (1999). All calculations were spin polarized according to the ferrimagnetic ordering of Fe spins as first proposed by Gorter Fang et al. (2003); Gorter (1957). A plane-wave energy cutoff of 520 eV was used both for pure SFO and Al-substituted SFO. Reciprocal space was sampled with a Monkhorst-Pack mesh Monkhorst and Pack (1976) with a Fermi-level smearing of 0.2 eV applied through the Methfessel-Paxton method Methfessel and Paxton (1989). We performed relaxation of the electronic degrees of freedom until the change in free energy and the band structure energy was less than eV. We performed geometric optimizations to relax the positions of ions and cell shape until the change in total energy between two ionic step was less than eV. Electron exchange and correlation was treated with the generalized gradient approximation (GGA) as parameterized by the Perdew-Burke-Ernzerhof (PBE) scheme Perdew et al. (1996). To improve the description of localized Fe electrons, we employed the GGA+U method in the simplified rotationally invariant approach described by Dudarev et al Dudarev et al. (1998). This method requires an effective value () equal to the difference between the Hubbard parameter and the exchange parameter . We chose equal to 3.7 eV for Fe based on the previous result Liyanage et al. (2013).
III Results and Discussion
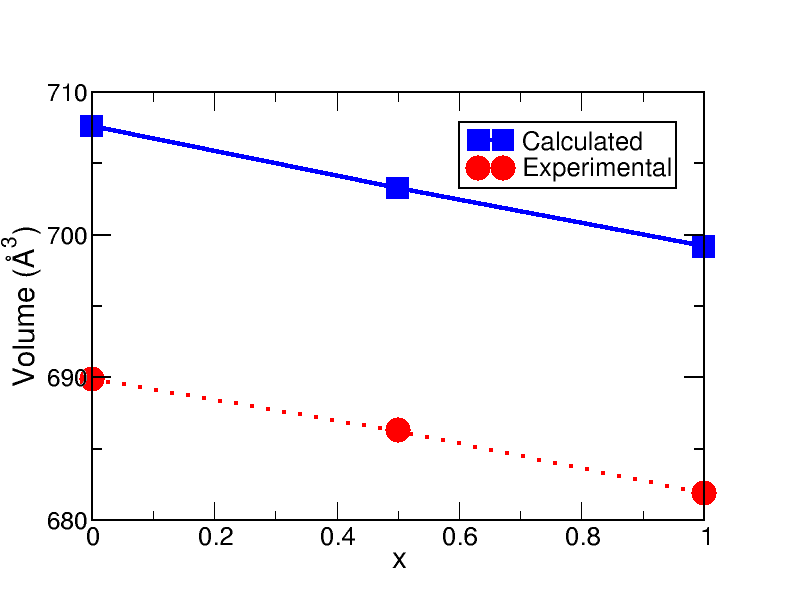
The substitution of Fe3+ ions by Al3+ ions considerably affects the unit cell parameters. We have calculated the lattice parameters of pure and Al-substituted SFO by relaxing ionic positions as well as the volume and shape of the unit cell. In all cases the final unit cell was found to remain hexagonal. In the case of pure SFO, the lattice parameters and were found to be 5.93 Å and 23.21 Å in good agreement with the experimental values of Å and Å, respectively Luo et al. (2012); Kimura et al. (1990); the deviation between the experimental and the theoretical values is less than 1%. In the case of in SrFe12-xAlxO19 the lattice parameters and were calculated to be Å and Å respectively, while the volume of the unit cell was reduced by 0.61%. For , Å and Å were found, and reduction in the unit cell volume was 2.51%. Fig. 2 shows that the reduction of unit cell volume predicted by our DFT calculation is consistent with the experimental results Wang et al. (2012); Luo et al. (2012).
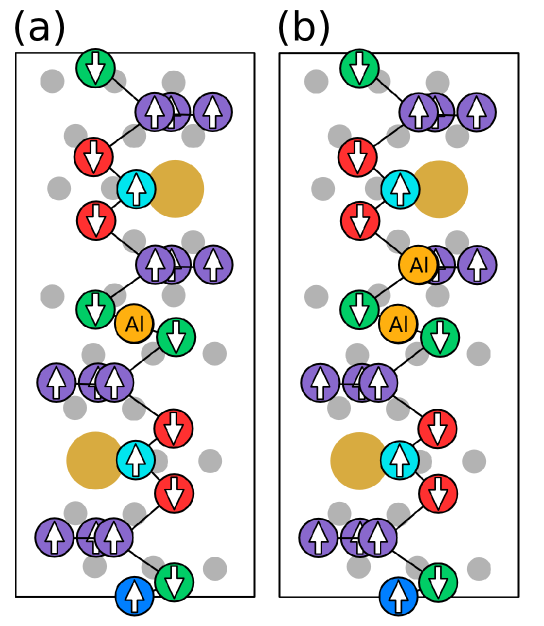
We investigated the site preference of Al substituting Fe in SrFe12-xAlxO19 for (i) and, (ii) . The case corresponds to the condition where one Al atom is substituted in the unit cell, while two Al atoms were substituted in the case of as shown Fig. 3. To determine the site preference of the substituted Al atoms, the substitution energy of configuration was calculated using the following expression:
| (1) |
where is the total energy per unit cell at 0 K for SFAO in configuration while is the total energy per unit cell at 0 K for SFO. is the total energy per atom for element ( = Al, Fe) at 0 K in its most stable crystal structure. is the number of atoms of type added: if two atoms are added then while when one atom is removed. The configuration with the lowest is concluded to be the ground state configuration, and the corresponding substitution site is the preferred site of Al atoms at 0 K.
To understand the site preference of the substituted Al3+ ions at higher temperatures, we compute the formation probability of configuration using the Maxwell-Boltzmann statistical distribution Liu et al. (2014):
| (2) |
where is the multiplicity of configuration (number of equivalent configurations) and
| (3) |
is the change of the free energy of configuration relative to that of the ground state configuration; , , and are the substitution energy change, volume change, entropy change for configuration ; and are the pressure and Boltzmann constant.
For the concentration, one Al atom is substituted at one of the 24 Fe sites of the unit cell as shown in Fig. 3(a). The application of crystallographic symmetry operations shows that many of these Fe sites are equivalent and leaves only five inequivalent structures. We label these inequivalent configurations using the crystallographic name of the Fe site: , , , , and . These structures were created by substituting one Al atom to the respective Fe site of a SFO unit cell and performing full optimization of the unit cell shape and volume, and ionic positions.
| Config | ||||
|---|---|---|---|---|
| 2 | -6.04 | 35 | -5 | |
| 12 | -6.00 | 35 | -5 | |
| 4 | -5.63 | 45 | +5 | |
| 2 | -5.60 | 35 | -5 | |
| 4 | -5.57 | 45 | +5 |
Table 1 lists the results of our calculation for all five inequivalent configurations in the order of increasing substitution energy. The lowest is found for configuration shown in Fig. 1(a). We can conclude that at 0 K the most preferred site for the substituted Al atom is the site. We used Eq. (2) to compute the probability to form each configuration as a function of temperature. Since the volume change among different configurations is very small (less than 0.1 ), we can safely regard term to be negligible (in the order of eV at the standard pressure of 1 atm) compared to the term in Eq. (3). The entropy change has a configurational part, , and a vibrational part, van de Walle and Ceder (2002). For binary substitutional alloys such as the present system, is around 0.1-0.2 /atom, and is 0.1732 /atom Liu et al. (2014). Therefore, we set /atom.
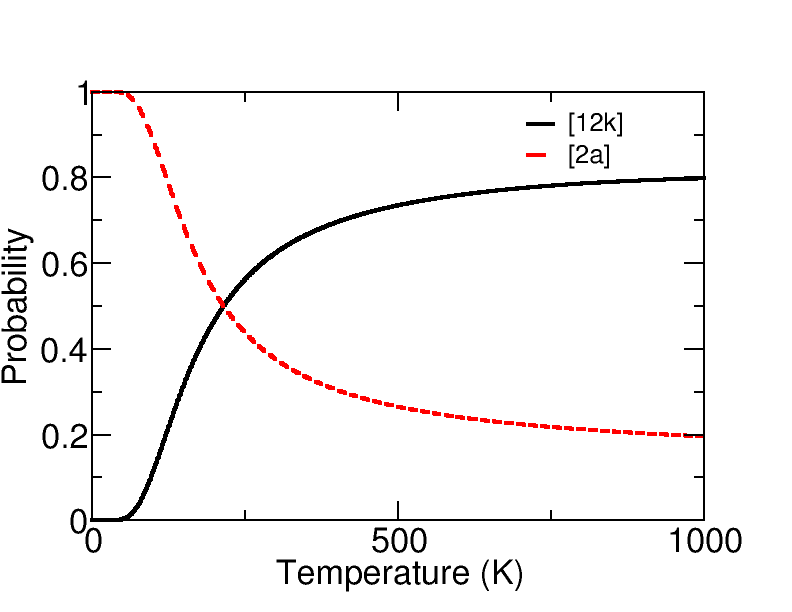
Fig. 4 displays the temperature dependence of the formation probability of different configurations of SrFe12-xAlxO19 with . The doped Al3+ ions mainly replace Fe3+ ions from the and the sites. The formation probabilities of , and are negligible and not shown in Fig. 4. The probability that the doped Al3+ ion replaces Fe3+ ion from the site is maximum at 0 K and it falls as temperature increases, while the occupancy of Al3+ at the site rises with temperature. The two curves cross at K. At a typical annealing temperature of 1000 K for SFAO Wang et al. (2012) the site occupation probability of the site and is 0.196 and 0.798, respectively. Thus, during the annealing process of the synthesis of the SFAO the doped Al3+ ions are more likely to replace Fe3+ ions from the site than the site despite of higher substitution energy.
For the concentration, two Al atoms are substituted at two of the 24 Fe sites of the unit cell as shown in Fig. 3(b). These Fe sites have more than one equivalent site. Substitution of Al atoms breaks the symmetry of the equivalent sites of pure SFO. Out of all possible structures, many of the structures are crystallographically equivalent. On applying crystallographic symmetry operations, the number of inequivalent structures reduces to 40. We label these inequivalent configurations using the convention of [(site for the first Al),(site for the 2nd Al)].(unique index). For example, when two Al atoms are substituted at the and sites, there are 2 inequivalent configurations, which are labeled as and . These structures are fully optimized and their substitution energies are calculated using Eq. (1). When there are more than one inequivalent configuration, we assign the unique index in the order of increasing .
| Config | ||||
|---|---|---|---|---|
| 1 | -6.056 | 30 | -10 | |
| 12 | -6.054 | 30 | -10 | |
| 12 | -6.041 | 30 | -10 | |
| 6 | -6.025 | 30 | -10 | |
| 12 | -6.025 | 30 | -10 | |
| 12 | -6.027 | 30 | -10 | |
| 12 | -6.025 | 30 | -10 | |
| 6 | -6.023 | 30 | -10 | |
| 6 | -6.017 | 30 | -10 | |
| 12 | -6.014 | 30 | -10 |
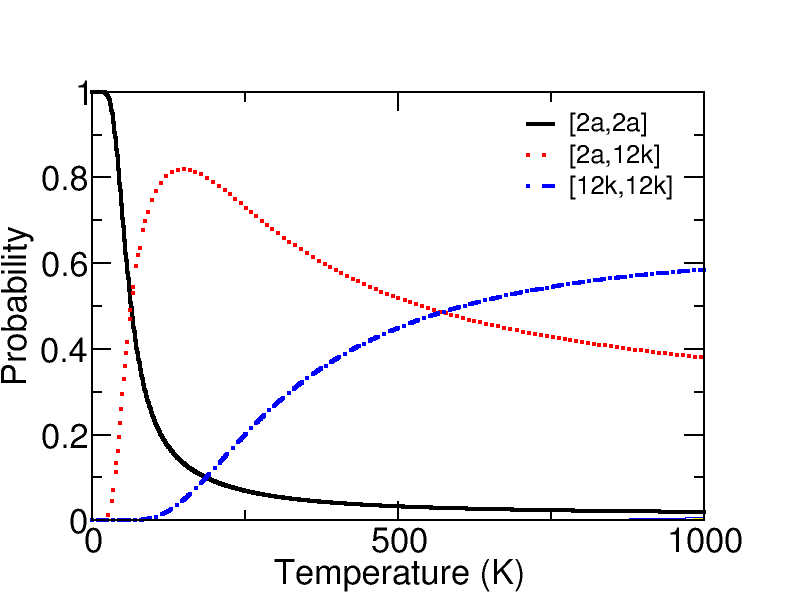
Table 2 lists the ten lowest energy configurations of SrFe12-xAlxO19 with . The configuration where two Al3+ ions replace Fe3+ ions from two sites has the lowest , and it is the most energetically favorable configuration at 0 K. To investigate the site occupation at nonzero temperatures we compute the formation probability of each configuration using Eq. (2). Similar to the previous case the volume change among different configurations is very small (less than 0.7 ) and we can safely ignore the term. The entropy term is calculated in the same way as the case. Fig. 5 shows the variation of the formation probability of different configurations with temperature. We note that due to low multiplicity of the configuration , its formation probability falls rapidly as temperature increases. On the other hand, the formation probability of the configuration (sum of the formation probabilities for all configurations) increases steeply and reaches a maximum value at 50 K and then falls with temperature. Fig. 5 shows that the formation probability of the configuration becomes larger that that of beyond K, which is a much lower transition temperature than in the case.
We can calculate the occupation probability of Al at nonzero temperatures for a given site by adding all formation probabilities of the configurations where at least one Al3+ ion is substituted in that site. At the annealing temperature of 1000 K, the occupation probability of Al for site is 79.8% for as given in Table 4. The same probability is increased to 97.7% for as calculated by adding the ’s for all configurations that contain the site. This means that the fraction of Al3+ ions occupying the site increases when the fraction of Al is increased from to . This conclusion is in agreement with the previously reported measurements Bertaut et al. (1959); Albanese (1995); Wang et al. (2012).
| site | SFO | ||||||||||
| atoms | atoms | atoms | atoms | ||||||||
| 2 Sr | -0.006 | 2 Sr | -0.006 | 0.000 | 2 Sr | -0.006 | 0.000 | 2 Sr | -0.006 | 0.000 | |
| 1 Fe | 4.156 | 1 Fe | 4.155 | -0.001 | 1 Al | -0.010 | -4.166 | 1 Al | -0.010 | -4.166 | |
| 1 Fe | 4.156 | 1 Fe | 4.156 | 0.000 | 1 Fe | 4.156 | 0.000 | 1 Fe | 4.156 | 0.000 | |
| 2 Fe | 8.098 | 2 Fe | 8.086 | -0.012 | 2 Fe | 8.100 | 0.001 | 2 Fe | 8.090 | -0.008 | |
| 4 Fe | -16.152 | 4 Fe | -16.189 | -0.037 | 4 Fe | -16.268 | -0.116 | 4 Fe | -16.304 | -0.152 | |
| 4 Fe | -16.384 | 4 Fe | -16.420 | -0.036 | 4 Fe | -16.382 | 0.002 | 4 Fe | -16.418 | -0.034 | |
| 1 Fe | 4.172 | 1 Al | 0.000 | -4.172 | 1 Fe | 4.170 | -0.002 | 1 Al | -0.001 | -4.173 | |
| 11 Fe | 45.884 | 11 Fe | 45.861 | -0.023 | 11 Fe | 45.872 | -0.012 | 11 Fe | 45.846 | -0.038 | |
| 4 O | 1.416 | 4 O | 1.304 | -0.112 | 4 O | 1.424 | 0.008 | 4 O | 1.316 | -0.100 | |
| 4 O | 0.360 | 4 O | 0.281 | -0.079 | 4 O | 0.310 | -0.050 | 4 O | 0.230 | -0.129 | |
| 6 O | 0.124 | 6 O | 0.115 | 0.009 | 6 O | 0.134 | 0.010 | 6 O | 0.117 | -0.007 | |
| 12 O | 1.016 | 12 O | 0.877 | -0.129 | 12 O | 0.548 | -0.468 | 12 O | 0.404 | -0.612 | |
| 12 O | 2.140 | 12 O | 1.895 | -0.245 | 12 O | 2.088 | -0.052 | 12 O | 1.839 | -0.301 | |
| 38.980 | 34.114 | -4.837 | 34.136 | -4.845 | 29.259 | -9.720 | |||||
| 40 | 35 | -5 | 35 | -5 | 30 | -10 | |||||
In Table 3 we compare the contribution of different sublattices to the total magnetic moment in Al-substituted SFO. To see the effect of Al3+ ions in different substitution sites, we split the entries of sublattices containing these ions ( and ). As expected, Al3+ ions carry negligible magnetic moment regardless of their substitution sites. Consequently, when they replace Fe3+ ions in the minority spin sites ( and ), they eliminate a negative contribution and hence increase the total magnetic moment. On the other hand, when they replace Fe3+ ions in the majority spin sites (, , and ), they eliminate a positive contribution and hence reduce the total magnetic moment. For the case, the most probable sites are and (majority sites) and the net magnetic moment of the unit cell is reduced by 5 . For the configuration of the case, two Al atoms are substituted in the and sites, there is a reduction of 10 in the total magnetic moment per unit cell.
| Config | MAE | |||||||||
| 0.0 | SFO | 0.85 | 707.29 | 193 | 110.19 | 193 | 7.35 | |||
| 0.5 | 0.95 | 703.29 | 216 | 96.49 | 189 | 8.18 | ||||
| 0.80 | 703.19 | 182 | ||||||||
| 0.67 | 702.82 | 152 | ||||||||
| 0.86 | 704.22 | 196 | ||||||||
| 0.83 | 702.58 | 189 | ||||||||
| 1.0 | 0.99 | 698.94 | 227 | 83.03 | 184 | 9.23 | ||||
| 0.88 | 699.08 | 202 | ||||||||
| 0.75 | 698.66 | 172 | ||||||||
| 0.78 | 690.64 | 181 | ||||||||
| 0.80 | 700.29 | 183 | ||||||||
| 0.62 | 698.98 | 142 | ||||||||
| 0.80 | 697.96 | 184 | ||||||||
| 0.83 | 699.62 | 191 | ||||||||
| 0.60 | 698.82 | 138 | ||||||||
| 0.90 | 698.53 | 206 | ||||||||
| 0.86 | 701.38 | 196 | ||||||||
| 0.65 | 699.95 | 149 | ||||||||
| 0.91 | 700.11 | 208 | ||||||||
| 0.45 | 698.86 | 103 | ||||||||
| 0.74 | 698.82 | 170 |
Magnetic Anisotropy determines the capacity of a magnet to withstand external magnetic and electric fields. This property is of considerable practical interest, because anisotropy is exploited in the design of the most magnetic materials of commercial importance. The magnetocrystalline anisotropy energy (MAE) is one of the main factors that determine the total magnetic anisotropy of the material. To investigate the effect of Al substitution on the magnetic anisotropy of SFO, we computed the MAE and the magnetic anisotropy constant of SrFe12-xAlxO19 for and . The MAE, in the present case, is defined as the difference between the two total energies where electron spins are aligned along two different directions Ravindran et al. (1999):
| (4) |
where is the total energy with spin quantization axis in the magnetically hard plane and is the total energy with spin quantization axis in the magnetically easy axis. Using the MAE, the uniaxial magnetic anisotropy constant can be computed Muñoz et al. (2013); Smit and Wijn (1959)
| (5) |
where is the equilibrium volume of the unit cell and is the angle between the two spin quantization axis orientations (90∘ in the present case). The anisotropy field can be expressed as Kittel (1949)
| (6) |
where is a magnetocrystalline anisotropy constant and is saturation magnetization.
The results for the MAE, the magnetocrystalline anisotropy constant , and anisotropy field for SFAO with different Al concentration are presented in Table 4. To compare with experimental results, we also compute the weighted average of and using the formation probability at a typical annealing temperature of 1000 K Wang et al. (2012). We note that SFAO considered in the present work loses most of its magnetic properties at typical annealing temperatures (1000 K or higher) that are near or above its Curie temperature. The magnetic properties listed in Table 4 refer to their ground state properties at the temperature . We use the formation probability at 1000 K to compute the weighted averages as the crystalline configurations of SFAO will be distributed according to this value during the annealing process.
Table 4 shows that decreases as the concentration of Al is increased from 0 to 0.5 to 1.0, consistent with the previous experimental results Albanese and Deriu (1979); Harward et al. (2013); Ustinov et al. (2009); Wang et al. (2012). Our calculation also shows that decreases as the concentration of Al is increased from 0 to 0.5 to 1.0. At a low temperature Al atoms prefer to occupy the sites, which would have increased (see values for and in Table 4). However, the formation probability of the configurations involving site (such as , and ) increases significantly as the temperature rises due to the entropy contribution of the free energy. At the annealing temperature Al3+ ions are much more likely to occupy the site than the site. This causes the magnetocrystalline anisotropy constant of Al-substituted SFO to be reduced with the increase of Al fraction , consistent with the experimental measurement reported by Albanes Albanese and Deriu (1979). Despite of this, is reduced more significantly than and this causes the anisotropy field in Eq. (6) to increase as the concentration of Al is increased from 0 to 0.5 to 1.0 as shown in Table 4. This result is consistent with several experimental results Ustinov et al. (2009); Wang et al. (2012).
IV Conclusions
Using the first-principles total energy calculations based on density functional theory, we obtained the ground state structures and associated formation probabilities at finite temperatures for Al-substituted SFO, SrFe12-xAlxO19 with and . The structures derived from our calculations show that the total magnetic moment of the SFO unit cell is reduced as the fraction of Al atoms increases. This reduction of magnetization is explained by the fact that the non-magnetic Al atoms prefer to replace Fe3+ ions at two of the majority spin sites, and , eliminating their positive contribution to the total magnetization. Our model also explains the increase of the observed anisotropy field when the fraction of Al in SFO is increased. At the annealing temperature Al3+ ions are much more likely to occupy the site than the site. Although this causes the magnetocrystalline anisotropy to decrease slightly, the reduction in the saturation magnetization is larger and their combined effect causes the magnetic anisotropy field of Al-substituted SFO to be reduced with increase of Al fraction . Our results are consistent with the available experimental measurement on Al-substituted SFO.
V Acknowledgments
This work was supported in part by the U.S. Department of Energy ARPA-E REACT program under Award Number DE-AR0000189 and the Center for Computational Science (CCS) at Mississippi State University. Computer time allocation has been provided by the High Performance Computing Collaboratory (HPC2) at Mississippi State University.
References
- Wang et al. (2012) H. Wang, B. Yao, Y. Xu, Q. He, G. Wen, S. Long, J. Fan, G. Li, L. Shan, B. Liu, L. Jiang, and L. Gao, Journal of Alloys and Compounds 537, 43 (2012).
- Pullar (2012) R. C. Pullar, Progress in Materials Science 57, 1191 (2012).
- Pang et al. (2010) Z. Pang, X. Zhang, B. Ding, D. Bao, and B. Han, Journal of Alloys and Compounds 492, 691 (2010).
- Davoodi and Hashemi (2011) A. Davoodi and B. Hashemi, Journal of Alloys and Compounds 509, 5893 (2011).
- Ashiq et al. (2012) M. N. Ashiq, M. J. Iqbal, M. Najam-ul Haq, P. Hernandez Gomez, and A. M. Qureshi, Journal of Magnetism and Magnetic Materials 324, 15 (2012).
- Seifert et al. (2009) D. Seifert, J. Töpfer, F. Langenhorst, J.-M. L. Breton, H. Chiron, and L. Lechevallier, Journal of Magnetism and Magnetic Materials 321, 4045 (2009).
- Wang et al. (2004) J. Wang, C. Ponton, R. Grössinger, and I. Harris, Journal of Alloys and Compounds 369, 170 (2004).
- Wang et al. (2001) J. Wang, C. Ponton, and I. Harris, Journal of Magnetism and Magnetic Materials 234, 233 (2001).
- Wang et al. (2005) J. Wang, C. Ponton, and I. Harris, Journal of Alloys and Compounds 403, 104 (2005).
- Wang et al. (2002) J. Wang, C. Ponton, and I. Harris, IEEE Transactions on Magnetics 38, 2928 (2002).
- Fang (2004) Q. Fang, Journal of Applied Physics 95, 6360 (2004).
- Ghasemi et al. (2010) A. Ghasemi, V. Šepelák, X. Liu, and A. Morisako, Journal of Applied Physics 107, 09A734 (2010).
- Ghasemi and Šepelák (2011) A. Ghasemi and V. Šepelák, Journal of Magnetism and Magnetic Materials 323, 1727 (2011).
- Liyanage et al. (2013) L. S. Liyanage, S. Kim, Y.-K. Hong, J.-H. Park, S. C. Erwin, and S.-G. Kim, Journal of Magnetism and Magnetic Materials 348, 75 (2013).
- Liu et al. (2010) W. Liu, H. Sun, X. Yi, X. Liu, D. Zhang, M. Yue, and J. Zhang, Journal of Alloys and Compounds 501, 67 (2010).
- Bertaut et al. (1959) E. Bertaut, A. Deschamps, R. Pauthenet, and S. Pickart, J. Phys. Radium 20, 404 (1959).
- Wang et al. (2000) S. Wang, J. Ding, Y. Shi, and Y. Chen, Journal of Magnetism and Magnetic Materials 219, 206 (2000).
- Liu et al. (2011) M. Liu, X. Shen, F. Song, J. Xiang, and X. Meng, Journal of Solid State Chemistry 184, 871 (2011).
- Luo et al. (2012) H. Luo, B. Rai, S. Mishra, V. Nguyen, and J. Liu, Journal of Magnetism and Magnetic Materials 324, 2602 (2012).
- Harward et al. (2013) I. Harward, Y. Nie, D. Chen, J. Baptist, J. M. Shaw, E. Jakubisová Lišková, . Višňovský, P. Široký, M. Lesňák, J. Pištora, and Z. Celinski, Journal of Applied Physics 113, 043903 (2013).
- Fang et al. (2003) C. Fang, F. Kools, R. Metselaar, R. Groot, and Others, Journal of Physics: Condensed Matter 15, 6229 (2003).
- Park et al. (2014) J. Park, Y.-K. Hong, S.-G. Kim, S. Kim, L. S. Liyanage, J. Lee, W. Lee, G. S. Abo, K.-H. Hur, and S.-Y. An, Journal of Magnetism and Magnetic Materials 355, 1 (2014).
- Küpferling et al. (2005) M. Küpferling, P. Novák, K. Knížek, M. W. Pieper, R. Grössinger, G. Wiesinger, and M. Reissner, Journal of Applied Physics 97, 10F309 (2005).
- Novák et al. (2005) P. Novák, K. Knížek, M. Küpferling, R. Grössinger, and M. W. Pieper, The European Physical Journal B - Condensed Matter and Complex Systems 43, 509 (2005), 10.1140/epjb/e2005-00084-8.
- Kresse and Furthmüller (1996) G. Kresse and J. Furthmüller, Phys. Rev. B 54, 11169 (1996).
- Kresse and Joubert (1999) G. Kresse and D. Joubert, Phys. Rev. B 59, 1758 (1999).
- Gorter (1957) E. F. Gorter, Proc. IEEE 104B, 2555 (1957).
- Monkhorst and Pack (1976) H. Monkhorst and J. Pack, Phys. Rev. B 13, 5188 (1976).
- Methfessel and Paxton (1989) M. Methfessel and A. T. Paxton, Phys. Rev. B 40, 3616 (1989).
- Perdew et al. (1996) J. P. Perdew, K. Burke, and M. Ernzerhof, Phys. Rev. Lett. 77, 3865 (1996).
- Dudarev et al. (1998) S. L. Dudarev, G. A. Botton, S. Y. Savrasov, C. J. Humphreys, and A. P. Sutton, Phys. Rev. B 57, 1505 (1998).
- Kimura et al. (1990) K. Kimura, M. Ohgaki, K. Tanaka, H. Morikawa, and F. Marumo, Journal of Solid State Chemistry 87, 186 (1990).
- Liu et al. (2014) X. B. Liu, Y. Ma, Z. Altounian, Q. Zhang, and J. Ping Liu, Journal of Applied Physics 115, 17A702 (2014).
- van de Walle and Ceder (2002) A. van de Walle and G. Ceder, Rev. Mod. Phys. 74, 11 (2002).
- Albanese (1995) G. Albanese, Journal of Magnetism and Magnetic Materials 147, 421 (1995).
- Ravindran et al. (1999) P. Ravindran, A. Delin, P. James, B. Johansson, J. M. Wills, R. Ahuja, and O. Eriksson, Phys. Rev. B 59, 15680 (1999).
- Muñoz et al. (2013) F. Muñoz, A. Romero, J. Mejía-López, and J. Morán-López, Journal of Nanoparticle Research 15, 1524 (2013), 10.1007/s11051-013-1524-6.
- Smit and Wijn (1959) J. Smit and H. Wijn, Ferrites (Philips Technical Library, Eindhoven, 1959).
- Kittel (1949) C. Kittel, Rev. Mod. Phys. 21, 541 (1949).
- Albanese and Deriu (1979) G. Albanese and A. Deriu, Ceramurgia International 5, 3 (1979).
- Ustinov et al. (2009) A. B. Ustinov, A. S. Tatarenko, G. Srinivasan, and A. M. Balbashov, Journal of Applied Physics 105, 023908 (2009).