Ruling out IC/CMB X-rays in PKS 0637-752 and the Implications for TeV Emission from Large-Scale Quasar Jets
Abstract
The Chandra X-ray observatory has discovered dozens of resolved, kiloparsec-scale jets associated with powerful quasars in which the X-ray fluxes are observed to be much higher than the expected level based on the radio-optical synchrotron spectrum. The most popular explanation for the anomalously high and hard X-ray fluxes is that these jets do not decelerate significantly by the kiloparsec scale, but rather remain highly relativistic (Lorentz factors 10). By adopting a small angle to the line-of-sight, the X-rays can thus be explained by inverse Compton upscattering of CMB photons (IC/CMB), where the observed emission is strongly Doppler boosted. Using over six years of Fermi monitoring data, we show that the expected hard, steady gamma-ray emission implied by the IC/CMB model is not seen in PKS 0637-752, the prototype jet for which this model was first proposed. IC/CMB emission is thus ruled out as the source of the X-rays, joining recent results for the jets in 3C 273 (using the same method; Meyer & Georganopoulos, 2014) and PKS 1136-135 (using UV polarization; Cara et al., 2013). We further show that the Fermi observations give an upper limit of 6.5 for the four brightest X-ray knots of PKS 0637-752, and derive an updated limit of 7.8 for knots A and B1 of 3C 273 (assuming equipartition). Finally, we discuss the fact that high levels of synchrotron X-ray emission in a slow jet will unavoidably lead to a level of angle-integrated TeV emission which exceeds that of the TeV BL Lac class.
Subject headings:
galaxies: jets — galaxies: active — quasars: individual (PKS 0637-752, 3C 273)1. Introduction
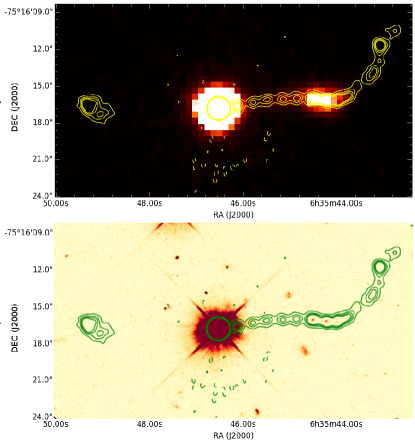
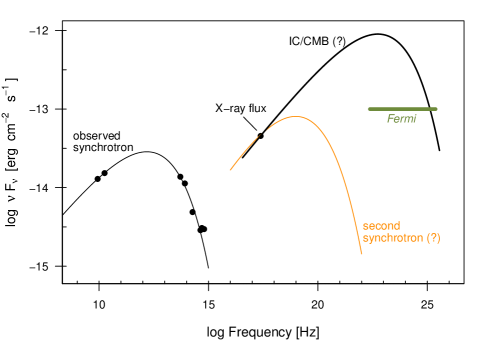
In August 1999, the Chandra X-ray Observatory observed its first celestial target, quasar PKS 0637-752, during the initial focusing of the telescope (Schwartz et al., 2000; Chartas et al., 2000). Along with the bright quasar core, Chandra unexpectedly detected X-rays from the kiloparsec (kpc) scale relativistic jet (previously known from radio imaging, Figure 1). Unlike the synchrotron spectrum of lower-power FR I jets like M87 which easily extend up to X-ray energies (e.g. Wilson & Yang, 2002), the synchrotron spectrum of powerful kpc-scale jets (including PKS 0637-752) generally peak at or below the IR/Optical band. The X-rays detected in the kpc-scale jet of PKS 0637-752 were much brighter than expected from the radio-optical synchrotron spectrum, or indeed from either synchrotron self-Compton (SSC) or inverse Compton upscattering of ambient CMB photons (IC/CMB) assuming mildly relativistic kpc-scale flows under equipartition conditions (Chartas et al., 2000). Further, the X-ray spectrum of the jet was remarkably hard, with a photon index of (Figure 2).
Multi-epoch measurements of sub-parsec scale jets of powerful quasars with Very Long Baseline Interferometry (VLBI) have detected superluminal proper motions which imply that these jets start out highly relativistic, with Lorentz factors () of 10-50 (Jorstad et al., 2005; Lister et al., 2009). Though it had long been supposed based on population studies that jets decelerate and are at most mildly relativistic by the time they reach the kpc scale (e.g. Arshakian & Longair, 2004; Mullin & Hardcastle, 2009), no direct measurements have confirmed this. Tavecchio et al. (2000) and Celotti et al. (2001) thus suggested that the X-rays from the jet in PKS 0637-752 could be explained by IC/CMB emission if the jet remained highly relativistic (10), and was pointed at a fairly small angle to our line of sight (6∘). This produces a much larger Doppler boosting factor (10) and enables the IC/CMB X-ray flux to match the observations.
Over the past decade and a half since the launch of Chandra, dozens more kpc-scale quasar jets with anomalously hard and/or high X-ray fluxes have been detected (e.g. Sambruna et al., 2001, 2002; Siemiginowska et al., 2003; Sambruna et al., 2004; Marshall et al., 2005; Harris & Krawczynski, 2006; Siemiginowska et al., 2007; Marshall et al., 2011; Kharb et al., 2012; Godfrey et al., 2012a). The IC/CMB model has been by far the most popular explanation of these X-rays, though problems have been noted (e.g Hardcastle, 2006; Harris & Krawczynski, 2006). Besides the unconfirmed fast speeds required on the kpc scale, IC/CMB often requires the jet to be pointed very close along our line-of-sight, leading to a deprojected jet length longer than 1 Mpc, comparable to, or greater than the largest known giant radio galaxies (Dermer & Atoyan, 2004). Further, the electrons responsible for upscattering the CMB into the Chandra band are at much lower energies than are traced by radio observations. This extension of the electron energy distribution is energetically costly, in some cases leading to ‘super-Eddington’ jet power requirements (Dermer & Atoyan, 2004; Uchiyama et al., 2006). Georganopoulos & Kazanas (2004) also noted that the commonly observed severe decrease in X-ray to radio flux ratio with distance down the jet (e.g. 3C 273, Jester et al., 2006) can only be reconciled with IC/CMB X-rays if the jet is strongly decelerating. Hardcastle (2006), seeking to verify this for a sample of quasar jets, also noted that this explanation still leaves significant discrepancies with observations, namely the lack of similar deceleration profiles at kpc-scales for more misaligned jets. These problems lead to the suggestion that the X-rays could alternatively be synchrotron emission from a second electron population in the jet, albeit of unknown origin (Atoyan & Dermer, 2004; Harris et al., 2004; Kataoka & Stawarz, 2005; Hardcastle, 2006; Jester et al., 2006; Uchiyama et al., 2006).
Despite a significant effort by the community to amass high-resolution radio, optical, and X-ray imaging of dozens of quasar jets, the fundamental problem up to now has been that fitting the radio-to-X-ray spectral energy distribution (SED) alone cannot distinguish between the IC/CMB and synchrotron explanations for the X-rays (Cara et al., 2013). The difference in power requirements between the two mechanisms is great, as is the extremely different idea of jet structure that they imply. Discriminating between these models is essential to make progress on the the physics of jets and their impact on their environments.
It was with an eye to resolving this long-standing deadlock that Georganopoulos et al. (2006), hereafter G06, suggested that Fermi Large Area Telescope (LAT) observations could confirm or rule out the IC/CMB mechanism for the X-rays, by detecting (or not) the high level of gamma-ray emission this mechanism predicts (Figure 2). We have previously looked for this gamma-ray emission from the jet of 3C 273, and ruled out IC/CMB gamma-rays from (the brightest) knot A alone at the 95% level, and from knots A through D1 combined at the 99.9% level (Meyer & Georganopoulos, 2014, hereafter M14).
In this paper we report new Fermi observations of PKS 0637-752 which show that the expected steady gamma-ray emission from the IC/CMB mechanism is also ruled out by deep upper limits at the 99.9% level. We also present updated limits for 3C 273, showing that the expected gamma-rays from IC/CMB are now ruled out at the 99.99% level in more than one Fermi energy band. We show that the deep upper limits at GeV energies place interesting constraints on the Doppler beaming factors which implies that these jets are not highly relativistic on the kpc scale. We further discuss the surprising implications of slow, synchrotron X-ray jets on our understanding of the total radiative output of quasars, especially at TeV energies.
2. Methods
2.1. The Fermi Test of IC/CMB
As first noted by G06, the shape of the IC/CMB spectrum is constrained to match the synchrotron spectrum, with a shift in frequency and luminosity solely determined by the factor where is the Doppler beaming factor and the magnetic field strength. From G06, we have:
| (1) |
| (2) |
where and (, ) are the observed Compton and synchrotron frequencies (luminosities) emitted by electrons of Lorentz factor , and are the electron charge and mass, and = 1.6 Hz is the CMB peak frequency at z = 0. However, if the observed X-ray fluxes are to be produced by the IC/CMB mechanism, then the value of is already uniquely determined by the requirement to match the X-ray flux level, at which point there is no freedom at all in the rest of the spectrum. The peak of the IC/CMB spectrum will fall in the GeV band, as shown in Figure 2. Note that this prediction is not predicated on any particular (e.g., equipartition) magnetic field strength.
The Fermi/LAT lacks the spatial resolution to detect the jet separately from the gamma-ray bright quasar core, which is only 10′′ away – the Fermi/LAT 68% containment radius is on the order of tenths of a degree to degrees. However, in powerful quasars the inverse Compton core emission generally peaks at a few MeV, producing a soft and extremely variable spectrum in the Fermi band, with long periods of relative quiescence. Indeed, PKS 0637-752 was detected in the 2nd Fermi source catalog (2FGL, Nolan et al., 2012) as source 2FGL J0635.5-7516, with a very soft spectrum (photon index of =2.71) and high degree of variability (variability index = 347). In contrast, the IC/CMB emission from the large scale jet is expected to be harder and completely non-variable. The latter property allows us to combine the Fermi data taken only when the quasar core is in a low state to try to detect or place limits on the IC/CMB emission.
2.2. Fermi Analysis of PKS 0637-752
We first combined the all-sky weekly LAT event and spacecraft files for weeks 9 through 325 of the Fermi mission, corresponding to Fermi Mission Elapsed Time (MET) from 239557417 to 430608212 and calendar dates 2008 August 4 to 2014 August 24. In order to analyze the region around PKS 0637-752, we used the publicly available ‘quickAnalysis’ script111The public scripts mentioned in the text are available at http://fermi.gsfc.nasa.gov/ssc/data/analysis/user/. to run the Fermi analysis tools and generate the filtered event file, livetime cube, and exposure map, using a region of interest (ROI) of 10∘ and an otherwise default configuration. The starting source list was generated from the publicly available make2FGLxml script, which generates the xml file pre-populated with 2FGL catalog sources. We used a binned maximum likelihood to get an initial fit for all the catalog sources in our ROI. We also included sources a further 5∘ out from our ROI, but with spectral parameters fixed to the 2FGL catalog values. PKS 0637-752 was detected with a very high test-statistic (TS, roughly significance squared) value of 289, a 100 MeV to 100 GeV photon flux of 3.16 s-1 cm-2, and a photon index = 2.64, similar to the value reported in the 2FGL catalog.
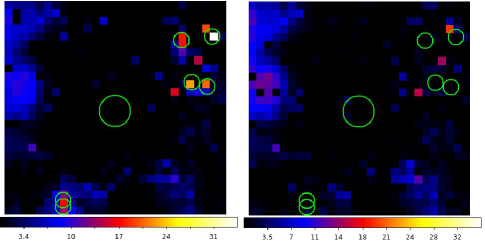
We checked for additional significant sources within 7∘ of PKS 0637-752 but not in the 2-year LAT catalog by making a TS residual map. The TS map was created by first freezing all source parameters in the initial model to their best-fit values, and then checking what TS value a test point source at different locations would be given. The resulting initial TS map is shown at left in Figure 3. In two areas the coarse 0.5∘ binning did not allow separation of what appeared to be multiple components, and so a finer 0.125∘ binning was used over these smaller areas to determine the rough location of new sources.
| near PKS 0637-752 | near 3C 273 | ||||
|---|---|---|---|---|---|
| RAJ2000 | DecJ2000 | TS | RAJ2000 | DecJ2000 | TS |
| (deg) | (deg) | (deg) | (deg) | ||
| 82.43046 | -72.74572 | 57.5 | 192.82676 | -2.00263 | 70.7 |
| 81.13040 | -69.60575 | 60.5 | 190.96827 | -2.29561 | 82.3 |
| 78.98804 | -72.72570 | 28.6 | 187.15935 | -3.29476 | 60.2 |
| 86.33797 | -70.34640 | 39.6 | 184.47577 | -0.48239 | 92.5 |
| 119.70430 | -80.70430 | 9.9 | 193.43690 | 3.47391 | 224.6 |
| 118.83300 | -80.32970 | 16.1 | 192.63313 | 2.25116 | 65.7 |
Rough starting positions of apparent new significant sources were measured from the TS map by hand, only considering as candidates those with a central pixel value (TS) 20. Each potential new source was then localized one at a time as follows. A power-law point source was added at the rough location of the excess TS, with normalization and powerlaw index free. Sources within 5∘ of the new source also had normalization/index parameters free. We ran a binned likelihood to get a starting fit for the new source plus other sources in the area. The fit parameters were then frozen again, so that we could next optimize the RA/Dec location of the new source. The existing tool, gtfindsrc, only works for unbinned likelihood analysis, so we built our own binned version of the tool which works in the same way. Using the frozen model, we used the python minimize function in the scipy package (L-BFGS-B method) to optimize the log-likelihood value versus the RA and Dec position, given a reasonable range of about 1 degree around the starting positions noted by hand. We then update our new source in the model with this optimized position (positions always remain fixed when optimizing over spectral parameters). We un-freeze the normalization and index of the new source and the local sources and run a final binned likelihood optimization to get an updated model of all sources in the ROI. This is then the starting model for the next new source to be added, until all new sources have been localized and a final optimized fit derived. For the 7∘ ROI around PKS 0637-752, six new sources were added to the model, and an updated TS map run from this larger source list shows that the excess TS previously seen is now gone (right panel of Figure 3). A list of the new sources with their location and TS value is given at left in Table 1.
As the PKS 0637-752 core is a significant Fermi source, our approach to detecting and/or setting limits on the IC/CMB gamma-ray emission exploits the variability of the core which cannot be spatially resolved separately from the large-scale jet due to the poor angular resolution of Fermi. During times when the blazar is quiescent, the hard, steady emission from IC/CMB will either appear as a steady plateau, or else the upper limits generated will place constraints on the level of the IC/CMB emission.
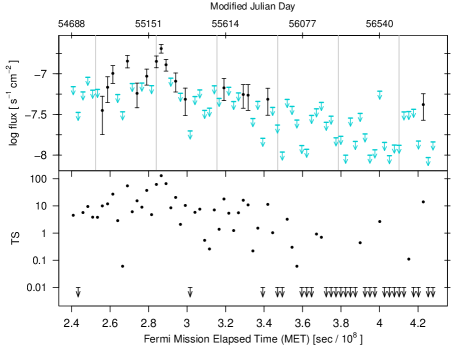
In order to build a lightcurve of the core, the full 6-year dataset was divided into bins of equal good time interval (GTI) time, totaling 10.5 days. We then used our updated (2FGL + 6 new) model described above and ran a binned likelihood to fit PKS 0637-752 as a power-law source, with sources more than 5∘ away fixed. The resulting lightcurve for the core over the full time range is shown in Figure 4, with the 100 MeV - 100 GeV photon flux shown on top and the corresponding TS shown below. The clear variability in the light curve indicates that the total Fermi flux is dominated by the core.
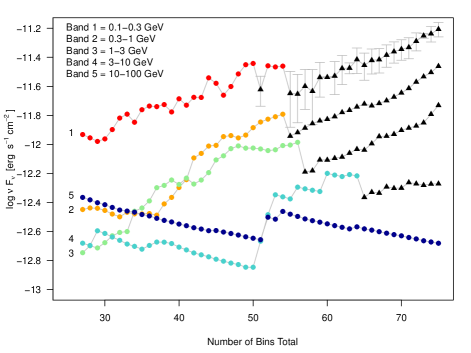
We next began a ‘progressive binning’ analysis, in which the lightcurve bins were ordered from lowest to highest TS value. Of the entire set of 75 time bins, 27 showed a TS level consistent with zero for the location of PKS 0637-752 (upper limits in lower panel of Figure 4). Starting from these 27 bins combined, we progressively combine the event files for the lowest bins plus the next lowest bin in TS, at each step optimizing the fit of PKS 0637-752 and the sources within 5∘ with a binned likelihood. We repeated adding the next-highest bin and getting the maximum likelihood fit until all bins had been added together. Note that this re-combining of the lightcurve in a discontinuous way is appropriate for deriving a limit on the large-scale jet because the IC/CMB emission is predicted to be completely non-variable, and thus there is no risk of any selection effect via variability. The variable core clearly dominates the flux levels determining the ordering, and is disconnected from the jet in any case. At each step we evaluated the TS and flux level in the five canonical Fermi energy bands of 0.1-0.3, 0.3-1, 1-3, 3-10 and 10-100 GeV, calculating the 95% upper limit flux value when TS10 in any given bin. Previous work on 3C 273 has shown that the exact method of ordering the bins (whether by using the TS value or the total flux or upper limit value for the bin) does not significantly affect the order or resulting upper limits (M14).
As shown in Figure 5, the highest energy bands gave upper limits which decreased with the increasing exposure as more bins are added, where we have color-coded the upper limits in the 5 energy bands, and black triangles indicate a significant detection in the band. Note that in the lower-energy bins, where the PKS 0637-752 quasar core dominates due to its soft spectrum, the upper limits reach a minimum rather quickly, and generally increase before becoming detections. It must be noted that the detected gamma-ray emission in these bands is from the quasar core, not the large-scale jet, based on the soft spectrum, and the fact that the emission level rises as more bins are added (showing that the source is indeed variable and that the bins are ordered by flux level). If we were to detect the large-scale jet, we would expect it to contribute significantly in the two highest-energy Fermi bands, and also to remain steady in flux level after the exposure became long enough to detect it. This latter point is important for distinguishing a detection of IC/CMB gamma-rays versus the tail of the Compton emission from the core, which should (like the low-energy bins) rise in flux as more bins are added. While the fourth energy band detected points do not rise as quickly as the first three, the flux level is far above the upper limit derived after 50 bins, so cannot be the steady emission of the large-scale jet, which must be below this limit. The highest bin never shows a significant detection of either component.
2.3. Fermi Analysis of 3C 273
We re-analyzed the Fermi data for 3C 273 using the 6-year dataset to compare with the results from M14 using 4.5 years of data, as the core remained relatively quiescent over the additional time elapsed. We followed the same procedure as outlined above for PKS 0637-752, finding six new sources within 7∘ of the position of 3C 273, listed at right in Table 1. The core of 3C 273 was detected with a TS of 17504, with a 100 MeV - 100 GeV photon flux of 3.68 s-1 cm-2 and = 2.67. A lightcurve was made using bins totaling 10.5 days in GTI time, and ordered according to TS (a total of 88 bins). The progressive-binning was started from the single lowest bin, with the next-highest bin continually added as described above until all bins were added. At each step the flux (or 95% upper limit) was calculated for the five canonical Fermi energy bins, as for PKS 0637-752.
| Source | Band | log Freq. | 95% Limit | Bins | Combined Knots**Combined Knots are wk7.8, wk8.9, wk9.7, and wk10.6 for PKS 0637-752, knots A and B1 for 3C 273 | Single Knot$\dagger$$\dagger$Single Knots are wk8.9 for PKS 0637-752 and knot A for 3C 273 | ||||
|---|---|---|---|---|---|---|---|---|---|---|
| (GeV) | (GeV) | (Hz) | (erg s-1 cm-2) | Added | % Ruled | % Ruled | ||||
| (erg s-1 cm-2) | Out | (erg s-1 cm-2) | Out | |||||||
| (1) | (2) | (3) | (4) | (5) | (6) | (7) | (8) | (9) | (10) | (11) |
| 0637-752 | 1 | 0.1 | 0.3 | 22.6 | 1.05 | 29 | 9.0 | 92.9 | 3.6 | … |
| 2 | 0.3 | 1 | 23.1 | 3.17 | 32 | 8.8 | 99.8 | 3.6 | 94.5 | |
| 3 | 1 | 3 | 23.6 | 1.80 | 27 | 7.4 | 99.98 | 3.2 | 98.7 | |
| 4 | 3 | 10 | 24.1 | 1.43 | 50 | 5.3 | 99.95 | 2.5 | 98.6 | |
| 5 | 10 | 100 | 24.7 | 2.09 | 75 | 2.3 | 95.9 | 1.3 | … | |
| 3C 273 | 1 | 0.1 | 0.3 | 22.6 | 2.72 | 1 | 2.1 | … | 1.6 | … |
| 2 | 0.3 | 1 | 23.1 | 4.63 | 2 | 2.8 | … | 2.1 | … | |
| 3 | 1 | 3 | 23.6 | 8.20 | 5 | 3.6 | 99.99 | 2.8 | 99.99 | |
| 4 | 3 | 10 | 24.1 | 4.46 | 31 | 4.5 | 99.99 | 3.5 | 99.99 | |
| 5 | 10 | 100 | 24.7 | 3.56 | 30 | 5.2 | 99.99 | 4.1 | 99.99 | |
3. Results: Testing the IC/CMB Model
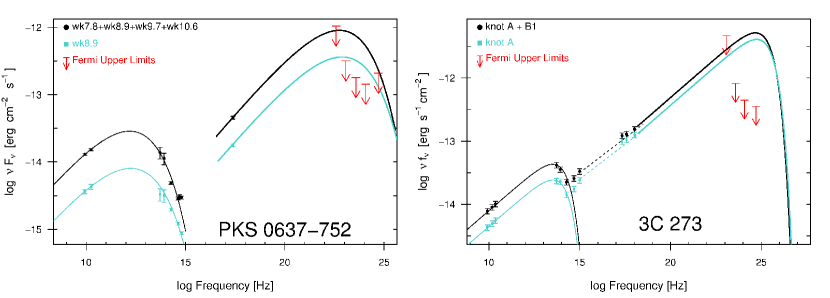
We show in Figure 6 the radio to X-ray SEDs for the jet of both PKS 0637-752 (left) and 3C 273 (right). For PKS 0637-752 we have taken both the Chandra X-ray and Hubble Space Telescope (HST) infrared and optical data (NICMOS, WFPC2 and ACS) from Mehta et al. (2009). We have also re-derived the Spitzer infrared fluxes for the brightest complex of knots (wk7.8, wk8.9, wk9.7, wk10.7), following the same methods reported in Uchiyama et al. (2005). We have also measured updated radio fluxes based on a re-analysis of archival and new ATCA data at 4.8, 8.4, and 17.8 GHz (first published in Godfrey et al., 2012b). For 3C 273, data is taken from Jester et al. (2005, 2006) and Uchiyama et al. (2006) and references therein.
In both figures, we consider two scenarios: the first combines the photometry of the brightest/nearest knots to the core in order to test the IC/CMB prediction (black points and lines). In 3C 273, Jester et al. (2005) have already shown that only knots A and B1 have X-ray indices similar to their radio indices (which is required for IC/CMB), so our “combined knot” scenario includes only these two knots. For PKS 0637-752, we use all the bright X-ray knots just before the turn in the jet (wk7.8, wk8.9, wk9.7, and wk10.6) where one might assume that some deceleration likely takes place. We do not include the only other X-ray detected knot (wk5.7) because it is not consistently detected at other wavelengths. The second scenario assumes that the X-rays from the weaker knots are already not from IC/CMB, and so only the photometry of the X-ray brightest knot is plotted: knot A in 3C 273 and wk8.9 in PKS 0637-752, in both cases plotted as blue points and lines. The thin solid lines through radio-optical points show a (phenomenological) synchrotron spectrum fitting the data, while the heavy line shows the corresponding IC/CMB curve to match the X-ray flux levels. As shown, for both jets, the 95% upper limits in several bands violate the IC/CMB predictions under either scenario.
We report in Table 2 a summary of the Fermi data analysis for PKS 0637-752 and 3C 273. We list the definition of the energy bins in columns 2-5, followed by the deepest 95% upper limit flux level (in ) reached in our progressive binning for each energy bin in column 6. The corresponding number of bins co-added to reach that limit is given in column 7. In column 8 we list the flux predicted under the IC/CMB at the frequency given in column 5. This flux corresponds to the IC/CMB model prediction for the combination of knots wk7.8, wk8.9, wk9.7, and wk10.7 in PKS 0637-752, and knots A and B1 for 3C 273. In column 10, we have calculated at what significance level our observations rule out the level of predicted IC/CMB flux given in column 9. For the final two columns, we also give the predicted flux under IC/CMB and the significance-level that we can rule it out, but only for the X-ray brightest knot of each jet (wk8.9 and knot A, respectively). As shown, the IC/CMB model is ruled out at a 99.9% level for PKS 0637-752 and at 99.99% level for 3C 273 under the combined knot scenarios, and ruled out at the 98.7% level for PKS 0637-752 and at 99.99% level for 3C 273 when considering only the single brightest knot.
4. Discussion
These two cases where the IC/CMB origin for the X-rays has been unambiguously ruled out join with that of PKS 1136-135, where high UV polarization has shown that the second component (UV to X-ray) must be synchrotron in origin, since significant polarization is not expected in the IC/CMB scenario (Cara et al., 2013). The UV polarization method is unfortunately not able to be applied in general, as not all of the known quasar jets show the second component already dominating in the UV, being instead dominated by the radio-optical synchrotron component, though we note that 3C 273 could be confirmed in this way.
With IC/CMB ruled out in these three cases, we must explore alternative sources of X-ray emission for these knots. Synchrotron self-Compton (SSC) emission was ruled out very early on as being far too weak (Chartas et al., 2000), unless very low (far from equipartition) magnetic fields were adopted; however, the total power requirement then becomes far too high ( erg s-1) and the Doppler factor very small () suggesting an unrealistically de-beamed jet (Tavecchio et al., 2000; Dermer & Atoyan, 2004). A viable alternative, though requiring further exploration, is a hadronic origin for the X-rays. Such models (e.g. Aharonian, 2002) would not be in conflict with the high polarization measurements of Cara et al. (2013), and these models may be tunable enough to match the X-ray flux level while avoiding the GeV limits (Zhang & Böttcher, 2013; Kundu & Gupta, 2014). A (leptonic) synchrotron origin for the X-rays from a second population of electrons is also not in conflict with any of the data in hand, and further, relaxes many of the ‘uncomfortable’ constraints of the IC/CMB model. Very small angles to the line of sight are not required, and the total jet power required is considerably less (Dermer & Atoyan, 2004), as the electron energy distribution need not be extended to very low values. The main objection to a second synchrotron component heretofore has simply been its unexplained nature; Schwartz et al. (2000) notes that there is no reason why a second population of high-energy electrons should be co-spatial with the first. However, this co-occurrence of two very different electron populations, if the correct interpretation, is obviously a very important clue to the particle acceleration mechanism in large-scale jets, of which we still know little. An additional characteristic of the second electron population, at least for the case of PKS 0637-752, is that it requires a low-energy-cutoff in the electron energy distribution at TeV energies, otherwise the spectrum should extend to optical energies, contrary to the cutoff seen in the radio optical knot emission (Mehta et al., 2009). Acknowledging that further work may be warranted in the direction of evaluating hadronic models, we focus the rest of the paper on the implications for jet physics if the X-ray flux in quasar jets is synchrotron emission from a separate, high-energy electron population.
Assuming that the X-ray emission from the jets of 3C 273 and PKS 0637-752 is synchrotron in origin, an interesting consequence follows for our accounting of the large-scale-jet contribution to various backgrounds, especially at TeV energies. Jet one-sidedness clearly indicates that the kpc-scale jets are at least mildly relativistic, and thus IC/CMB emission must occur at some level. Due to the very low background in the highest-energy Fermi bands, the flux limits reachable by Fermi’s sky-scanning mode of operation should allow us to eventually either detect this emission or put very strong limits on the factor of which characterizes the flow on the kpc scale. The current Fermi 95% upper limits already constrain for 3C 273 and PKS 0637-752, under the assumption of equipartition magnetic fields, where we take = 1.5 G for PKS 0637-752 from Tavecchio et al. (2000) and =1.0 for 3C 273 from Jester et al. (2006). Lower magnetic field values would only decrease these upper limits on . These limits are already low enough to have interesting consequences for our understanding of the total radiative output of AGN jets on the kpc scale.
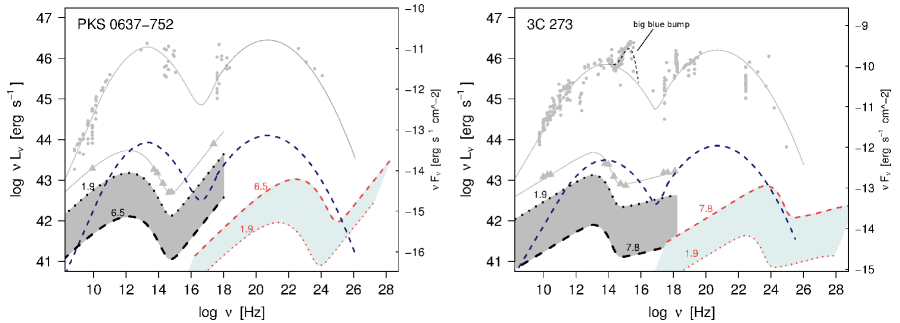
It is generally assumed that the radiative output of quasar jets is dominated by that occurring at the ‘core’, the base of the jet which is presumed to be very near the black hole (or parsecs away at most) and is therefore unresolved even in VLBI imaging. Certainly, the observed fluxes are dominated by this part of the jet due to Doppler beaming whenever the jet is pointed fairly along our line-of-sight. This is depicted in Figure 7, where the core flux of both jets are shown as gray circles, and the total kpc-scale jet as gray triangles (flux scale on right axis). The luminosity scale at left applies to these points only under the incorrect assumption of isotropy. If we correct these values for beaming, we get the real ‘angle-integrated’ total power output from the core and the jet, plotted as a dark blue dashed line and the gray shaded area, respectively. VLBI observations of superluminal motions place a lower limit on =15 for the cores of both 3C 273 and PKS 0637-752, respectively (Lister et al., 2013; Edwards et al., 2006). We have applied a correction (multiplying by 1/, Ghisellini & Tavecchio, 2010) assuming =15 for the cores of both jets to give the angle-integrated core luminosity (dark blue dashed line). To calculate the angle-integrated luminosity of the knots, we apply a lower limit value of which comes from statistical arguments based on populations (Arshakian & Longair, 2004), which gives the dotted-line upper edge to the gray shaded area, while the current limits from Fermi give the lower dashed-line limit. The true angle-integrated luminosity of the knots is thus somewhere in the gray zone.
Comparing the dashed-blue curve and the gray shaded area, it is interesting to note that the knots are apparently not necessarily insignificant in total output when compared to the core. The jet power dissipated by radiative losses appears to occur over much larger physical scales than has previously been appreciated. Definite conclusions will require tighter constraints on the factors of both the core and the knots, but it is possible that large-scale jets contribute more than the core in the UV to X-rays, in addition to their general dominance in the radio. Large-scale jets could thus also be a contributor to some astrophysical backgrounds.
A further observation follows from the realization that the X-rays are synchrotron in origin: the electrons producing the synchrotron X-rays will themselves upscatter the CMB to produce a GeV to TeV spectrum. The angle-integrated total power in the IC/CMB component is shown in Figure 7 as a light blue shaded area. Note that the bounds in this case are flipped; the upper limit forms the upper edge of the allowed zone. This is because IC/CMB emission increases with the Doppler factor as even after the angle-integrated 4 luminosity correction is included. Even in the minimum =1.9 case, these jets are already constrained to produce fluxes in excess of erg s-1 which is the typical angle-integrated luminosity for canonical TeV blazars (adopting an observed luminosity of erg s-1 and a modest =10). This is important because it has been proposed that (lower-power) TeV BL Lacs are significant contributors to the heating of the intergalactic medium (IGM; e.g. Broderick et al. 2012; Chang et al. 2012; Lamberts et al. 2015, but see also Sironi & Giannios 2014), where the high-energy gamma-rays ( 100 GeV) produced by these jets pair-produce off the extragalactic background light, eventually depositing kinetic energy through plasma instabilities. Clearly, if this mechanism is important, the large-scale jets of powerful quasars may be a far more important source of 100 GeV photons than TeV BL Lacs, and possibly the dominant class of sources for blazar heating.
We have not applied an EBL correction to these spectra merely to illustrate the total intrinsic output. However, EBL absorption is very important at TeV energies, and would make direct observation of this TeV component difficult. Even assuming the most optimistic case of =7.8 for 3C 273, at redshift 0.158 the EBL absorption (Finke et al., 2010) is already high enough that it would take at least 100 hours of observations by the future CTA mission to detect the beamed IC/CMB component at TeV energies. Thus it is unlikely that many anomalous X-ray jets will have a synchrotron origin for the X-rays directly confirmed via TeV observations, though if Fermi begins detecting the IC/CMB component, an upturn at the highest energies might be visible in a few cases. The remaining best direct observation is via polarization – either in the UV, for those that show the second component emerging there, or with future X-ray polarimeters. Finally, we note that as long as Fermi continues to operate, the low background at the highest energies should allow continually improving constraints on the factors of large-scale jets.
5. Conclusions
We have shown that the expected gamma-ray emission required if quasar jets produce X-rays via IC/CMB has been ruled out in two quasar jets, 3C 273 and PKS 0637-752, at a high significance level using Fermi upper limits. Examining the evidence, we favor a synchrotron origin for the X-rays of their large-scale jets. This considerably relaxes the power requirements for the jet away from the near and super-Eddington values. We have shown that the limits on the IC/CMB gamma-rays constrain the jets to have values of 7.8 for 3C 273 and 6.5 for PKS 0637-752 assuming equipartition. A very interesting outcome of the synchrotron explanation of the X-rays is the prediction that quasar jets may radiate far more at TeV energies than TeV BL Lacs. Future work remains to see if 3C 273 and PKS 0637-752 are outliers, or if IC/CMB can be ruled out as the source of the anomalous X-rays for more quasar jets.
References
- Aharonian (2002) Aharonian. 2002, MNRAS, 332, 215
- Arshakian & Longair (2004) Arshakian, & Longair. 2004, MNRAS, 351, 727
- Atoyan & Dermer (2004) Atoyan, & Dermer. 2004, ApJ, 613, 151
- Broderick et al. (2012) Broderick et al. 2012, ApJ, 752, 22
- Cara et al. (2013) Cara et al. 2013, ApJ, 773, 186
- Celotti et al. (2001) Celotti et al. 2001, MNRAS, 321, L1
- Chang et al. (2012) Chang et al. 2012, ApJ, 752, 23
- Chartas et al. (2000) Chartas et al. 2000, ApJ, 542, 655
- Dermer & Atoyan (2004) Dermer, & Atoyan. 2004, ApJ, 611, L9
- Edwards et al. (2006) Edwards et al. 2006, PASJ, 58, 233
- Finke et al. (2010) Finke et al. 2010, ApJ, 712, 238
- Georganopoulos & Kazanas (2004) Georganopoulos, & Kazanas. 2004, ApJ, 604, L81
- Georganopoulos et al. (2006) Georganopoulos et al. 2006, ApJ, 653, L5
- Ghisellini & Tavecchio (2010) Ghisellini, & Tavecchio. 2010, MNRAS, 409, L79
- Godfrey et al. (2012a) Godfrey et al. 2012a, ApJ, 755, 174
- Godfrey et al. (2012b) —. 2012b, ApJ, 758, L27
- Hardcastle (2006) Hardcastle. 2006, MNRAS, 366, 1465
- Harris & Krawczynski (2006) Harris, & Krawczynski. 2006, ARA&A, 44, 463
- Harris et al. (2004) Harris et al. 2004, ApJ, 615, 161
- Jester et al. (2006) Jester et al. 2006, ApJ, 648, 900
- Jester et al. (2005) —. 2005, A&A, 431, 477
- Jorstad et al. (2005) Jorstad et al. 2005, AJ, 130, 1418
- Kataoka & Stawarz (2005) Kataoka, & Stawarz. 2005, ApJ, 622, 797
- Kharb et al. (2012) Kharb et al. 2012, ApJ, 748, 81
- Kundu & Gupta (2014) Kundu, & Gupta. 2014, MNRAS, 444, L16
- Lamberts et al. (2015) Lamberts et al. 2015, ArXiv e-prints
- Lister et al. (2013) Lister et al. 2013, AJ, 146, 120
- Lister et al. (2009) —. 2009, AJ, 138, 1874
- Marshall et al. (2011) Marshall et al. 2011, ApJS, 193, 15
- Marshall et al. (2005) —. 2005, ApJS, 156, 13
- Mehta et al. (2009) Mehta et al. 2009, ApJ, 690, 1706
- Meyer & Georganopoulos (2014) Meyer, & Georganopoulos. 2014, ApJ, 780, L27
- Mullin & Hardcastle (2009) Mullin, & Hardcastle. 2009, MNRAS, 398, 1989
- Nolan et al. (2012) Nolan et al. 2012, ApJS, 199, 31
- Sambruna et al. (2004) Sambruna et al. 2004, ApJ, 608, 698
- Sambruna et al. (2002) —. 2002, ApJ, 571, 206
- Sambruna et al. (2001) —. 2001, ApJ, 549, L161
- Schwartz et al. (2000) Schwartz et al. 2000, ApJ, 540, L69
- Siemiginowska et al. (2003) Siemiginowska et al. 2003, ApJ, 598, L15
- Siemiginowska et al. (2007) —. 2007, ApJ, 657, 145
- Sironi & Giannios (2014) Sironi, & Giannios. 2014, ApJ, 787, 49
- Tavecchio et al. (2000) Tavecchio et al. 2000, ApJ, 544, L23
- Uchiyama et al. (2006) Uchiyama et al. 2006, ApJ, 648, 910
- Uchiyama et al. (2005) —. 2005, ApJ, 631, L113
- Wilson & Yang (2002) Wilson, & Yang. 2002, ApJ, 568, 133
- Zhang & Böttcher (2013) Zhang, & Böttcher. 2013, ApJ, 774, 18