Pore-size dependence and characteristics of water diffusion in slit-like micropores
Abstract
The temperature dependence of the dynamics of water inside microporous activated carbon fibers (ACF) is investigated by means of incoherent elastic and quasi-elastic neutron scattering techniques. The aim is to evaluate the effect of increasing pore size on the water dynamics in these primarily hydrophobic slit-shaped channels. Using two different micropore sizes (12 and 18 Å, denoted respectively ACF-10 and ACF-20), a clear suppression of the mobility of the water molecules is observed as the pore gap or temperature decreases. This suppression is accompanied by a systematic dependence of the average translational diffusion coefficient and relaxation time of the restricted water on pore size and temperature. The observed values are tested against a proposed scaling law, in which the translational diffusion coefficient of water within a porous matrix was found to depend solely on two single parameters, a temperature independent translational diffusion coefficient associated with the water bound to the pore walls and the ratio of this strictly confined water to the total water inside the pore, yielding unique characteristic parameters for water transport in these carbon channels across the investigated temperature range.
Due to its polar nature, water is considered to be the de-facto solvent of choice for many important chemical and biological processes. In the animal kingdom for example, water facilitates key essential functions such as the regulation of body temperature, the breaking down of nutrients, the activities of vital protein and enzymes, to name a few. These vital roles coupled to the extraordinary thermo-physical properties of water, such as its ability to expand rather than contract upon cooling, and its known thermodynamics anomalies (heat capacity, and isothermal compressibility etc.) continue to drive fundamental research on this complex fluid.
In many common life circumstances however, water is often constrained to some surfaces, or restricted within tight cavities or very small voids or cracks. This nano-scopically restricted water undergoes structural perturbations and exhibits reduced molecular mobility and thermodynamics properties that are very distinct from those of bulk water Teixeira:85; Stanley:99; Gelb:99; Alba-Simionesco:06; Chaplin:09; Alabarse:12. The slowing down of water dynamics in nano-confinement is rather well documented, and has been observed with neutron spectroscopy in a number of porous materials, including the hydrophilic silica-based systems such as GelSil Crupi:03, Vycor Zanotti:99a, SBA-15 Webber:04, MCM-14 Liu:04; Mansour:02; Liu:06; Takahara:05, and FSM-12 Diallo:12, and the hydrophobic carbon systems such as carbide-derived carbon (CDC) Chathoh:11, single-wall nanotubes (SWNT) Mamontov:06, and double-wall nanotubes (DWNT) Mamontov:06; Chu:07.
The most commonly investigated pore geometry with neutrons in confined water research is that of the cylindrical type (i.e. silica MCM-41 or carbon SWNT), which is comparatively easier to model than non-uniform or other complex shapes. This convenient geometry being readily available in various sizes, it facilitates systematic studies and enables direct comparison with proxy models used in molecular dynamics simulations Liu:04; Bourg:12.
In reality though, natural confinement of water occurs under various spatial and geometrical restrictions. Understanding the effects of other pore shapes and spacings on the dynamics of water is thus of key scientific importance. In the present study, we investigate the effect of pore size on the dynamics of water confined inside carbon channels that are primarily slit-shaped. Specifically, the characteristic diffusive dynamics of water confined in the micropores of two activated carbon fiber samples have been investigated at various temperatures using neutron spectroscopy. The observed average characteristic relaxations and translational diffusion coefficients (associated with the H-sites of water) indicate a diffusion that is remarkably slower than in the bulk liquid, with an Arrhenius temperature behavior and characteristic energy barrier that is however similar to the bulk value. The diffusion properties can be adequately parametrized using a recently proposed scaling law Chiavazzo:14 for water transport, leading to two unique water transport characteristics in these slit-like carbon pore structures. These observed parameters can be used to predict the translational diffusion coefficient of water in these porous carbon samples at any other temperature where the law holds, without having to perform additional measurements.
I Sample Characteristics and Details
The Kynol™∗ activated carbon fiber (ACF) samples were received from the American Technical Trading (ATT), NY. These ACF samples were synthesized from polymeric carbon precursors and contain narrow pore size distributions and a large pore volume that is set by the degree of activation during synthesis. We use two different ACF samples (ACF-1603-10, and ACF-1603-20) for our study. The as-received carbon fibers have average macroscopic dimensions of 3 mm length, and 10 m diameter. These nominal average dimensions were checked against transmission electron microscopy results for consistency (not shown here). Previously reported scanning tunneling microscopy (STM) of similar ACF samples Kaneko:92a; Daley:96; Parades:01 has revealed a highly sinuous pore network with predominantly uniform nanometer size pore distribution (with a micropore volume of 88% of the total pore volume [0.4-0.5 cc/g] in ACF-10 Daley:96; LiuW:14). The remainder of the pore volume consists of random meso-pores and some ultra-micropores. The relevant sample characteristics are listed in Table 1. Various other measurements including thermodynamicsKaneko:92a; Kaneko:92b, small-angle neutron and X-ray scattering Suzuki:92; Ramsay:98 of ACF-10 and ACF-20 have also confirmed the interconnected pore structure, made primarily of elongated curvy slit-pores. The pores themselves are the voids between curvy but parallel carbon sheets Hayes:14. The gap between two non-flat carbon sheets defines the average pore size. The key point is that the pores in ACF are not of cylindrically shaped as in the other well characterized nanotubes, but appear to made of irregular slits pores, as indicated by the above cited STM work. This different pore structure offers a new platform for investigating fluids in confined geometries in non-cylindrical pores. For the current ACF-10 and ACF-20 samples, the average pore size is estimated to be respectively (12) and (180.6) Å, based of previously reported N2 adsorption isotherm measurements Daley:96; LiuW:14 using the Dubnin-Astakhov equation Dubinin:89. Since the average pore sizes are all below 2 nm, we refer to the samples as microporous materials. The nominal sample specific surface areas, tabulated in Table 1, were confirmed at the time of the synthesis by the manufacturer by iodine number testing, and correlated well with BET calculations in this range Daley:96. Iodine is a common standard adsorbate used in industry to estimate the adsorption capacity of carbon samples.
| Sample | -pore size (Å) | (%) | Surface Area (m2/g) | (weight%) |
|---|---|---|---|---|
| ACF-10 | 11.97 | 88 | 785 | 21 |
| ACF-20 | 17.69 | 75 | 2247 | 23 |
To prepare for the neutron experiments, we outgassed the as-provided ACF samples for 36 hours at 473 K in a vacuum oven to remove all of the bulk-like water, and most of the surface water that was originally present in the as-received sample. We then exposed respectively about 2 g of each so-dried sample to a humid atmosphere in a desiccator for several hours. The hydration level reached in each case after about 24 hours exposure is indicated in Table 1. These values were based on the relative weight change of each sample. These somewhat important hydration levels signal the presence of hydrophilic groups (such as oxygenated sites for example) in otherwise totally hydrophobic samples. Since the quoted hydration amounts are relative to the ‘drying’ conditions set above, it is important to note that the diffusive dynamics reported in this work are those of all water molecules present inside the porous carbon network. The neutron being primarily sensitive to hydrogen atoms, the present measurements yield the characteristic relaxations of all confined water molecules. The hydrated samples were subsequently each loaded unto two concentric Al cylinders (with a 2 mm gap between them) to minimize multiple scattering. The subsequently indium-sealed containers were anchored to the copper finger of a close-cycle refrigerator (CCR) stick which allowed to control the sample temperature for the present measurements between 50 and 300 K.
II Neutron Scattering Measurements
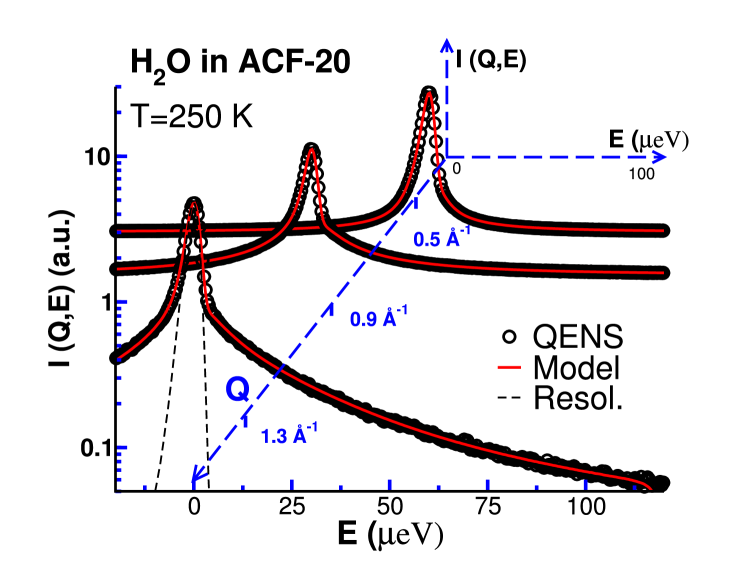
In this section, the technical details concerning the neutron measurements are presented. The neutron data were all collected on the backscattering spectrometer (BASIS) at Oak Ridge National Laboratory (ORNL), USA Mamontov:11. This unique indirect geometry neutron spectrometer has an excellent energy resolution 1.75 eV (Half-Width-at-Half-Maximum or HWHM) at the elastic line, and covers a momentum and energy transfer range, respectively 0.3 2 Å-1, and 120 120 eV, enabling access to time and length scales in the range 3-22 Å and from 5 up to 1000 ps. To show the quality of the data collected on BASIS, representative spectra of water adsorbed in ACF-20 at temperature 250 K is shown in Fig. 1.
II.1 Incoherent Elastic Response
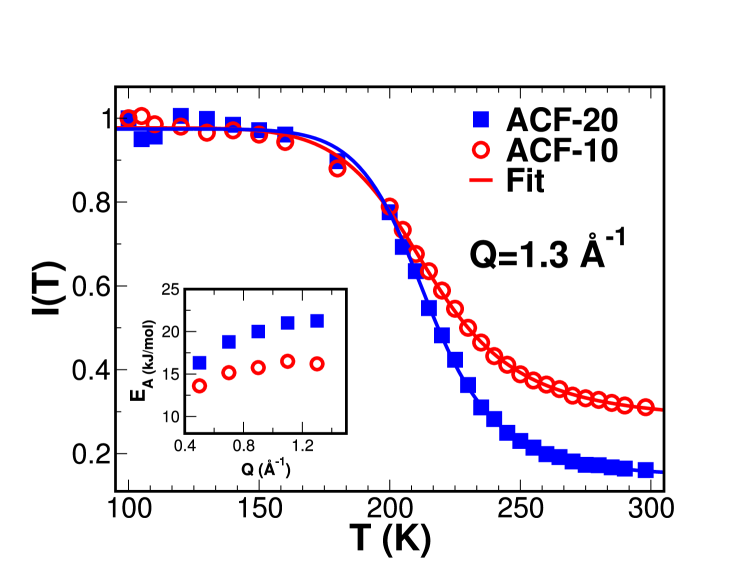
To gain preliminary insights into the molecular dynamics of water in ACF and determine the appropriate temperature range within which the diffusive dynamics become observable on BASIS, it is useful to investigate the temperature dependence of the elastic peak. This is achieved by integrating the peak intensity of rapidly collected runs (10 mins per point) of around () at each temperature from say 100 to 300 K, in steps of 5-10 K depending on the temperature region. Fig. 2 shows the result of such an analysis for both ACF samples, at a selected of 1.3 Å. The resulting energy-integrated elastic intensity is normalized to the lowest temperature data taken at K so that equals unity at . The signal decreases with increasing temperature, indicating an increase in mobility of the H-sites of water, and consequently of water itself. This behavior can be easily understood on the basis of an that is modulated by a Debye-Waller coefficient; i.e. proportional to Chen:99; Magazu:08 at each , where is the mean square displacement (MSD) associated with the hydrogen atoms in water. At low , the MSD arises primarily from harmonic vibrations, increasing monotonically with increasing . At high where anharmonic vibrations become important, its accurate determination requires a subtraction of the harmonic phonon contributions (which can be estimated from the MSD at low by extrapolation).
In any case, the total elastic area integrated over the instrument resolution window would effectively increase as is reduced, converging to some constant value when the diffusive dynamics become resolution limited, which is observed here to be around 150-180 K. Similarly, when the dynamics become too broad to be observed at the high temperatures (above 290 K here), flatten to background levels. These levels are dominated by higher energy dynamical processes that fall outside the instrument dynamics range. The intermediate region between these two limits where the intensity drops relatively quickly is associated with the relevant molecular diffusion. Water crystallization on the other hand, if present, would manifest itself along the curve as a sharp drop (similar to a step-like first order transition), which is not observed here at any (i.e. at any length scale probed). The scattering from solid ice is purely elastic. Our present observation suggests that water molecules in the microporous ACF remain mobile well below bulk water freezing temperature.
To get a preliminary estimate of the energies associated with the thermally activated water dynamics suggested by the drop in at various length scales, the diffusive component of can be modeled with a single Lorentzian function to a first approximation. Assuming an Arrhenius temperature dependent ), the energy-integrated for can be explicitly evaluated at each as follows, Springer:77; Grapengeter:87,
| (1) | |||||
where is the HWHM of the instrument energy resolution (1.75 eV), that of when , and a fraction of the observable molecules that do not participate to the diffusive process. Eq. 1 has thus three adjustable parameters: , , and . The solid lines in Fig. 4 represent the fits obtained at 1.3 Å-1 using Eq. 1. These fits yield average values between 13 and 16 kJ/mol for ACF-10 and 16 and 21 kJ/mol for ACF-20 for the -range probed (0.5 Å-1). At the higher ( Å-1), the data analysis is complicated by the coupling between translational and rotational modes. These values are thus not included in the present analysis. Estimate of the energy barriers associated with the long range translational diffusion can be best inferred from the lowest Å-1 data (spatial scale up to Å). Similarly, associated with localized dynamics (sphere of radius 5 Å) is provided by the largest investigated of 1.3 Å-1. The observed within this small interval increases with increasing , as indicated in the inset of Fig. 2. There is a relatively broad distribution of values, whose observable limits are more less set by the lowest and highest accessible on the neutron spectrometer. This distribution of , as summarized in Table 2, suggests that a single Lorentzian alone cannot fully describe the entire quasi-elastic neutron (QENS) spectra. To map-out the entire observable values, should be analyzed at each accessible value. Eq. 1 provides only a rough estimate of at the corresponding length scale probed. A more sensitive and accurate approach for determining for the observed diffusive process is to fit the neutron spectra with an appropriate model at each wavevector independently (in either the energy or time domains), and investigate the temperature dependence of the corresponding translational diffusion coefficient or relaxation times, as we have done below. The parameter decreases with increasing , varying for example from 0.46 at Å-1 to 0.27 at Q Å-1 in ACF-10.
| (Å-1) | ACF-10 | ACF-20 |
|---|---|---|
| 0.5 | 13.6 | 16.3 |
| 1.3 | 16.2 | 21.2 |
II.2 Quasi-Elastic Neutron Scattering (QENS)
Having determined a suitable temperature range for investigating the diffusion of water confined in the hydrated ACF samples on the spectrometer, high statistical quality quasi-elastic neutron (QENS) data were collected at three temperatures: 280, 250, and 230 K. The relevant momentum transfer range for this comparative QENS study is limited to 0.5 1.3 Å-1, Å-1, to avoid the undesirable influence of the coherent contributions of carbon at low and high ’s, and of the faster rotational motions of water that complicate the interpretation of the data. As indicated above, Fig. 1 shows representative spectra as a function of for water in ACF-20 at 250 K. The figure also depicts the resolution function at Å-1 taken with the same sample cooled down to 50 K (dashed black line). Each QENS spectra was normalized against the same vanadium run to correct for detector efficiency, and subsequently Fourier transformed to a self-intermediate scattering function using,
| (2) |
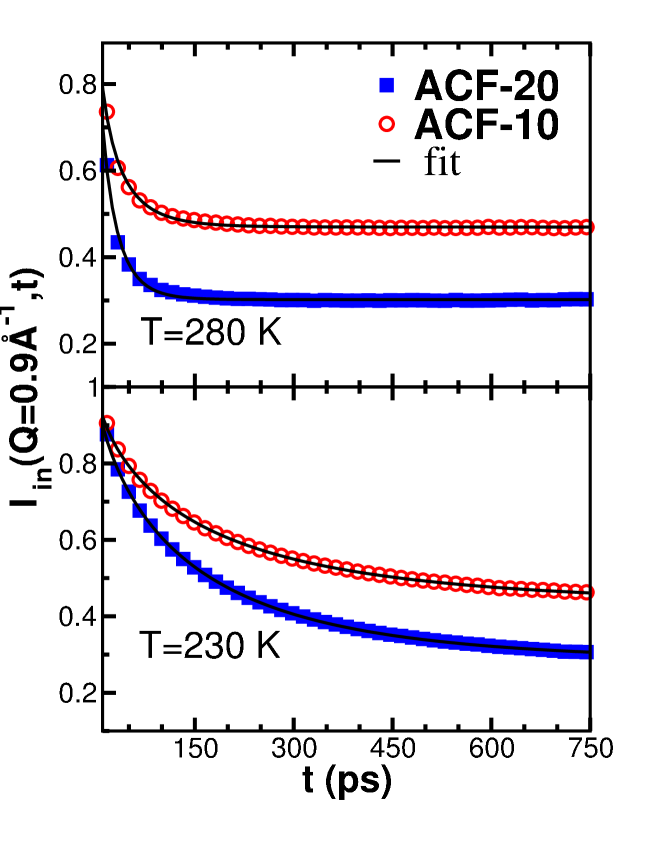
where is 120 eV. The instrument contributions were removed by dividing the resulting at each temperature by that obtained at 50 K data. The intrinsic were then all fitted in the time domain over a limited but reliable range, 30-750 ps. In principle, the accessible times on BASIS is a low as 5 ps and as high as 1000 ps, given the dynamics range and the energy resolution of the instrument. The narrower time domain over which the present analysis was done is one for which the translational dynamics of water are conveniently relevant on BASIS, and (2) where known systematic errors associated with complex Fourier transform of neutron data have minimal effects. Further details regarding the Fourier transform methods used here can be found in Ref. Mukhopadhyay:14.
III Data Analysis
Fig. 3 compares the resolution deconvoluted intrinsic for Å-1 at two selected temperatures. These resolution independent could be adequately described by a Kohlrausch-Williams-Watts (KWW) stretched exponential model Williams:70 plus a time-independent elastic component,
| (3) |
where denotes the fraction of immobile water molecules (most notoriously known as elastic incoherent structure factor or ), is the relaxation time, and the stretching exponent. Our parameter is offset from the true EISF because ‘dry’ sample contribution has not been subtracted here. In our recent investigation of water in ACF-10 Diallo:15, we found its dynamics to be more reliably captured by the KWW model, rather than the two exponential model. This KWW model is suggestive of and consistent with a heterogeneous diffusive dynamics. Typical KWW fits can be seen as black solid lines in Fig. 3. As can be appreciated, the fits clearly capture the experimental data quite reliably over a wide time range, from about 30 ps to about 750 ps. From these fits, the temperature and wavevector dependence of the three adjustable parameters , and are determined. By analyzing the -dependence of these parameters at each temperature, the diffusion coefficient, and average relaxation time for the confined water can be determined. Assuming a distribution of relaxation times at temperature , the mean value of at that temperature is thus the area , where is the gamma function.
IV Results and Discussion
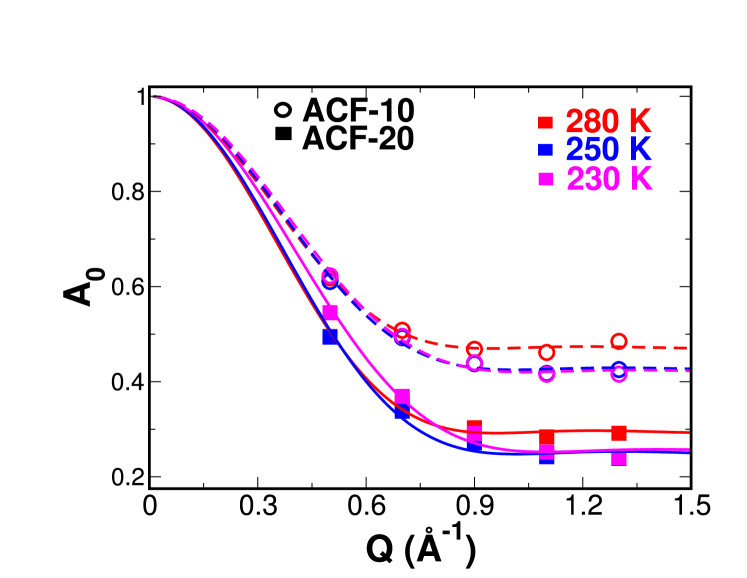
The -dependence of the parameter (from Eq. 3) associated with each ACF sample is displayed in Fig. 4 for the three investigated temperatures. This parameter introduced above is a measure of the fraction of H atoms that do not contribute to the diffusion process within a cage of certain dimension (). With this in mind, it is evident (based on Fig. 4) that (1) the fraction of mobile water molecules is largely temperature independent (except perhaps in ACF-10), and (2) that at short distances (high ), approximately 20% more water molecules will be contributing to the observed dynamics in the large pores of ACF-20 than in the narrow ACF-10 pores, in agreement with Fig. 2. To estimate the size (where 10, 20 for ACF-10, and ACF-20 respectively) of the confining cage from , a model fit is necessary. Using the following generic expression EISF for spherically confined motion, Bellissent-Funel:95,
| (4) |
where is the spherical Bessel function, the parameter and the actual fraction of immobile water molecules outside the cage are extracted at each temperature, as summarized in Table 3 for both samples ( ACF-10, ACF-20). These values confirm the larger fraction of immobile water molecules in ACF-10 inferred from Fig. 4, and reveal an average confining cage radius for water in ACF-20 of about 4.5 Å that is unaffected by temperature (less than 2% change on cooling from 280 K to 230 K). In contrast, the corresponding cage size in ACF-10 shrinks by as much as 16 % for the same temperature change.
| (K) | a10 (Å) | a20 (Å) | f10 (%) | f20 (%) |
|---|---|---|---|---|
| 280 | 4.8(2) | 4.7(1) | 47 | 29 |
| 250 | 4.4(1) | 4.4(3) | 43 | 25 |
| 230 | 4.0(1) | 4.6(1) | 42 | 25 |
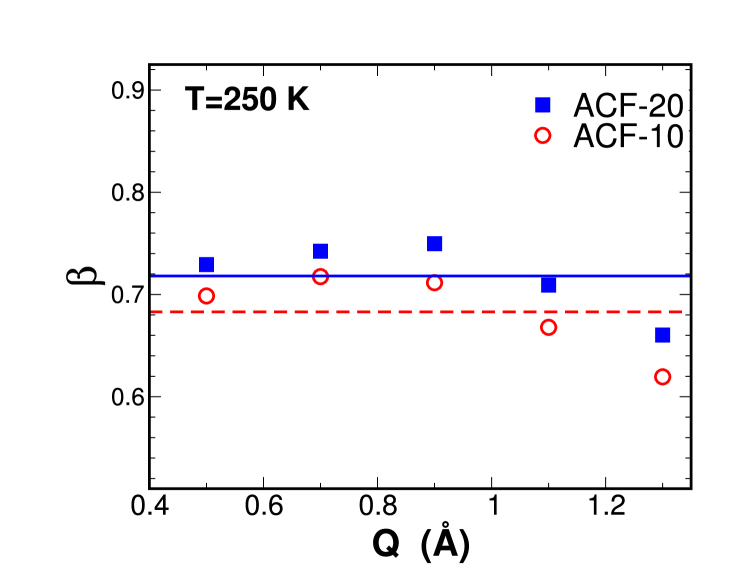
Eq. 3 yields a stretching exponent , as well as a relaxation time that are both temperature and wavevector dependent. While the influence of these variables on is rather marginal compared to that on and generally kept fixed to some average value in KWW fits, we here chose to let it vary with , and . We subsequently computed the average relaxation time . The variation of with for water confined in the ACF samples at 250 K is illustrated in Fig. 5. Within the temperature and -range investigated, the observed values fall in the range of , in excellent agreement with previous findings.Mansour:02; Crupi:03; Liu:06
From the -dependence of , it is possible to determine the nature of the diffusion process, whether for example it is translational (quadratic in ) or rotational ( invariant) in character. The computed values for all the three investigated temperatures are displayed in the form of versus in Fig. 6. The resulting -dependence suggests a translational jump diffusion, with a quadratic behavior at low ’s, and a saturation to a fixed value at high enough . This model is given by,
| (5) |
where corresponds to the average translational diffusion coefficient of water inside the pores (associated with the H-sites). The lines in Fig. 6 represent the best fits of Eq. 5 to the experimental data, from which the temperature dependence of and are extracted and examined below.
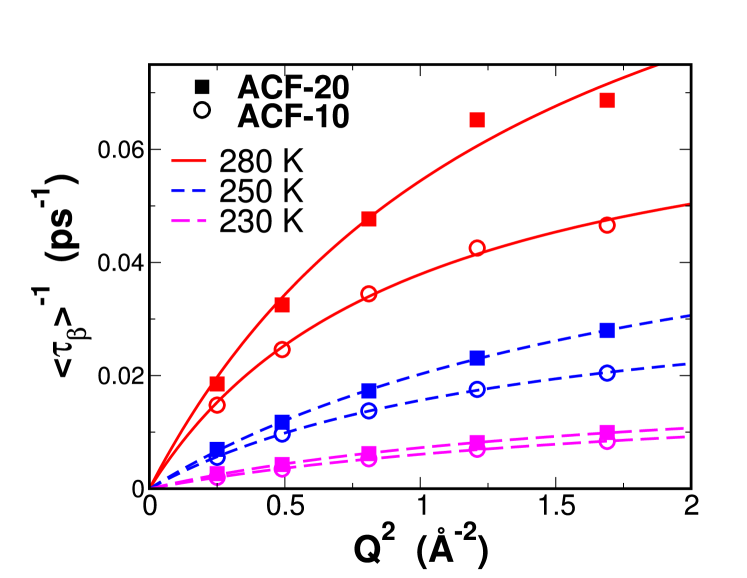
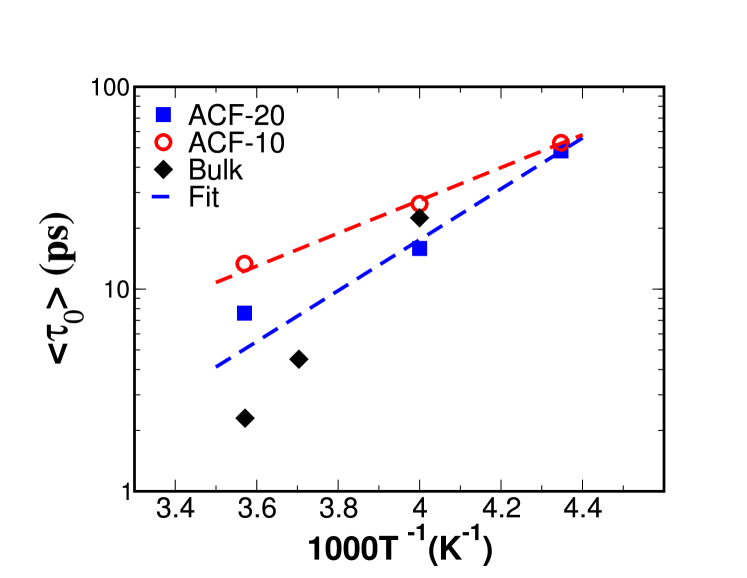
Fig. 7 compares the temperature dependence of for water in ACF-10 and ACF-20 with that of bulk water, plotted on a logarithmic scale. Within the instrumental precision, our observed relaxation time of water changes by a factor of 6 between 230 K and 280 K in ACF-10, compared to only 4 in ACF-20, as indicated by the different slopes of the lines in Fig. 7. Since shorter times are associated with faster dynamics, one can immediately conclude that while the dynamics of water becomes progressively slower as the confining pore size is reduced, the corresponding values between jump-sites, are consistently larger in the smaller pores at all temperatures.
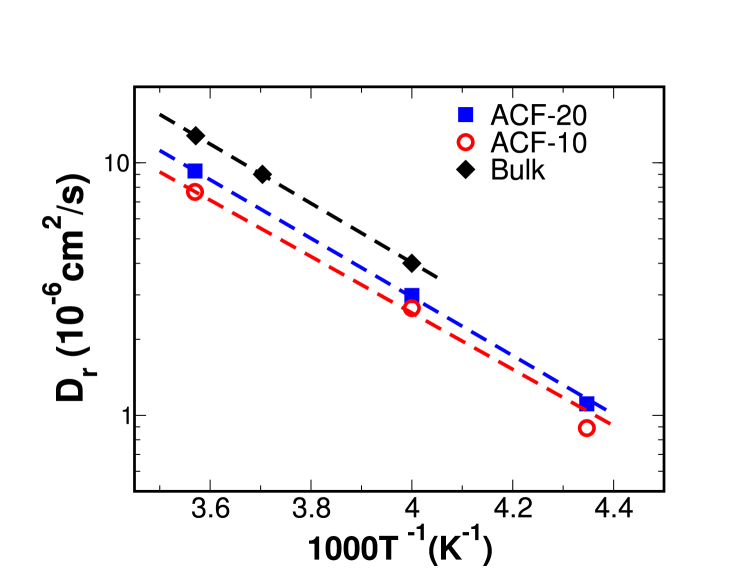
A subsequent investigation of the translational diffusion coefficient shown in Fig. 8 confirms the slowing down of the dynamics as the confining pore dimension is reduced. The behavior of indicates a progressively decreasing mobility of water molecules as the confining space becomes tighter. At 280 K for example, is respectively 40 and 30% lower in ACF-10 and ACF-20 than in the bulk liquid at the same temperature. As the temperature drops, departs significantly from its bulk value, decreasing by as much as 77% in ACF-10 and 70% in ACF-20 at 230 K.
Both and can be fit to an Arrhenius exponential decay , yielding the characteristic activation energy associated with each. The resulting fits are indicated by the dashed lines in Figs. 7 and 8, with values that are summarized in Table 4. The values inferred from are approximately 21-22 kJ/mol, comparing well with previously reported values in porous media Liu:06; Qvist:11. Contrary to those deduced from , they also appear to be more uniform across the two samples, and comparable to those of bulk water Mitra:01; Teixeira:85. Although this estimated bulk water (22.4 kJ/mol) is significantly larger than that reported in Ref. LABEL:Teixeira:85 for strictly rotational relaxations (E7.7 kJ/mol), we find it to agree rather well with recent findings in which the corresponding molecular motions were not considered to be strictly rotational, with 22-24 kJ/mol Qvist:11. Compelling arguments of why the localized water dynamics cannot be considered to be purely rotational in character can be found in Ref. Qvist:11.
| Source | (10-6cm2/s) | |
|---|---|---|
| (kJ/mol) | 15.5 | 21.3 |
| (kJ/mol) | 24.1 | 22.2 |
| (kJ/mol) | 22.4 |
Because the derived from the temperature dependence of in Fig. 7 do not exhibit a clear systematic pore size dependence, we focus instead on the that dictates the temperature dependence of (see Table 4). The results suggest that while the overall diffusive dynamics of the water molecules slow down as the pores size or the temperature is decreased, the activation energy for H-bond breaking in water confined in porous ACF remains globally unchanged from its bulk value.
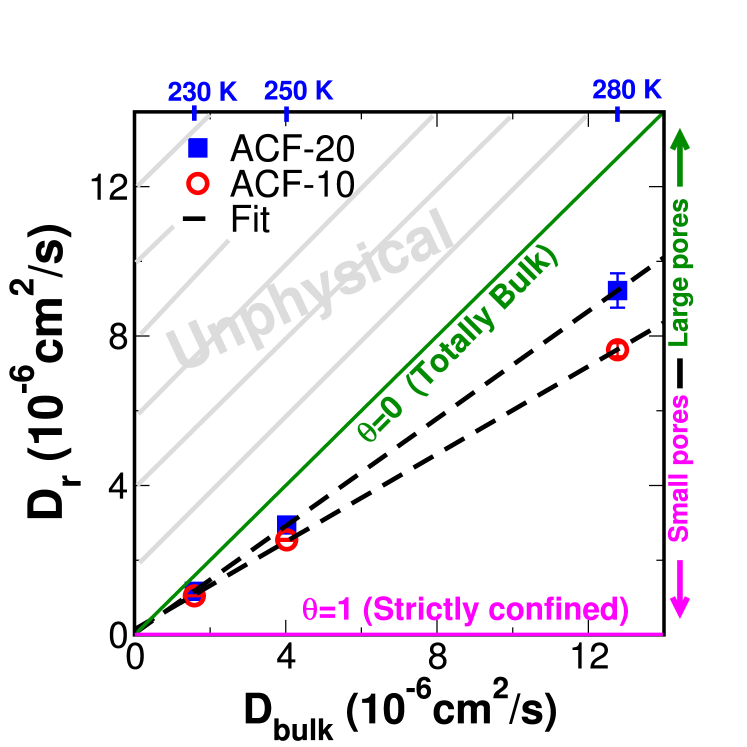
In a recent molecular dynamics simulation (MD) work, Chiavazzo et al. Chiavazzo:14 reported a ‘universal’ scaling law that can be used to interpret water transport in confined geometries. This scaling depends primarily on a single parameter, which is the ratio between the strictly confined water (or water influenced by the pore walls) to that of the total water in the confining pore. Obviously the larger the pore, the smaller this parameter is. They tested and validated their predictive model against some 60 cases, ranging from water in nanoporous silica to hydration layers in proteins. Based on this proposed scaling model, the translational diffusion coefficient of confined water can be written at any temperature as,
| (6) |
where is the bulk water translational diffusion at temperature , and and the temperature insensitive parameters, respectively the translational diffusion coefficient associated with the strictly confined water (i.e. the water that is most strictly affected by confinement), and the ratio between this water and the total water in the confining media. In practice, can be obtained from the literature, but and would be sample specific and geometry dependent.
| Parameters | (10-6cm2/s) | |
|---|---|---|
| ACF-10 | 0.41 | 0.35 |
| ACF-20 | 0.28 | 0.14 |
Using Eq. 6, it is thus possible to determine the characteristic transport parameters and for water in the present ACF samples. Fig. 9 shows the observed values in ACF versus known bulk water data (). The dashed lines are fits of Eq. 6 to the experimentally observed values. From the slopes and intercepts of these lines, and can be extracted. The observed values for each sample are listed in Table 5. Fig. 9 also shows the limiting situations by the strictly confined water () and pure bulk water (). The grey shaded area is inaccessible and corresponds to the unphysical condition .
In our opinion, the temperature region over which Eq. 6 is applicable may depend on both the sample and the characteristics of the neutron instrument used (resolution and dynamics range). Based on the current data, we estimate this range to be between 220 K and 290 K on the BASIS spectrometer. The maximum value is primarily set by the accessible time window on the instrument, and the lower limit varies based on a combination of instrumental resolution, and the physics of water itself (confining pore size, possible phase transition related to thermodynamics anomalies Liu:04 etc.). It may however be more prudent to set above at least 250 K, the lowest temperature at which bulk supercooled water can be easily achieved and for which neutron scattering work has been fairly well documented Qvist:11; Mitra:01; Teixeira:85. The law requires thus that the temperature range considered be one in which and do not vary with temperature. This suggests a temperature interval in which the effective potential well in which water sits in the confining pore remains greater than the thermal kinetic energy.
In the current study, the translational diffusion coefficient for bulk water at 230 K shown in Fig. 9 (lowest value where for ACF-10 and ACF-20 appears to overlap) was estimated by extrapolating the temperature dependence of above 250 K down to 230 K. This approximation is off course by no means exact since of water is known to be rather super-Arrhenius Teixeira:85, but it is one that yields a reasonable estimate for the present relatively small temperature interval. Excluding the data at 230 K does not affect our findings. In fact, the remarkable observed linearity in Fig. 9 suggests that a single temperature point would be sufficient to predict the overall temperature behavior, and the characteristic parameters and . This observation warrants further investigation.
V Conclusions
In the present study, the molecular dynamics of water adsorbed in microporous activated carbon fibers have been investigated for two different pore sizes, and compared with bulk water dynamics. The quasi-elastic neutron scattering data of ACF-10 (12 Å) and ACF-20 ( 18 Å) reveal a retardation of the water dynamics when either the pore dimension or the temperature is reduced. The observed translational diffusion coefficients can be adequately described by a recently proposed scaling law for water diffusion in nano-confined geometries, yielding intrinsic characteristic parameters capable of predicting water mobility in each of these two specific porous carbon materials at any temperature over a wide temperature range where the law remains valid. The significance of this scaling law to neutron experimenters, who far too often struggle to complete a series of temperature scans within a limited beamtime allocated by the neutron facilities, cannot be underestimated. The present findings suggest that for a given nanoporous media, knowledge of the water dynamics at 2 temperatures (3 to confirm accuracy, as we have done here) is all that is required for predicting its diffusion at other temperatures. To further test the universality of this law, additional work is however needed. Future research could involve other well studied porous media for which the dynamical properties of water are well known (MCM-41 for example). It will also be interesting to further investigate the temperature range over which the method can be reliably applied using other neutron spectrometers with different energy resolution and dynamics range.
VI Acknowledgments
The author is thankful to R. Goyette, R. Mills, R. Moody, and M. Rucker at the Spallation Neutron Source (SNS), Oak Ridge National Laboratory (ORNL) for their excellent technical support during the measurements. He is also indebted to Eugene Mamontov for many stimulating scientific discussions and a wonderful collegiality over the last few years. He thanks both E. Mamontov and A. Kolesnikov for their critical reading of the manuscript. The author owes much gratitude to M. Sliwinska-Bartkowiak, A. A. Chialvo, L. Vleck and J. S. Hayes for recent collaborations on the diffusion properties of water confined inside related nanoporous carbon materials, which have motivated the present work. The use of the Mantid software package Arnold:14 is gratefully acknowledged. This work at ORNL’s SNS is sponsored by the Scientific User Facilities Division, Office of Basic Energy Sciences, US Department of Energy.
∗ KynolTM is a registered trademark of Gun Ei Chemical Industry Co., Ltd. for novoloid fibers and textiles.