Nanotube mechanical resonators with
quality factors of up to 5 million
Abstract
Carbon nanotube mechanical resonators have attracted considerable interest because of their small mass, the high quality of their surface, and the pristine electronic states they host [1, 2, 3, 4]. However, their small dimensions result in fragile vibrational states that are difficult to measure. Here we observe quality factors as high as in ultra-clean nanotube resonators at a cryostat temperature of 30 mK, where we define as the ratio of the resonant frequency over the linewidth. Measuring such high quality factors requires both employing an ultra-low noise method to detect minuscule vibrations rapidly, and carefully reducing the noise of the electrostatic environment. We observe that the measured quality factors fluctuate because of fluctuations of the resonant frequency. The quality factors we measure are record high; they are comparable to the highest reported in mechanical resonators of much larger size [5, 6], a remarkable result considering that reducing the size of resonators is usually concomitant with decreasing quality factors. The combination of ultra-low size and very large offers new opportunities for ultra-sensitive detection schemes and quantum optomechanical experiments.
In recent years, endeavours to boost quality factors in nano and micromechanical resonators have been stimulated by the need to develop innovative approaches to sensing [7], signal processing [8] and quantum physics [9]. Strategies to enhance quality factors have proceeded along three main routes. Firstly, the quality of the host material has been improved. To this end, new materials have been employed, such as high tensile stress silicon nitride membranes [5, 10] and single crystal diamond films [11]. In addition, surface friction has been lowered by optimizing fabrication processes and reducing contamination [12]. Secondly, schemes to isolate the resonator from its surrounding environment have been developed, based on new resonator layouts [13, 14], and on optical trapping of thin membranes and levitated particles [15, 16]. Thirdly, and most straightforwardly, -factors have been improved by operating resonators at cryogenic temperatures [17].
Schemes to enhance -factors in nanotube resonators have focused on reducing contamination by growing ultra-clean nanotubes, and cooling resonators down to millikelvin temperatures [2]. Even though -factors, measured from the linewidth of driven resonances, have been improved up to , they are still much lower than values routinely obtained with larger resonators fabricated from bulk materials using top-down techniques [6]. This result is somewhat disappointing, since the high crystallinity of nanotubes and their lack of dangling bonds at the surface are expected to minimize surface friction that limits the -factor in some nanomechanical systems [18].
Here we find that the actual values of the -factors can be significantly higher than hitherto appreciated, but that revealing these values requires to perfect the measurement technique. Namely, the dynamics of the nanotube has to be captured in a regime of vanishingly small displacement in order to minimize nonlinear effects. In addition, noise from the electrostatic environment has to be reduced as much as possible. Indeed, owing to the ultra-small mass of nanotubes, this electrostatic noise affects the frequency of the nanotube resonator enormously and broadens the mechanical linewidth. All these experimental requirements make it challenging to unmask the instrinsic -factor. Progress in measuring ring-down with nanotubes has been made [19], but it has not revealed higher -factor values; one reason might be that the large displacements in those measurements lead to sizeable nonlinearities.
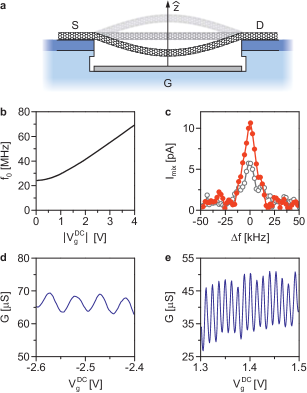
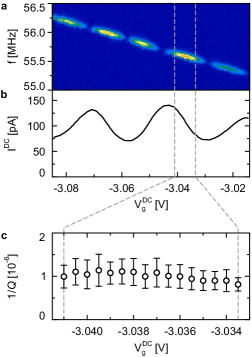
The geometry of our device, along with its characterization, are shown in Fig. 1. The nanotube is contacted by source (S) and drain (D) electrodes, and is suspended over a trench; at the bottom of the trench is a local gate electrode (Fig. 1a). In this scheme, the ultra-clean nanotube is grown by chemical vapour deposition in the last step of the fabrication process of the resonator, making it free of fabrication residues. The device is cooled to 30 mK, at which temperature all the data presented here are taken. We identify the lowest lying flexural mode of the resonator using the frequency-modulated (FM) mixing technique [20, 3], and study its dependence on gate voltage (Fig. 1b). Figure 1c shows resonance lineshapes in response to oscillating electrostatic forces, measured with the FM technique; they yield . The voltages used to produce these driving forces are kept low so that the resonance lineshapes are just above the noise floor.
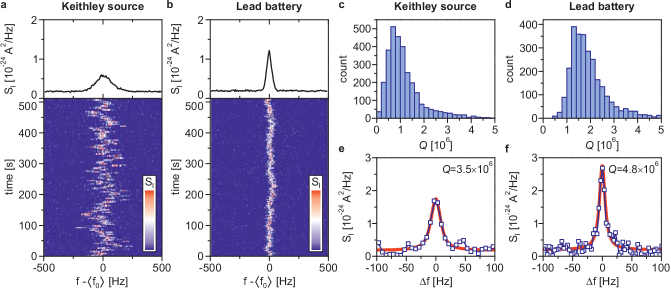
In the following, we employ an ultra-sensitive detection method described in Ref. [2] to capture the tiny amplitude of the thermal vibrations at 30 mK. In contrast to the FM technique, the resonator is not driven by an oscillating force. Displacement fluctuations are transduced into current fluctuations, of which power spectra are measured (see Methods). We operate the resonator within the electron Fabry-Perot regime (Fig. 1d), where the effect of electron transport on mechanical vibrations is less pronounced than in the Coulomb blockade regime (Fig. 1e) [2, 3, 4, 23]. A typical resonance lineshape, obtained by averaging power spectra for s, is shown in the upper panel of Fig. 2a. The corresponding -factor is for a resonant frequency MHz. Remarkably, such a -factor is 200 times higher than that measured with the FM mixing technique (Fig. 1c).
We find that both the -factor and fluctuate in time. To show this, spectra obtained over a measurement time s are acquired successively, using either a commercial source by Keithley or a simple lead battery to supply (see colour plots of as a function of frequency and time in Figs. 2a,b). Frequency fluctuations with the Keithley source are larger than with the lead battery. The -factor is fluctuating as well; its distribution is broad and asymmetric (Figs. 2c,d). On average, -factors are higher with the lead battery than with the Keithley source. While fluctuations in have been observed in high- mechanical resonators [24, 25, 26], fluctuations in the measured -factor have not been discussed thus far. We show below that both fluctuations are closely related.
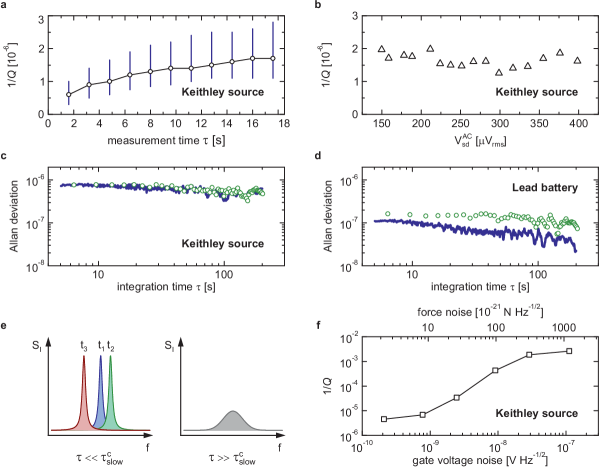
The averaged -factor decreases with the measurement time (Fig. 3a). Once the measurement time is set, the -factor does not reveal any marked dependence on the amplitude of the oscillating source-drain bias used to read out current fluctuations (Fig. 3b). This shows that does not affect the measured motion of the resonator. For example, if the resonator were to heat up due to Joule heating, the -factor would decrease as increases; if the resonator were to self-oscillate, the -factor would vary as increases. Neither the -factor nor changes as is swept through a conductance oscillation (see Supplementary Section VI). This confirms that the effect of electron transport on the vibrations is weak. This is crucial to our experiment, since Coulomb blockade would reduce the -factor [2, 3, 4, 23].
The observed frequency fluctuations are associated with the electrostatic noise of the environment. In the case of the Keithley source, frequency fluctuations are traced back to the voltage fluctuations of the source itself as a result of the strong gate voltage dependence of . To show this, we transform voltage fluctuations into Allan deviation using the -to- conversion factor measured in Fig. 1b, Hz/V (see Methods). In Fig. 3c, we find that the measured Allan deviation of the resonant frequency of the nanotube (green hollow circles) coincides with the Allan deviation expected from the gate voltage fluctuations generated by the source (blue trace). The frequency noise is of -type (pink noise), since is essentially constant as a function of measurement time . By contrast, the lead battery is stable enough that it does not significantly affect . The Allan deviation expected from the voltage fluctuations of the lead battery is smaller than measured with the nanotube resonator (Fig. 3d). The origin of the observed frequency fluctuations with the lead battery is not clear. Since remains constant as a function of ( noise), fluctuations might be related to two-level systems such as charge fluctuators in the gate dielectric.
The -factor is affected by the electrostatic noise of the environment as well. This can be inferred from a comparison between Fig. 2a and Fig. 2b. Larger fluctuations of the resonant frequency (lower panels) result in a larger resonance linewidth (upper panels), hence in a lower -factor.
The fluctuations of the quality factor, the asymmetry of its distribution, and its dependence on measurement time are all attributed to the fluctuations of the resonant frequency. To show this, we separate this frequency noise into a slow part and a fast part on the scale of the ring-down time (see Methods and Supplementary Section X). For a measurement time short compared to the characteristic time scale of the slow frequency noise , resonances have a Lorentzian lineshape whose width is constant while its resonant frequency fluctuates from one measurement to the next. For , resonances are broadened by the time average of many such Lorentzians, resulting in non-Lorentzian lineshapes (Fig. 3e). For , linewidths are larger than , and fluctuate from one measurement to the next. Upon increasing , linewidths tend to increase because the resonator has time to explore a larger frequency range. The distribution of linewidths is asymmetric since linewidths have a fixed lower bound given by (see Supplementary Section X).
Figures 2e,f display two high resonance lineshapes, obtained with both gate voltage sources, and demonstrating (Keithley source) and (lead battery). We verify that the areas of the resonances in spectra in Figs. 2e,f are equal (within 10%) to the areas of the averaged resonances in Figs. 2a,b. This confirms that these sharp resonances do capture the dynamics of the nanotube, in spite of the relatively low number of measurement points dictated by the short measurement time. A slightly lower quality factor is obtained in an additional device, also operated in the Fabry-Perot regime (see Supplementary Section IX), confirming the robustness of high resonances. These -factors are comparable to the highest ones measured in large micromechanical resonators [5]. Yet, they may still be limited by the measurement, and may not have reached the intrinsic -factor of nanotube resonators, defined as multiplied by the small-amplitude ring-down time (the ring-down time is not known, but it is smaller than ; see Supplementary Section X).
The large quality factors observed here are associated with the small amplitude of the nanotube vibrations. Using the equipartition theorem, we obtain that the mode temperature is mK, which corresponds to a phonon population with the Boltzmann constant and the Planck constant (see Supplementary Section V). In this estimate, we use the areas of the resonances in Fig. 2, which are all equal within 10%. From the temperature, we calculate that the variance of displacement is .
Larger displacements translate into lower -factors. This is illustrated in Fig. 3f where a white voltage noise is applied to the gate electrode in order to enhance the displacement. Possible origins of this behaviour could be associated to nonlinear damping forces, which result in a mechanical linewidth that depends on the amplitude of motion, and to the spectral broadening of the resonance, which is induced by the combination of nonlinear conservative forces and displacement fluctuations [3, 27, 28, 29]. Note that the applied voltage noise also induces fluctuations of , but their contribution to the measured resonance linewidth is negligible (see Supplementary Section VII). The temperature dependence of the -factor could not be measured in our current measurement setup.
The giant quality factors and the associated weak fluctuations of hold promise for diverse sensing experiments. The limit to force sensing is ultimately set by the force noise [2]. Using kg, , and mK, we obtain N, which is lower than what has been achieved with mechanical resonators thus far [2]. The sensitivity of mass sensing and force gradient detection is given by the Allan deviation of frequency fluctuations ( Hz for s) in Fig. 3d obtained with the lead battery. The latter translates into a mass resolution kg, which is as good as the best estimates on record [1]. We extract a force gradient resolution of N/m; this compares favorably with the best values reported thus far [30].
Nanotube resonators are relevant candidates for exploring the quantum regime of nanomechanics. Their low mass leads to large zero-point motion, pm, and allows to enhance the coupling to other quantum systems. High -factors are necessary for the quantum manipulation of mechanical states. In an experiment whereby the resonator is cooled to the ground state with passive feedback, the lifetime of the ground state is s (for ) using mK and assuming that is related to the ring-down time. Our nanotube resonator demonstrates Hz, which compares well with the highest values measured thus far in nano and micromechanical resonators [14, 31].
Overall, our work shows that the -factor of ultra-clean
nanotube resonators can reach very high values, provided that the
resonators are cooled to low enough temperature for nonlinear
effects to be negligible, that slow frequency noise is reduced,
that measurement times are short, and that the effect of the
coupling between vibrations and Coulomb blockade is suppressed.
The unique combination of ultra-low mass and giant quality factors
offers new opportunities for ultra-sensitive detection schemes and
optomechanical experiments in the quantum regime.
Methods
Detecting thermal vibrations. We employ an ultra-sensitive detection method that allows us to capture the tiny amplitude of the thermal vibrations in a dilution refrigerator cooled to 30 mK. Displacement fluctuations in the direction normal to the gate are transduced into conductance fluctuations , where is the capacitance between the nanotube and the gate, and (for the estimation of , see Supplementary Section II). Large transduced signals require a large transconductance . The largest transconductance is obtained in the Coulomb blockade regime, for (Fig. 1e), as is usually observed in ultra-clean suspended nanotubes [32]. However, Coulomb blockade reduces -factors, since it amplifies the coupling between electron transport and mechanical vibrations [2, 3, 4, 23]. For this reason, we operate the resonator within the Fabry-Perot regime, realized for , even though is lower (Fig. 1d). In this regime, oscillations in conductance originate from quantum interferences of electronic waves, and the effect of the coupling between vibrations and Coulomb blockade is weaker. The tiny conductance fluctuations are parametrically down-converted into low frequency current fluctuations by applying a small oscillating voltage of amplitude across source and drain, at a frequency shifted by kHz from the mechanical resonant frequency . Power spectra of fluctuations are measured at frequencies kHz with a cross-correlation technique using a vector signal analyzer [2].
Allan deviation. We calculate the Allan deviation as
| (1) |
where and are two subsequent measurements of averaged over the integration time , is the number of averaged frequency measurements, and is the average of over the whole measurement [33]. We define as the frequency for which is largest.
Power spectrum of displacement and frequency noise. We separate the frequency noise into a slow part and a fast part on the scale of the ring-down time. The power spectrum of displacement (which is proportional to ) as a function of angular frequency reads:
| (2) |
where is the Boltzmann constant, is the mode temperature, is the time, and is the modal mass. is the sum of the reciprocal ring-down time and of the broadening due to fast frequency noise, is the resonant angular frequency renormalized by fast frequency noise, and is the slow part of frequency noise (see Supplementary Section X). The area is given by the equipartition theorem, hence it is independent of frequency noise.
References
- [1] Chaste, J., Eichler, A., Moser, J., Ceballos, G., Rurali, R. & Bachtold, A. A nanomechanical mass sensor with yoctogram resolution. Nature Nanotech. 7, 301-304 (2012).
- [2] Steele, G. A., Hüttel, A. K., Witkamp, B., Poot, M., Meerwaldt, H. B., Kouwenhoven, L. P. & van der Zant, H. S. J. Strong coupling between single-electron tunneling and nanomechanical motion. Science 325 1103-1107 (2009).
- [3] Lassagne, B., Tarakanov, Y., Kinaret, J., Garcia-Sanchez, D. & Bachtold, A. Coupling mechanics to charge transport in carbon nanotube mechanical resonators. Science 325, 1107-1110 (2009).
- [4] Benyamini, A., Hamo, A., Viola Kusminskiy, S., von Oppen, F. & Ilani, S. Real-space tailoring of the electron-phonon coupling in ultra-clean nanotube mechanical resonators. Nature Physics 10, 151-156 (2014).
- [5] Adiga, V. P., Ilic, B., Barton, R. A., Wilson-Rae, I., Craighead, H. G. & Parpia, J. M. Approaching intrinsic performance in ultra-thin silicon nitride drum resonators. J. Appl. Phys. 112, 064323 (2012).
- [6] Poot, M. & van der Zant, H. S. J. Mechanical systems in the quantum regime. Physics Reports 511, 273-335 (2012).
- [7] Li, M., Tang, H. X. & Roukes, M. L. Ultra-sensitive NEMS-based cantilevers for sensing, scanned probe and very high-frequency applications. Nature Nanotech. 2, 114-120 (2007).
- [8] Mahboob, I. & Yamaguchi, H. Bit storage and bit flip operations in an electromechanical oscillator. Nature Nanotech. 3, 275-279 (2008).
- [9] Aspelmeyer, M., Meystre, P. & Schwab, K. Quantum optomechanics. Phys. Today 65, 29 (2012).
- [10] Rieger, J., Isacsson, A., Seitner, M. J., Kotthaus, J. P. & Weig, E. M. Energy losses of nanomechanical resonators induced by atomic force microscopy-controlled mechanical impedance mismatching. Nature Comm. 5, 3345 (2014).
- [11] Tao, Y., Boss, J. M., Moores, B. A. & Degen, C. L. Single crystal diamond nanomechanical resonators with quality factors exceeding one million. Nature Comm. 5, 3638 (2014).
- [12] Chan, J., Safavi-Naeini, A. H., Hill, J. T., Meenehan, S. & Painter, O. Optimized optomechanical crystal cavity with acoustic radiation shield. Appl. Phys. Lett. 101, 081115 (2012).
- [13] Anetsberger, G., Rivière, R., Schliesser, A., Arcizet, O. & Kippenberg, T. J. Ultralow-dissipation optomechanical resonators on a chip. Nature Photonics, 2, 627-633 (2008).
- [14] Chan, J., Mayer Alegre, T. P., Safavi-Naeini, A. H., Hill, J. T., Krause, A., Gröblacher, S., Aspelmeyer, M. & Painter, O. Laser cooling of a nanomechanical oscillator into its quantum ground state. Nature 478, 89-92 (2011).
- [15] Ni, K.-K., Norte, R., Wilson, D. J., Hood, J. D., Chang, D. E., Painter, O. & Kimble, H. J. Enhancement of mechanical Q factors by optical trapping. Phys. Rev. Lett. 108, 214302 (2012).
- [16] Gieseler, J., Deutsch, B., Quidant, R. & Novotny, L. Subkelvin parametric feedback cooling of a laser-trapped nanoparticle. Phys. Rev. Lett. 109, 103603 (2012).
- [17] Gröblacher, S., Hertzberg, J. B., Vanner, M. R., Cole, G. D., Gigan, S., Schwab, K. C. & Aspelmeyer, M. Demonstration of an ultracold micro-optomechanical oscillator in a cryogenic cavity. Nature Physics 5, 485-488 (2009).
- [18] Villanueva, L. G. & Schmid, S. Evidence of surface loss as ubiquitous limiting damping mechanism in SiN micro- and nanomechanical resonators. arXiv:1405.6115.
- [19] Meerwaldt, H. B., Johnston, S. R., van der Zant, H. S. J. & Steele, G. A. Submicrosecond-timescale readout of carbon nanotube mechanical motion. Appl. Phys. Lett. 103, 053121 (2013).
- [20] Gouttenoire, V., Barois, T., Perisanu, S., Leclercq, J.-L., Purcell, S. T., Vincent, P. & Ayari, A. Digital and FM demodulation of a doubly clamped single-walled carbon-nanotube oscillator: towards a nanotube cell phone. Small 6, 1060-1065 (2010).
- [21] Eichler, A., Moser, J., Chaste, J., Zdrojek, M., Wilson-Rae, I. & Bachtold, A. Nonlinear damping in mechanical resonators made from carbon nanotubes and graphene. Nature Nanotech. 6, 339-342 (2011).
- [22] Moser, J., Güttinger, J., Eichler, A., Esplandiu, M. J., Liu, D. E., Dykman, M. I. & Bachtold, A. Ultrasensitive force detection with a nanotube mechanical resonator. Nature Nanotech. 8, 493-496 (2013).
- [23] Ganzhorn, M. & Wernsdorfer, W. Dynamics and dissipation induced by single-electron tunneling in carbon nanotube nanoelectromechanical systems. Phys. Rev. Lett. 108, 175502 (2012).
- [24] Gavartin, E., Verlot, P & Kippenberg, T. J. Stabilization of a linear nanomechanical oscillator to its thermodynamic limit. Nature Comm. 4, 2860 (2013).
- [25] Fong, K. Y., Pernice, W. H. P. & Tang, H. X. Frequency and phase noise of ultrahigh silicon nitride nanomechanical resonators. Phys. Rev. B 85, 161410(R) (2012).
- [26] Villanueva, L. G., Kenig, E., Karabalin, R. B., Matheny, M. H., Lifshitz, R., Cross, M. C. & Roukes, M. L. Surpassing fundamental limits of oscillators using nonlinear resonators. Phys. Rev. Lett. 110, 177208 (2013).
- [27] Dykman, M. I. & Krivoglaz, M. A. Theory of nonlinear oscillator interacting with a medium. Soviet Physics Reviews, 5, 265-441 (1984).
- [28] Eichler, A., Moser, J., Dykman, M. I. & Bachtold, A. Symmetry breaking in a mechanical resonator made from a carbon nanotube. Nature Comm. 4, 2843 (2013).
- [29] Barnard, A. W., Sazonova, V., van der Zande, A. M. & McEuen, P. L. Fluctuation broadening in carbon nanotube resonators. Proc. Natl. Acad. Sci. USA. 109, 19093 (2012).
- [30] Longenecker, J. G., Mamin, H. J., Senko, A. W., Chen, L., Rettner, C. T., Rugar, D. & Marohn, J. A. High-gradient nanomagnets on cantilevers for sensitive detection of nuclear magnetic resonance. ACS Nano 6, 9637-9645 (2012).
- [31] Laird, E. A., Pei, F., Tang, W., Steele, G. A. & Kouwenhoven, L. P. A high quality factor carbon nanotube mechanical resonator at 39 GHz. Nano Lett. 12, 193 (2012).
- [32] Schneider, B. H., Etaki, S., van der Zant, H. S. J. & Steele, G. A. Coupling carbon nanotube mechanics to a superconducting circuit. Scientific Reports 2, 599 (2012).
- [33] Cleland, A. N. & and Roukes, M. L. Noise processes in nanomechanical resonators. J. Appl. Phys. 92, 2758-2768 (2002).
Acknowlegements
We thank H. Flyvbjerg and
S. Nørrelykke for discussions. We acknowledge support from the
European Union through the ERC-carbonNEMS project (279278), a
Marie Curie grant (271938), and the Graphene Flagship, MINECO and
FEDER (MAT2012-31338), the Catalan government (AGAUR, SGR), and
the US Army Research Office.
Author contributions
J.M. developed the experimental
setup, carried out the measurements, and analyzed the data. A.E.
fabricated the devices. J.G. provided support with the
experimental setup. M.I.D. and A.B. provided support with the
analysis. M.I.D. wrote Supplementary Section X. J.M., M.I.D. and
A.B. wrote the manuscript with critical comments from all authors.
A.B. and J.M. conceived the experiment. A.B. supervised the work.
Additional information
The authors declare no competing financial interests.
Supplementary information accompanies this paper at
www.nature.com/naturenanotechnology. Reprints and permission
information is available online at
http://npg.nature.com/reprintsandpermissions/. Correspondence and
requests for materials should be addressed to AB.
Supplementary Information
I Conductance as a function of gate voltage
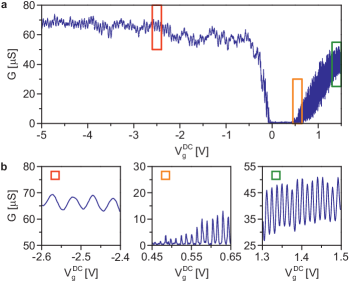
The conductance as a function of gate voltage at 30 mK is shown in Supplementary Fig. S1. The regime for positive corresponds to Coulomb blockade (Supplementary Fig. S1b, middle and right-hand-side panels). Indeed, the length of the blockaded region, estimated to be m from the separation between conductance oscillations, is close to the width of the trench (see next section). For negative , charge transport is in the so-called Fabry-Perot regime (Supplementary Fig. S1b, left-hand-side panel). The period in of the oscillations of is a few times larger than the period of oscillations for positive , as usually observed for suspended nanotubes. In addition, the conductance is close to , indicating that the electronic transmission of each contact is high.
The measurement shown in Supplementary Fig. S1 is typical of ultra-clean nanotubes [1]. The regions of the nanotube near the metal electrodes remain -doped, due to the work function of the electrodes, whereas the suspended part of the nanotube can be doped with electrons or holes using . For positive , junctions are formed near the metal electrodes, resulting in a Coulomb blockaded region along the suspended nanotube. For negative , the nanotube is -doped along the whole tube and no tunnel barriers are formed. Near , the conductance is zero because the Fermi energy lies inside the energy band gap along the entire suspended part of the nanotube.
II Estimating
We estimate the capacitance between the nanotube and the gate from the separation mV between two conductance peaks in the Coulomb blockade regime (Supplementary Fig. S1b, central and right-hand-side panels): F. This value is close to the model capacitance between a cylinder of length and radius , and a plane a distance away:
where is the vacuum permittivity, is the separation between the nanotube and the gate, and is a small displacement of the cylinder in the direction normal to the gate. The derivative reads
using nm and nm (the typical radius of nanotubes obtained with our chemical vapour deposition technique).
III Estimating the effective mass
We study the fundamental flexural mode of the nanotube resonator (see Fig. 1b of the main text). We use a simple model whereby the nanotube is straight and is perpendicular to the trench. The effective mass of the mode is related to the mass of the nanotube as
where is the length of the nanotube and is the shape of the mode, which is normalized so that . Given that mechanical tension is induced in the nanotube by the contacts and by the gate voltage, we assume that the modal shape is . The latter is the simplest approximation for the shape of a beam under tension. We emphasize that the expression for takes into account the shape of the vibrational mode; all other quantities are measured with respect to the amplitude of this mode. To estimate , we also assume that the length of the nanotube is equal to the trench width ( m) and that nm as in Section II. Therefore
where kg is the mass of a carbon atom and m2 is the surface area of a hexagon in the honeycomb lattice of graphene.
IV Orientation of the mode with respect to the gate electrode
The orientation of the vibrations of the eigenmode depends on the static curvature of the suspended nanotube, which builds in during the fabrication of the resonator. Since the static curvature cannot be controlled and cannot be accurately measured, the eigenmode can vibrate in any direction. For a real nanotube, the displacement along the nanotube can be quite complicated. However, we will use a simplified model where at least for the lowest mode the displacement is in one plane. We will characterize this plane by the angle it makes with the plane parallel to the surface of the gate electrode (Supplementary Fig. S2a).
We assume that current fluctuations at the drain electrode are proportional to motional fluctuations along the direction normal to the gate electrode. Then, the current at the frequency close to the difference between the mode eigenfrequency and the frequency of the source-drain voltage is
| (S1) |
where is the transcondutance, is the static gate voltage, and is the amplitude of the oscillating source-drain voltage. We assume that the mode is polarized along , as shown in Supplementary Fig. S2a; hence, is the projection along of the motional fluctuation along :
| (S2) |
where is the angle between and . To estimate , we subject the nanotube to a weak electrostatic force by applying a small oscillating voltage with amplitude to the gate. The component of the force along is . The center of mass of the nanotube experiences a force , the projection of along . On resonance, the displacement induced by reads
| (S3) |
where is the quality factor of the resonance, the effective mass, and the resonant frequency. In turn, the displacement induces current oscillations of variance at the drain:
| (S4) |
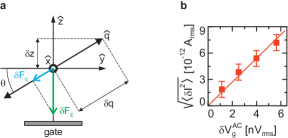
Supplementary Fig. S2b shows as a function of , measured with the technique described in the main text and in Ref. [2]. The dependence of on is linear and extrapolates to zero in the limit of zero , as expected from Eq (S4). We obtain from the slope in Supplementary Fig. S2b, using V, V, F, F/m, kg, Hz, , S/V, and A/V.
The estimation of comes with a large uncertainty that mostly originates from the uncertainties in the estimations of and . These uncertainties, however, have little impact on the estimation of the modal temperature , which we present is Section V. Indeed, we show that is proportional to , a quantity that we can estimate rather precisely from the measurement shown in Supplementary Fig. 2b. For this, we rewrite Eq. (S4) as:
| (S5) |
Using the values given above, we calculate the right-hand-side of Eq. (S5) and obtain
We use this value to estimate is Section V.
V Mode temperature
Using Eqs. (S1) and (S2), the equipartition theorem yields
| (S6) |
where is the variance of displacement along , and is the two-sided power spectral density of current fluctuations . To make contact with the experiment, we also express in terms of , where is the natural frequency:
| (S7) |
where we used
In Eq. (S7), is defined as
| (S8) |
where is the measurement time, is the off-resonance angular frequency of the source-drain voltage, and is the resonant angular frequency. Experimentally, we measure the single-sided power spectral density .
We estimate the mode temperature from the power spectra in Figs. 2e,f of the main text. We obtain mK, using the following parameters: V, S/V, V, F, Hz, and A2. We also use obtained in Section IV.
We were not able to carry out a temperature dependence of . Connecting thermometry lines to the cryostat would generate electrical noise in our measurement, masking the mechanical resonance in the spectra.
VI Dependences of the resonant frequency and the -factor on DC gate voltage
Supplementary Fig. S3a shows the resonant frequency as a function of obtained by measuring the mixing current with the FM technique [3] as a function of and drive frequency . The intensity of varies with because it is proportional to the transconductance. The resonant frequency is linear in . Supplementary Fig. S3c shows the inverse of the -factor as is stepped from the bottom of an oscillation in to the top of this oscillation. No variation of is seen.
The dependences of and on are different from what is observed in nanotube resonators operated in the Coulomb blockade regime. There, the resonator experiences a reduction of near the top of an oscillation in as a function of . In addition, is higher near the top of the oscillation in because electron tunneling events are accompanied by enhanced dissipation. The absence of such behaviors demonstrates that the effect of the coupling between vibrations and Coulomb blockade is weak in our experiment.
VII Effect of electrostatic white noise on the spectrum of the resonator.
Figure 3f of the main text displays in the presence of gate voltage noise of various intensities. The gate voltage noise is applied using the Johnson-Nyquist noise of a 50 Ohm resistor at room temperature amplified by different gains (by varying the number of amplifiers). We measure the power spectral density of the amplified Johnson-Nyquist noise with a signal analyzer in a separate experiment. We verify that this amplified noise is white (the power spectral density is constant) between 1 MHz and 200 MHz, a frequency range that encompasses the resonant frequency of our resonator (40-60 MHz). Noise at frequencies below 1 MHz is cut off by a high pass filter at the sample stage. The power spectral densities we measure are consistent with the gain (20 dB) and the noise figure (1 dB) of each amplifier used in combination with the total attenuation along our radio frequency lines.
The applied Johnson-Nyquist noise creates a random electrostatic force between the nanotube and the gate (top axis of Fig. 3f). To the lowest order in the nanotube displacement, this force is additive, which means that it is independent of the displacement. The nanotube resonator responds primarily to the frequency components of this force, which lie within the band centered at the resonant frequency, with the typical bandwidth given by the mechanical linewidth. The power spectrum of the random force is flat in this region, and therefore the corresponding noise is white. Its intensity is related to the power spectral density of the Johnson-Nyquist noise as (see Section IV). We use F/m, 2.2 V, and .
The effect of the additive Johnson-Nyquist noise is fully analogous to the effect of the thermal noise that comes along with the resonator dissipation. It leads to the increase of the intensity of the peak in the resonator power spectrum and to spectral broadening of this peak via nonlinear damping and via the dependence of the oscillator frequency on the vibration amplitude.
The low-frequency components of the Johnson-Nyquist noise could directly lead to fluctuations of the resonator frequency, which would be similar to the low-frequency fluctuations induced by the voltage noise of the DC voltage source. They would come from the dependence of the resonator frequency on the gate voltage. Such noise is multiplicative, since the corresponding force is proportional to the resonator displacement, and this is why it acts as a frequency shift. The resonator responds to such noise if its frequencies are low, within the typical bandwidth given by the mechanical linewidth. Higher-frequency components are averaged out. For the Johnson-Nyquist noise that we are using the effect of this noise is very weak, because the initial noise from the 50 Ohm resistor is only weakly amplified below 100 kHz, and is further attenuated by a high-pass filter below 10 kHz. We estimate that the corresponding gate voltage fluctuations induce a lineshape broadening of only a fraction of a Hertz, much smaller than the linewidths we measure in Fig. 3f.
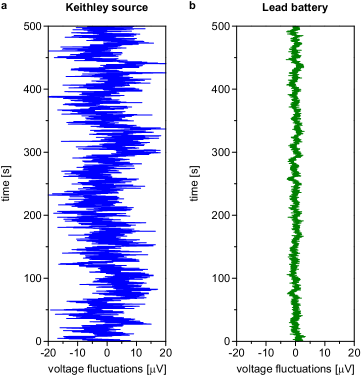
VIII Voltage fluctuations of the DC voltage sources
The voltage fluctuations of both the Keithley source and of the lead battery are measured in a separate experiment. The DC source is connected to the DC gate voltage input port outside of the cryostat. A finite DC voltage close to the gate voltages used in the main text is applied. The voltage fluctuations at 300 K are measured at the sample stage after opening the cryostat. These fluctuations are recorded with a voltmeter as a function of time (Supplementary Fig. S4). The measured voltage fluctuations are larger than the intrinsic readout fluctuations of the voltmeter. These measurements are used to estimate the Allan deviation in Figs. 3c,d (blue traces) of the main text.
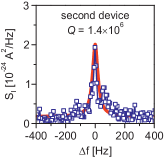
IX Additional sample
We investigated a second nanotube resonator device operated in the Fabry-Perot regime at a refrigerator temperature of 30 mK. An example of a high resonance for this device is shown in Supplementary Fig. S5. The parameters used for this measurement are: V, V, and a measurement time of 4.8 s. The measurements were carried out with the Keithley source.
X Power spectrum for a finite measurement time
Below, power spectral densities are all two-sided. The power spectrum of displacement fluctuations for a finite measurement time reads
| (S9) |
We make the change from fast oscillating variables , to slow complex oscillator amplitude
| (S10) |
Plugging Eqs. (S10) into the equation of motion , and solving for in the rotating wave approximation, we obtain
| (S11) |
In the above expression, is the frequency noise, is the thermal noise with correlator , and is the modal mass. Using Eqs. (S10) and (S11) along with Eq. (S9), we obtain
| (S12) | ||||
In Eq. (S12), we average over thermal noise since its correlation time is short on the scale . We can now separate into two parts, one slow and the other fast on the scale of the ring-down time : . We assume that is -correlated, which allows to simplify the power spectrum in Eq. (S12) as
| (S13) |
where is the “instantaneous” half-width of the spectrum and is the resonant angular frequency, both renormalized by fast frequency noise. The relation between and can be found in Supplementary Ref. [4]. Equation (S13) is Eq. (2) in Methods. The resonant peak corresponding to only exists for ; the fact that resonance lineshapes remain close to Lorentzian indicates that our measurement times exceed .
We emphasize that is -correlated on the “slow” time scale , not on the fast scale . It is seen from Eq. (S12) that the components of with frequencies much higher than are averaged out and therefore can be disregarded, as we indicated earlier. The case where the frequency noise has significant intensity near , so that it parametrically excites the resonator, requires a separate analysis, but we have no indications and no physical reasons to expect that strong frequency noise with frequencies is present in our case.
The separation of the frequency noise into parts that are slow and fast on the time scale leaves out a comparatively narrow part of the noise spectrum. This part is averaged out when, as in our case, the duration of a measurement . It is reasonable to expect that the contribution of this narrow range of the frequency noise spectrum is small. Additional information about the spectrum of the frequency noise can be obtained by studying the power spectrum of the resonator in the presence of periodic modulation [4].
The integral width of the spectrum can be obtained from Eq. (S13). The integral width is expressed as the ratio , where is the spectrum area and is the resonance height in the spectrum. The area is independent of frequency noise or decay rate. For a Lorentzian spectrum () we have
where is the quality factor.
Next, we calculate , a good number to characterize for asymmetric and noisy resonances. For slow frequency noise of weak intensity, the expression for the reciprocal width takes on a “finite-time variance” form:
| (S14) |
where is the measured shift of the resonant frequency resulting from slow frequency noise. The term in square brackets in Eq. (S14) is always positive, resulting in the two following effects:
-
1.
For a fixed measurement time , multiple measurements of the integral width give an asymmetric distribution of ;
-
2.
As increases, the peak value of the distribution of decreases, whereas the mean increases. Once exceeds the noise correlation time, levels off to the value .
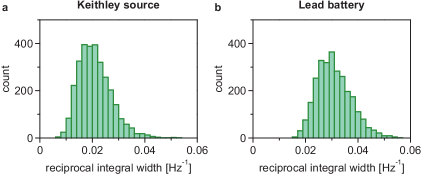
Supplementary Fig. S6 shows histograms of built from the spectra used to construct the histograms in Figs. 2c,d of the main text. If, as we assume, the modulation of the conductance is linear in the resonator displacement, the current-to-displacement scaling coefficient drops out from . Therefore, the value of can be found directly from the data on the current power spectra. Histograms of are asymmetric, in agreement with effect (1) predicted above. In addition, Fig. 3a of the main text shows that the peak value of the linewidth distribution tends to level off for long measurement times, in agreement with effect (2). (From that figure, we infer that the spectrum of the frequency noise has a cutoff around 1/20 Hz.) Slow fluctuations of the decay rate and/or the intensity of the thermal noise would not lead to the observed increase of the the peak value of the linewidth distribution with measurement time, but rather would cause to decrease.
References
- [1] Benyamini, A., Hamo, A., Viola Kusminskiy, S., von Oppen, F. & Ilani, S. Real-space tailoring of the electron phonon coupling in ultraclean nanotube mechanical resonators. Nature Physics 10, 151-156 (2014).
- [2] Moser, J., Güttinger, J., Eichler, A., Esplandiu, M. J., Liu, D. E., Dykman, M. I. & Bachtold, A. Ultrasensitive force detection with a nanotube mechanical resonator. Nature Nanotech. 8, 493-496 (2013).
- [3] Eichler, A., Moser, J., Chaste, J., Zdrojek, M., Wilson-Rae, I. & Bachtold, A. Nonlinear damping in mechanical resonators made from carbon nanotubes and graphene. Nature Nanotech. 6, 339-342 (2011).
- [4] Zhang, Y., Moser, J., Güttinger, J., Bachtold, A. & Dykman, M. I. Interplay of driving and frequency noise in the spectra of vibrational systems. arXiv:1406.1406