2015/3/25\Accepted2015/4/16
black hole physics — gravitational lensing: strong — galaxies: individual (H-ATLAS J090311.6+003906) — galaxies: structure — submillimeter: galaxies
High-resolution ALMA observations of SDP.81. I. The innermost mass profile of the lensing elliptical galaxy probed by 30 milli-arcsecond images
Abstract
We report a detailed modeling of a mass profile of a massive elliptical galaxy using 30 milli-arcsecond resolution 1-mm Atacama Large Millimeter/submillimeter Array (ALMA) images of the galaxy–galaxy lensing system SDP.81. The detailed morphology of the lensed multiple images of the infrared-luminous galaxy, which is found to consist of tens of -pc-sized star-forming clumps embedded in a kpc disk, are well reproduced by a lensing galaxy modeled by an isothermal ellipsoid with a 400 pc core. The core radius is consistent with that of the visible stellar light, and the mass-to-light ratio of is comparable to the locally measured value, suggesting that the inner 1 kpc region is dominated by luminous matter. The position of the predicted mass centroid is consistent to within mas with a non-thermal source detected with ALMA, which likely traces an active galactic nucleus of the foreground elliptical galaxy. While the black hole mass and the core radius of the elliptical galaxy are degenerate, a point source mass of mimicking a supermassive black hole is required to explain the non-detection of a central image of the background galaxy. The required mass is consistent with the prediction from the well-known correlation between black hole mass and host velocity dispersion. Our analysis demonstrates the power of high resolution imaging of strong gravitational lensing for studying the innermost mass profile and the central supermassive black hole of distant elliptical galaxies.
1 Introduction
Galaxy–galaxy lensing occurs ubiquitously in the observable universe. Magnified images from gravitational lensing allow us to understand the detailed mass structure of the intervening galaxy as well as the background source structure (e.g., [Koopmans (2005), Inoue & Chiba (2005), Vegetti et al. (2012), Hezaveh (2013a), Hezaveh et al. (2013b), Hezaveh (2014)]). Furthermore, a detection or absence of a central lensed image offers a unique opportunity to map the innermost mass distribution of the lensing galaxy and to directly measure the mass of the central supermassive black hole (SMBH, [Mao et al. (2001), Winn et al. (2004), Inada et al. (2008)]). Precise mass modeling requires sensitive, extinction-free, and extremely high resolution imaging toward the very center of a lensing galaxy (Hezaveh et al., 2015). This is now possible with long baseline capabilities offered by the Atacama Large Millimeter/submillimeter Array (ALMA). Here we present a detailed modeling of a mass profile of the elliptical galaxy, which is the foreground galaxy in the galaxy–galaxy lensing system H-ATLAS J090311.6+003906 (SDP.81), using 30 milli-arcsec (mas) resolution 1-mm images obtained at ALMA.
SDP.81 is a gravitationally lensed galaxy discovered in the Herschel Astrophysical Terahertz Large Area Survey (H-ATLAS, Eales et al. (2010)). The characteristic features (“Einstein ring”) are evident in the resolution interferometric maps (Negrello et al., 2010; Omont et al., 2013; Bussmann et al., 2013) and the Hubble Space Telescope (HST) image (Negrello et al., 2014; Dye et al., 2014), indicating strong magnification. Carbon Monoxide (CO) and water (H2O) emission were successfully detected from the background galaxy (Omont et al., 2013). The foreground elliptical galaxy is identified in the Sloan Digital Sky Survey (SDSS) as SDSS J090311.57+003906.5 (hereafter SDSS J0903) with a spectroscopic redshift of (Negrello et al., 2014). We hereafter refer to the foreground and background galaxies as SDSS J0903 and SDP.81, respectively. Detailed discussion on the spatial/kinematic structure and the star-formation activity in SDP.81 will be presented in a subsequent paper (Paper II; Hatsukade et al. (2015)).
Throughout this paper, we assume a flat universe with , , and km s-1 Mpc-1. The angular scale of corresponds to 4.36 kpc at the lens redshift and 7.78 kpc at source redshift .
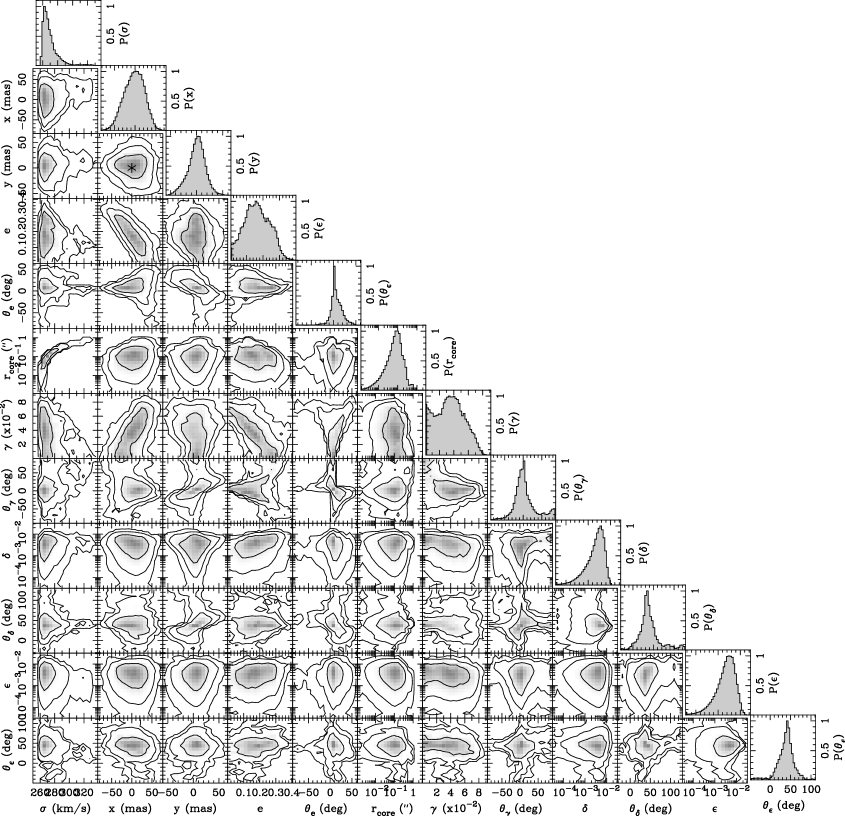
Lens model parameters. a a b c c d ()e e ()f f ()g g {tabnote} The errors represent 68% confidence intervals estimated from a Markov-chain Monte Carlo simulation. (a) The central position of an isothermal ellipsoid in units of mas, relative to the position of the non-thermal source at \timeform9h3m11.573s, \timeform+0D39’6.54”, respectively. (b) Velocity dispersion of the isothermal ellipsoid (km s-1). (c) Ellipticity and its position angle (deg). (d) core radius of the isothermal ellipsoid (mas). (e) external shear and its position angle (deg). (f) third-order external perturbation and its position angle (deg). (g) multipole perturbation with and its position angle (deg). See Oguri (2010) for the definitions of the parameters.
2 Data
2.1 ALMA observations and images
The ALMA data at wavelengths of 1.0, 1.3 and 2.0 mm were obtained during the long baseline campaign of Science Verification (ALMA Partnership, 2015b). The resulting spatial resolution achieved at 1.0, 1.3 and 2.0 mm are mas (PA = 15), mas (PA = 20) and mas (PA = 18), with r.m.s. noise level of 10, 10, and 9 Jy beam-1, respectively. The CO (5–4), (8–7) and (10–9) images were also taken simultaneously in the 2.0, 1.3 and 1.0 mm bands, respectively. The CO images are -tapered to mas in order to increase the sensitivity to extended structure. Details of the observations are given in ALMA Partnership (2015a) and ALMA Partnership (2015b).
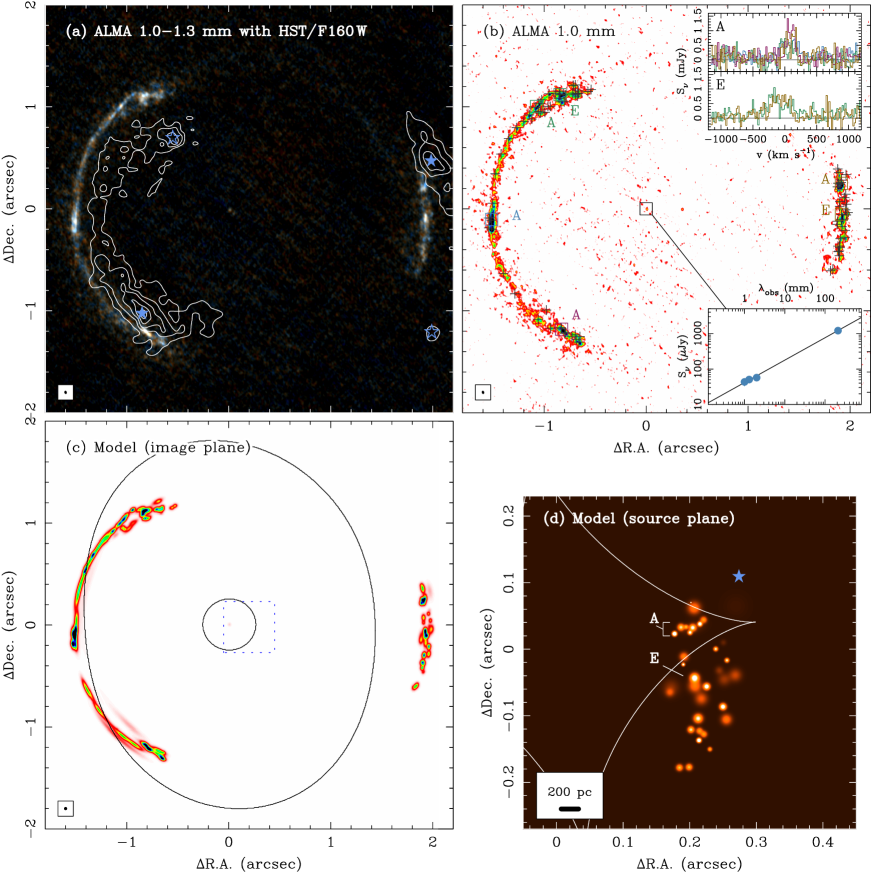
A three-color image composed from the 1.0 and 1.3 mm data are shown in figure 1a. The quadruple images of SDP.81 are clearly resolved, three of which are bridged by a -long arc. The arcs consist of four bright knots connected by thin smooth filaments. The grainy clumps seen around the arcs are not coherent among the different frequency bands (figure 1a), and thus they are likely to be artifacts due to phase calibration residuals. On the other hand, we find fainter, but significant knots embedded in the arcs that are consistent in all different waveband images. These are real features that are likely tracing the internal substructures of SDP.81. A central point source bracketed by the long and short arcs is not resolved with the Band 7 beam and has a 1.0–2.0 mm power-law spectral index of (ALMA Partnership, 2015a). The extrapolated flux at 20 cm is consistent with that of the cataloged radio source FIRST J090311.5+003906 ( mJy beam-1, Becker et al. (1995)). The power-law spectral index from 1.0 mm to 20 cm is (see inset of figure 1b), which is consistent with the spectral index measured for 1.0–2.0 mm. If the non-thermal emission arises from SDP.81, it should also dominate the emission from the arcs. However, the observed spectral index of the arc is positive (typically ), meaning that dust emission is the better model to explain the emission characteristics of the arc ALMA Partnership (2015a). Furthermore, no molecular lines of CO and H2O at are found at the position. It is therefore likely that the non-thermal emission arises from an Active Galactic Nucleus (AGN) of SDSS J0903.
2.2 Hubble images
We retrieve the archival HST image (proposal ID: 12194, Negrello et al. (2014)) taken with the Wide Field Camera 3 (WFC3) at 1.6 (F160W, H band). The point spread function (PSF) is 151 mas in FWHM. We calibrate the coordinates of the WFC3 image using the catalog data from the SDSS Data Release 12111http://skyserver.sdss.org/dr12. We use 46 SDSS objects located in the WFC3 image to derive the astrometric fit using iraf. The r.m.s. errors of the fit are 85 mas in right ascension and 100 mas in declination. The nominal center of SDSS J0903 matches the position of the central non-thermal source in the ALMA images within 15 mas.
We use the galfit software (Version 3.0.5, Peng et al. (2010)) to deblend the stellar light in SDP.81 from SDSS J0903. Following the procedure adopted by Negrello et al. (2014), two Sérsic profiles are simultaneously fitted to the HST image. As a result, the radial profile of SDSS J0903 is decomposed into a brighter (H-band absolute AB magnitude of ) elliptical with a Sérsic index of and a fainter () exponential disk with . Although our total flux is higher, this is consistent with the model presented by Negrello et al. (2014). The residual image shown in figure 1 clearly exhibits the stellar arcs which are significantly ( mas) offset from the 1-mm ALMA arcs (see Paper II for the interpretation).
3 Gravitational lens model
3.1 Methods and results
We use the glafic software (Oguri, 2010)222http://www.slac.stanford.edu/%7Eoguri/glafic/ to reproduce the lensed image using an isothermal ellipsoid with a flat core. The choice of an isothermal ellipsoid is supported by the fact that the radial density profile of SDSS J0903 is consistent with (Dye et al., 2014; Rybak et al., 2015), which is the profile expected for an isothermal ellipsoid. The structure of SDP.81 is, however, too complex to be accounted for by a single isothermal ellipsoid alone. We examine the SDSS cluster catalog of Oguri (2014) and find a cluster of galaxies at with the richness of and located away from SDSS J0903. Therefore we include the third-order and quadrupole perturbations of mass333We use glafic mass models clus3 for the third-order external perturbation and mpole with for the quadrupole perturbation (equation 13 of Oguri (2010)). The central positions of the perturbation components are fixed to that of the isothermal ellipsoid., in addition to the standard external shear, to take into account the gravitational influence of the cluster and large-scale structure.
We identify compact knots in the arcs that are common in the 1.0, 1.3, and 2.0 mm images and then identify two sets of counter-images of the knots in SDP.81. These are shown as open squares in figure 1b (A and E). The counter-images of each set are extracted by visually identifying continuum intensity peaks which share the same/similar CO (5–4) and (8–7) spectral profiles at each of the peaks. Figure 1b shows how the counter-images are identified; all of the CO (5–4) spectra at the positions of A have a peak at km s-1 while the peaks at E appear near km s-1 and have broader line profiles than A, which likely correspond to the red and blue components reported by Omont et al. (2013) and ALMA Partnership (2015a), respectively. This method allows us to predict that the knots A are quadruple lensed images of a single source, whereas the knots E are double images and thus the (tangential) caustics should lie between A and E on the source plane. First, we obtain an initial mass model only with the isothermal ellipsoid and external shear using the positions of A and E. Then we use the initial mass model to identify groups of counter-images of knots found in the 1.0-mm continuum image. The knots within mas from the predicted positions are identified as the counter-images, resulting in identifications of 46 images. We then refine the mass model by adding the higher-order perturbations (the number of independent parameters is 12) and fitting all of the identified multiple images. In the model calculation, we also consider two sets of double images identified with the 1.6- HST image, which is indicated by star symbols in figure 1a. The number of degrees of freedom (DOF) is thus . The positional uncertainty of the knots used for optimization is set to 20 mas, while the uncertainties of the 10 knots which are close to the critical curve and/or possibly suffering from blending are set to 100–200 mas. The uncertainties of the four HST images are set to 130–200 mas.
The best-fit parameters of the mass model444The glafic model of SDP.81 is available at http://www.ioa.s.u-tokyo.ac.jp/%7Eytamura/SDP81/. are listed in table 1, where the confidence intervals are computed by Marcov-chain Monte Carlo simulations as shown in figure 2. Note that the core radius () and velocity dispersion () of the isothermal ellipsoid are highly degenerate. The central position of the isothermal ellipsoid is not only consistent with the brightness peak of the stellar distribution within the astrometric uncertainty of HST ( mas), but also with the location of the candidate AGN, i.e., , to within mas (). This suggests that the AGN is indeed located at the bottom (innermost -pc) of the potential well of SDSS J0903. The best-fit parameters of the isothermal ellipsoid and external shear are in good agreement with those independently obtained using the same ALMA images (Rybak et al., 2015; Dye et al., 2015)555Note that the ellipticity used in Rybak et al. (2015) is related by . and the HST images (Dye et al., 2014) at level.
The crosses in figure 1b mark the positions of the counter-images predicted by this model, and we find that the model is qualitatively consistent with the peak positions of the 1.0-mm brightness distribution (). Figures 1c and 1d show the predicted brightness distributions on the image and source planes, respectively. The observed images are reproduced by 35 -pc-sized knots embedded in an extended ( kpc) disk. While the uncertainty is relatively large, the total magnification factor is expected to be . This is consistent with the value obtained by Rybak et al. (2015) ( for total, for a central star-forming disk), while it is higher than the value previously obtained with the SMA (, Bussmann et al. (2013)). This is likely because, as suggested by Rybak et al. (2015), the ALMA image allows us to identify more compact structures close to the caustics, resulting in higher magnifications than those obtained previously.
3.2 Mass profile of SDSS J0903
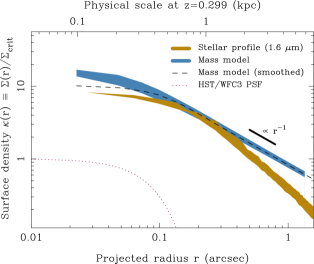
In figure 3, we show the surface mass profile of the gravitational lens model normalized by a cosmological critical density for a source redshift (i.e., convergence ) and a radial profile of the 1.6- stellar light obtained by the HST/WFC3 F160W imaging observations. The critical density is kpc-2, and the stellar surface mass is scaled using a fiducial mass-to-light ratio of at (e.g., Bell et al. (2003)), which is a typical value for local massive ellipticals. Because the stellar profile is lowpass-filtered by the PSF of HST (151 mas, see the dotted curve), the profile is only reliable at . It is evident that there is a knee in the stellar profile at a characteristic radius of .
In figure 3, we also show the lensing mass profile smoothed by the HST PSF. The knee position and the amplitude of the profile are in agreement with the lens model. Although the derived core ( mas, which corresponds to a core diameter of 400 pc) is slightly smaller than the stellar core ( mas), the two core radii are consistent to within the uncertainty. Furthermore, the position angle of the isothermal ellipsoid () is consistent with that of the stellar profile (, Dye et al. (2014)), suggesting that the baryonic matter, traced by the stellar light, dominates the mass in the inner 1-kpc region of the galaxy. At larger radii ( kpc), however, the stellar light falls below the model surface density (), which can be interpreted as the presence of dark matter in the outer parts of SDSS J0903.
4 Discussions and conclusions
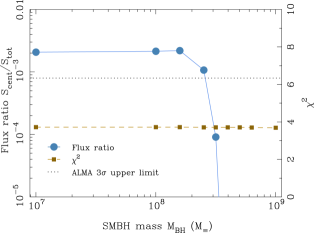
The non-detection of the central ‘odd’ image of SDP.81 in the deep ALMA images rules out a top-flat plateau in the gravitational potential, but instead requires the presence of a steep (or cuspy) radial profile in the innermost potential distribution. A SMBH can make the central potential more cuspy even if the stellar mass distribution is top-flat as suggested from the WFC3 radial profile. As a consequence, this can erase the central image if the black hole is massive enough to fully perturb the core potential. Since there is a clear sign of the presence of an AGN at the center of SDSS J0903, we add a point source mimicking the SMBH to the lens model in order to investigate how the SMBH affects the flux of the central image. A point mass with to is placed at the position of the AGN and is fixed to the stellar core radius of mas, while the rest are treated as free parameters ().
Figure 4 shows Scent/Stot (i.e. the ratio between the flux from the central image to all of the counter-images) as a function of . The fit to the model is generally good () in the range of . The ratio is insensitive to the black hole mass if it is less than , but the central image rapidly dims as the black hole mass is higher than . The horizontal dotted line shows the upper limit of the 1.0-mm image (30 Jy) divided by the total flux ( mJy, ALMA Partnership (2015a)), suggesting that the ALMA non-detection places a constraint to the black hole mass of . Note that if we adopt mas, the limit is slightly relaxed to .
A black hole mass can independently be estimated from the well-known correlation between black hole mass and the velocity dispersion of the bulge (e.g., Ferrarese & Merritt (2000); Gebhardt et al. (2000)). The black hole estimated from the velocity dispersion of the lens ( km s-1, Table 1) and using the local correlation (Kormendy & Ho, 2013) is , which is consistent with the lower limit derived above. It will difficult to detect the central image of SDP.81 even in future ALMA observations if . We demonstrate in this work that the detailed gravitational lens modeling using sensitive, high-resolution imaging with ALMA is capable of constraining the central kpc mass profile and the black hole mass, which will help us understand the co-evolution of the SMBHs and the host galaxies through, for example, SMBH scouring (Hezaveh et al., 2015).
Finally, we note that a similar conclusion on the mass of the SMBH () was made by a recent analysis by Wong et al. (2015), where they used an independent code glee (Suyu & Halkola, 2010) and different sets of multiple images from the ALMA images tapered to mas to construct a lens model. Nevertheless, we prefer to use the full resolution ALMA images (up to 23 mas), which allows us to (1) accurately model higher-order perturbations, and to (2) robustly identify multiple features in the images and construct a reliable lens model.
We thank the anonymous referee for fruitful comments. This work is supported by KAKENHI (No. 25103503, 26800093 and 20647268). MO is supported in part by World Premier International Research Center Initiative (WPI Initiative), MEXT, Japan. DI is supported by the 2015 Inamori Research Grants Program. This paper makes use of the following ALMA data: ADS/JAO.ALMA #2011.0.00016.SV. ALMA is a partnership of ESO (representing its member states), NSF (USA) and NINS (Japan), together with NRC (Canada), NSC, ASIAA (Taiwan) and KASI (Republic of Korea), in cooperation with the Republic of Chile. The Joint ALMA Observatory is operated by ESO, NAOJ and NRAO.
References
- ALMA Partnership (2015a) ALMA Partnership, Vlahakis, C., Hunter, T. R., et al. 2015, ApJ, in press (arXiv:1503.02652)
- ALMA Partnership (2015b) ALMA Partnership, Fomalont, E. et al. 2015, ApJ, submitted
- Becker et al. (1995) Becker, R. H., White, R. L., & Helfand, D. J. 1995, ApJ, 450, 559
- Bell et al. (2003) Bell, E. F., McIntosh, D. H., Katz, N., & Weinberg, M. D. 2003, ApJS, 149, 289
- Bussmann et al. (2013) Bussmann, R. S., Pérez-Fournon, I., Amber, S., et al. 2013, ApJ, 779, 25
- Dye et al. (2014) Dye, S., Negrello, M., Hopwood, R., et al. 2014, MNRAS, 440, 2013
- Dye et al. (2015) Dye, S., Furlanetto, C., Swinbank, A. M., et al. 2015, MNRAS, submitted (arXiv:1503.08720)
- Eales et al. (2010) Eales, S., Dunne, L., Clements, D., et al. 2010, PASP, 122, 499
- Ferrarese & Merritt (2000) Ferrarese, L., & Merritt, D. 2000, ApJ, 539, L9
- Gebhardt et al. (2000) Gebhardt, K., Bender, R., Bower, G., et al. 2000, ApJ, 539, L13
- Hatsukade et al. (2015) Hatsukade, B., Tamura, Y., Iono, D., et al. 2015, PASJ, submitted (arXiv:1503.07997)
- Hezaveh (2013a) Hezaveh, Y. D., Dalal, N., Holder, G., et al. 2013, ApJ, 767, 9
- Hezaveh et al. (2013b) Hezaveh, Y. D., Marrone, D. P., Fassnacht, C. D., et al. 2013, ApJ, 767, 132
- Hezaveh (2014) Hezaveh, Y. D. 2014, ApJ, 791, L41
- Hezaveh et al. (2015) Hezaveh, Y. D., Marshall, P. J., & Blandford, R. D. 2015, ApJ, 799, L22
- Inada et al. (2008) Inada, N., Oguri, M., Falco, E. E., Broadhurst, T. J., Ofek, E. O., Kochanek, C. S., Sharon, E., & Smith, G. P. 2008, PASJ, 60, L27
- Inoue & Chiba (2005) Inoue, K. T., & Chiba, M. 2005, ApJ, 633, 23
- Koopmans (2005) Koopmans, L. V. E. 2005, MNRAS, 363, 1136
- Kormendy & Ho (2013) Kormendy, J., & Ho, L. C. 2013, ARA&A, 51, 511
- Mao et al. (2001) Mao, S., Witt, H. J., & Koopmans, L. V. E. 2001, MNRAS, 323, 301
- Negrello et al. (2010) Negrello, M., Hopwood, R., De Zotti, G., et al. 2010, Science, 330, 800
- Negrello et al. (2014) Negrello, M., Hopwood, R., Dye, S., et al. 2014, MNRAS, 440, 1999
- Oguri (2010) Oguri, M. 2010, PASJ, 62, 1017
- Oguri (2014) Oguri, M. 2014, MNRAS, 444, 147
- Omont et al. (2013) Omont, A., Yang, C., Cox, P., et al. 2013, A&A, 551, AA115
- Peng et al. (2010) Peng, C. Y., Ho, L. C., Impey, C. D., & Rix, H.-W. 2010, AJ, 139, 2097
- Rybak et al. (2015) Rybak, M., McKean, J. P., Vegetti, S., Andreani, P., & White, S. D. M. 2015, MNRAS, submitted (arXiv:1503.02025)
- Suyu & Halkola (2010) Suyu, S. H., & Halkola, A. 2010, A&A, 524, AA94
- Vegetti et al. (2012) Vegetti, S., Lagattuta, D. J., McKean, J. P., et al. 2012, Nature, 481, 341
- Winn et al. (2004) Winn, J. N., Rusin, D., & Kochanek, C. S. 2004, Nature, 427, 613
- Wong et al. (2015) Wong, K. C., Suyu, S. H., & Matsushita, S. 2015, MNRAS, submitted (arXiv:1503.05558)