New insights into the evolution of the FR I radio galaxy 3C 270 (NGC 4261) from VLA and GMRT radio observations
Abstract
We present Giant Metrewave Radio Telescope (GMRT) 240 MHz observations of the nearby luminous FR I radio source 3C 270, in the group-central elliptical NGC 4261. Combining these data with reprocessed Very Large Array (VLA) 1.55 and 4.8 GHz observations, we produce spectral index maps that reveal a constant spectral index along the jets and a gradual steepening from the ends of the jets through the lobes towards the nucleus. A Jaffe & Perola (JP) model fitted to the integrated spectrum of the source gives an asymptotic low-frequency index of , while JP models fitted to the observed spectral index trend along the lobes allow us to estimate radiative ages of Myr and Myr for the west and east lobes respectively. Our age estimates are a factor of two lower than the 75-Myr upper limit derived from X-ray data (O’Sullivan et al., 2011). We find unlikely the scenario of an early supersonic phase in which the lobe expanded into the ISM at approximately Mach 6 (3500 km s-1), and suggest that either the source underwent multiple AGN outbursts with possible large changes in jet power, or possibly that the source age that we find is due to a backflow that transports young electrons from the jet tips through the lobes toward the nucleus relatively quickly. We calculate that in the lobes the energy ratio of non-radiating to radiating particles is indicating significant gas entrainment. If the lobes are in pressure balance with their surroundings, the total energy required to heat the entrained material is erg, 40% of the total enthalpy of the lobes.
keywords:
galaxies: groups: general – ageing, radio galaxies: individual (3C 270, NGC 4261) —- galaxies: active1 Introduction
The study of radio galaxies has become increasingly important as they appear to be natural laboratories uniquely suited to the study of one of the most energetic phenomena in the Universe: relativistic jets arising from the associated active galactic nuclei (AGN). The reason this phenomenon is so important is that radio-loud activity of the central AGN is now considered to be the most likely source of the heating mechanism injecting energy into the hot gaseous halos of groups and clusters of galaxies, thereby balancing the effects of radiative cooling (Fabian 2012; McNamara & Nulsen 2007; Peterson & Fabian 2006).
The evolution of radio galaxies is commonly accepted to pass through three phases (as described in, e.g., Kraft et al., 2007). In the beginning, the inflation of the lobes surrounding the jets is highly supersonic as the lobes appear to be significantly over-pressured in relation to the ambient medium. After this early, in most sources short-lived, supersonic phase, the expansion of the lobes continues and their internal pressure drops, approaching equilibrium with the ambient gas. In the final phase jets shut down and the lobes eventually become unobservable due to energy losses. Examples of the complex interactions between radio lobes and a surrounding intra-cluster or intra-group medium (IGM) are relatively common in the local universe. Radio galaxies in groups and clusters are observed to drive shocks into the IGM (Nulsen et al. 2005; Fabian et al. 2006; Forman et al. 2007; David et al. 2011) which in some cases are detectable as X-ray surface brightness discontinuities (e.g. in 3C 310, Kraft et al. 2012 and PKS B2152-699, Worrall et al. 2012), and to inflate cavities (e.g. Bîrzan et al. 2008; O’Sullivan et al. 2011; Fabian 2012).
Present knowledge of the physical processes acting behind this phenomenology is still rather poor. In order to understand how AGN feedback works, the combination of high-quality X-ray data and high-sensitivity radio observations is essential. X-ray observations provide information on the physical properties of the environment surrounding the radio source, most notably the pressure of the IGM that the radio lobes are expanding into, and allow dynamical estimates of the expansion timescale and AGN power output. Multi-frequency radio data provide information on the cycle of jet activity, including independent estimates of the source expansion timescale and indications of the physical mechanisms of energy injection (Giacintucci et al., 2008, 2012).
With this aim we have chosen to examine NGC 4261, a nearby galaxy which has an active galactic nucleus that contains a supermassive black hole of (4.91.0)10 (Ferrarese, Ford & Jaffe, 1996) and hosts the low-power FR I radio source 3C 270. It is the brightest elliptical in a poor group (Forbes et al., 2006) projected onto the outskirts of the nearby Virgo cluster. Its proximity means that its features can be observed with good sensitivity and linear resolution, allowing detailed study of the energetics of lobe inflation.
3C 270 is composed of symmetric narrow kiloparsec-scale twin jets (Birkinshaw & Davies, 1985) which previous modelling studies indicate lie close to the plane of the sky (63; Piner et al. 2001, Laing & Bridle 2014), and which flare and broaden before extending tens of kiloparsecs into the intragroup medium (IGM) (Worrall et al., 2010). The jets emanate from a compact radio core coincident with the optical nucleus of the galaxy (Jones & Wehrle, 1997), where optical spectroscopy has revealed a low-ionization nuclear emission-line region (Ho, Filippenko & Sargent, 1997). In addition, a nearly edge-on nuclear disk (100-pc-scale) rich in dust, molecular and atomic gas (Jaffe et al., 1993), lies orthogonal to the radio jets (Tremblay et al., 2009). Laing & Bridle (2013) examined the 1.4-4.8 GHz spectral index of the base of the jets and found values of 0.65 at 10 from the nucleus, jumping to 0.72 at 14 and then declining to 0.6-0.65 at 50. The spectral index is defined as , where is the flux density at the frequency .
In the X-ray band, ROSAT images of the NGC 4261 group show diffuse thermal emission and a non-thermal nuclear component at low energies (Worrall & Birkinshaw, 1994). Chandra observations reveal X-ray jets in the inner few kiloparsecs of the radio jets (Gliozzi, Sambruna & Brandt, 2003; Zezas et al., 2005) and suggest a synchrotron origin for the jet X-ray emission.
More recent analysis of the Chandra and XMM-Newton data in O’Sullivan et al. (2011) shows much structure in the gas in which the galaxy is embedded. The AGN jets have inflated two lobes, producing cavities in the IGM and building up rims of compressed hot gas which almost entirely enclose the lobes. The cavity rims consist of material that has been swept up and compressed by the expansion of the lobes, weakly heated by compression with no evidence of shock heating (O’Sullivan et al., 2011). NGC 4261 hosts a small cool core with radius kpc and a temperature of keV, with the IGM temperature in the group being keV (Humphrey et al., 2009). The structure of the core has been disturbed by the expansion of the radio lobes and is not spherically symmetric (O’Sullivan et al., 2011), with wedge-shaped surface-brightness decrements that suggest the jets have driven out the IGM (or galactic gas) from conical regions around their first few kiloparsecs (Worrall et al., 2010).
Evidence of anisotropy in the globular cluster distribution has been seen (Giordano et al. 2005, Bonfini et al. 2012, D’Abrusco et al. 2013) while deep optical imaging has revealed a weak tidal tail to the north-west and a tidal fan extending southeast from the galaxy (Tal et al., 2009). These disturbed features suggest that NGC 4261 went through merging or tidal interactions with another galaxy within the past 1-2 Gyr.
In this paper we present a detailed low-radio-frequency spectral study of the galaxy NGC 4261. Previous studies have left the question of the radiative age of the source unclear and with our study will try to resolve this problem. Our work is based on archival data from the Giant Metrewave Radio Telescope (GMRT) at 610 MHz and 240 MHz and the Very Large Array (VLA) at 1.55 GHz and 4.8 GHz. The primary goals of this work are to determine the radiative age of 3C 270 and to understand the energetics and dynamics of the interaction between the relativistic plasma of the radio lobes and the X-ray emitting gas following O’Sullivan et al. (2011). The paper is organised as follows. In Sections 2 and 3 we describe the GMRT and VLA archival data used and the data reduction. The radio images are presented in Section 4. In Section 5 we derive the physical properties of the radio source. In Section 6 we discuss our results and consider the development of the radio source in the context of its environment. The summary and conclusions are finally presented in Section 7.
We adopt a distance to NGC 4261 of 31.3 Mpc, which gives an angular scale of kpc. This is consistent with the distance adopted by Worrall et al. (2010) and negligibly different from the distance adopted by O’Sullivan et al. (2011) who used an angular scale of kpc for their X-ray analysis. When correcting for redshift we adopt a value of z=0.007378 (Cappellari et al., 2011). The radio spectral index is defined according to , where is the flux density at the frequency .
| Project Code | Observation date | Frequency | Bandwidth | Integration time | HPBW111Using uniform weighting, PA | rms |
|---|---|---|---|---|---|---|
| (MHz) | (MHz) | (min) | (full array, ) | (mJy beam-1) | ||
| 15KMH01 | 2009 Feb 15 | 610 | 32 | 270 | 7.324.77, 76.62 | 1 |
| 15KMH01 | 2009 Feb 15 | 240 | 16 | 270 | 15.3011.00, 67.17 | 1.6 |
2 GMRT observations and data reduction
NGC 4261 was observed using the GMRT at 240 MHz and 610 MHz with total integration time of 4.5 hours in each band. At 610 MHz the data were recorded using the lower and upper side bands for an observing bandwidth of 16 MHz each. For the 240 MHz data only one correlator was used to record the data in a total observing bandwidth of 16 MHz where only half of the data were useful. Data for both frequencies were collected with 256 channels at a spectral resolution of 125 kHz per channel. The data were analysed and reduced using the NRAO Astronomical Image Processing System (AIPS) package. We summarize the details of the observations in Table 1, where we report the observing date, frequency, total observing bandwidth, total time on source, half-power beamwidth (HPBW) of the full array and rms level (1 ) at full resolution.
The data were edited to remove bad antennas and other obvious defects. Initially the phase and flux calibrators were checked and the data with extreme phase differences were removed. This procedure was also applied to our source. The data were calibrated and the flux density scale was defined using the amplitude calibrators 3C 286 and 3C 147. The task SETJY was used to set the flux density scale to “best VLA values (2010)”. The flux densities set for 3C 286 are 25.840.7 Jy for 240 MHz, 14.540.2 Jy for 1.5 GHz and 7.460.05 Jy for 4.8 GHz, while for 3C 147 the flux density at 240 MHz is 48.651.46 Jy. The calibrator flux densities agree with Perley & Butler (2013) to within 1% and the Scaife & Heald (2012) scale to within 3% except for 3C 147 at 240MHz, where the two scales disagree (60.952.26 Jy for Scaife & Heald 2012 at 240 MHz). The point source 1330+251 was used as phase calibrator for both 610 and 240 MHz. The bandpass was calibrated using observations of 3C 286, with channels that presented amplitude ‘spikes’ removed. At 610 MHz about 25% of the data were edited out. In order to increase signal-to-noise per channel during RFI removal while limiting the effects of bandwidth smearing, the channels were averaged into 6 of 2 MHz each at 610 MHz, and 4 of 1.5 MHz each at 240 MHz.
Due to the large field of view of the GMRT, the field was split into multiple facets for imaging. 56 facets were created at 610 MHz (with cellsize 1.5′′) and 85 facets were created at 240 MHz (with cellsize 3′′) so that in each facet the imaging field still approximates a plane surface. When recombined for our final image these give a field of view of at 610 MHz and at 240 MHz. After editing again the averaged data, repeated cycles of deconvolution were performed along with careful phase-only self-calibration in order to image the data. Most of the remaining noise in our final images arises from confusion and calibration uncertainties. At the lowest frequencies the phase errors are expected to originate from rapidly varying ionospheric delays.
The final images were corrected for the primary beam pattern of the GMRT using the task PBCOR in AIPS. The rms noise level (1) achieved in the final full resolution images is 1 mJy at 610 MHz, and 1.6 mJy at 240 MHz (see Table 1).
Chandra, Ray & Bhatnagar (2004) estimate the typical uncertainty on GMRT flux measurements to be 5% at 610 MHz and 8% at 240 MHz, including contributions from the uncertainty in the measurement of calibrator flux and uncertainties introduced by the telescope hardware. These are the levels of uncertainty which we quote in Table 4. In addition, they quote an elevation dependent error on the scale of 2-4, arising from changes in telescope response between the calibrator and source positions. These errors dominate over the systematic errors in the flux density scale.
Examination of the 610-MHz maps revealed ghost images containing up to 10% of the flux of the main image to the N and S of the true radio structure, presumably because of residual delay and amplitude errors, though no attempt to improve these corrections was successful. The 610-MHz image is generally similar to images with comparable angular resolution from the VLA (Section 3), but since the ghost images introduce false structure, we choose to use the 610 MHz data only for an estimate of the total flux density, and not for spectral analysis of regions within the source
We imaged the phase and flux calibrators to check the integrity of the calibrations. While these were as expected, the flux densities derived for 8 background sources in the 3C 270 field were found to be systematically low by about 20% at 240 and 610 MHz as compared with expectations based on literature measurements. At 240 MHz all source structures appeared normal, and it was considered appropriate to increase all flux densities, including those for 3C 270, by 20%. The same procedure was applied for the total flux density of 3C 270 at 610 MHz. We note that this discrepancy cannot be resolved by using the higher 240 MHz calibrator flux for 3C 147 suggested by the Scaife & Heald (2012) scale, since this only affects one of the two calibrators, and only at one frequency.
3 VLA observations and data reduction
From the VLA public archive we acquired and reanalysed the radio observations listed in Table 2. The data were calibrated and imaged in AIPS. In order to achieve the best possible noise level and coverage for the 1.55 GHz and 4.86 GHz VLA archival data, several datasets were combined for mapping. Individual observations were analysed separately until the stage where the source and calibrator data were separated. The SPLIT files were combined using DBCON and the analysis proceeded with phase-only self-calibration and imaging. For the 1.55 GHz data, as can be seen in Table 2, four different observations were combined together (AP0077, AV0088, AH0343 A and AH0343 B) in order to produce the final image with a total integration time of 61 minutes and an rms noise level of 0.8 mJy (Array B&C in Table 3). At 4.86 GHz only the D-array observation was used and analysed as it was sufficiently long and has a resolution comparable to the combined 1.55 GHz image. The properties of the resulting maps are given in Table 3.
| Project | Observation date | Array | Frequency | Bandwidth | Integration time |
|---|---|---|---|---|---|
| (GHz) | (MHz) | (min) | |||
| AP0077 | 1984 Apr 23 | C | 1.55 | 250 | 25 |
| AV0088 | 1984 Jun 05 | C | 1.49 | 250 | 16 |
| AH0343 A | 1989 Mar 15 | B | 1.57 | 250 | 10 |
| AH0343 B | 1989 Jul 28 | BnC | 1.57 | 250 | 10 |
| AL0693 B | 2007 Mar 18 | D | 4.86 | 250 | 81 |
The task LGEOM was used to rotate the data where needed, to match the VLA and GMRT observations for spectral index mapping. Finally the images were corrected for the primary beam response using the task PBCOR. Both images have spatial resolution similar to that of the GMRT 240 MHz image. We again adopted the “best VLA values (2010)” flux density scale.
| Array | Frequency | Integration time | HPBW, PA | rms |
|---|---|---|---|---|
| (GHz) | (min) | () | (mJy beam-1) | |
| B&C | 1.55 | 61 | 19.011.2, -55.35 | 0.8 |
| D | 4.86 | 81 | 15.810.7, -57.44 | 0.4 |
| Components | MHz | GHz | GHz | projected size | ||
|---|---|---|---|---|---|---|
| (Jy) | (Jy) | (Jy) | (kpc) | |||
| Total …. | 48.503.21 | 18.300.92 | 8.300.42 | 0.410.08 | 1.010.07 | |
| Core ….. | 0.480.04 | 0.360.02 | 0.370.02 | 0.160.10 | 0.030.08 | - |
| West jet.. | 10.600.85 | 3.800.19 | 1.380.20 | 0.470.09 | 0.900.15 | |
| East jet.. | 8.000.64 | 2.800.14 | 1.130.06 | 0.560.09 | 0.800.07 |
4 Radio images
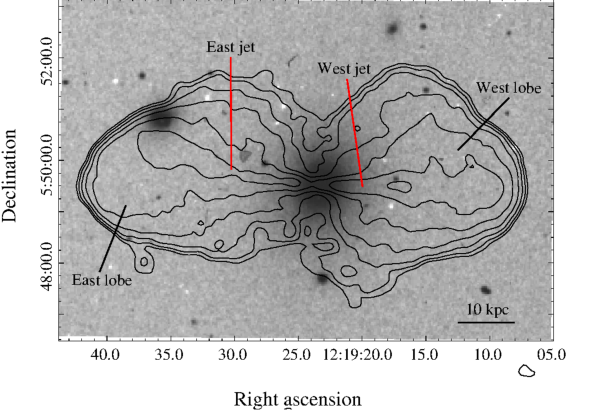
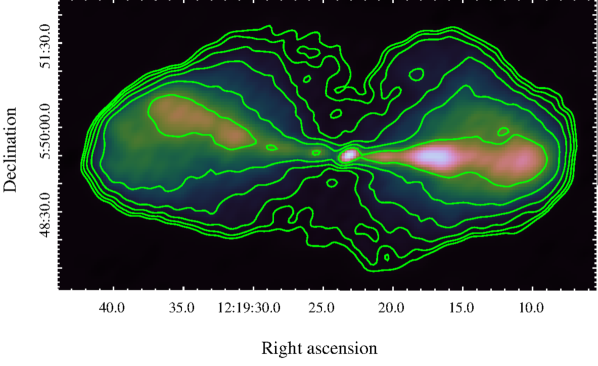
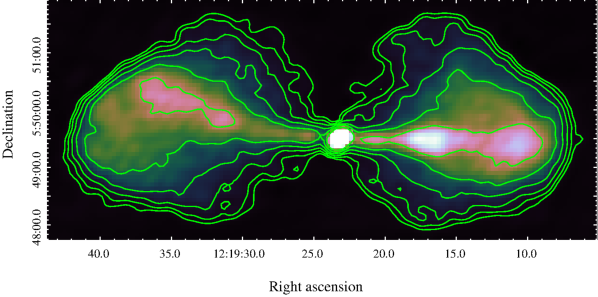
Figure 1 presents the GMRT 240 MHz radio image of 3C 270 at a resolution of 15.3 overlaid on the optical image from the Digitized Sky Survey. The contour levels start at 4 and rise by factors of 2. The most prominent components of the source, that is, the two symmetrical bright jets and their surrounding lobes, are labelled. The VLA images at 1.55 GHz and 4.86 GHz are shown in Figures 2 and 3 respectively. The jets are more prominent on the higher-frequency maps.
The radio jets extend in opposite directions for several tens of kpc from the host galaxy of NGC 4261, having a similar morphology at all frequencies and at different restoring beams. The two bright jets are continuous and inflate two fairly round radio lobes that surround the jets. However, as expected, the prominence of the compact core increases with frequency, and it is clearly detected at 1.55 and 4.86 GHz, but not at 240 MHz.
There are two morphological differences between the two jets: first, the eastern jet bends to the north whereas the western one is straight but noticeably broadens and brightens 1-2′ from the nucleus; second, the western lobe is slightly less extended than the eastern one. These differences may be caused by interactions with their surroundings, but we see no evidence of a denser environment on either side in the X-ray. O’Sullivan et al. (2011) note that the change in the direction of the eastern jet could be misleading, since we are viewing a projected image of a three-dimensional structure.
Table 4 summarises the properties of the source and its components including flux density, the spectral index in the 240 MHz1.55 GHz frequency range and the apparent linear size. The largest projected linear size of the source at all frequencies is 80 kpc, with a total angular extent of along the east/west axis. The jets have similar flux density and size, with the eastern jet being about 2 kpc longer, while the western jet flux density is 10 greater than the eastern one. As is evident from Figures 1, 2 and 3, at lower frequencies the lobe emission extends far enough to connect the lobes north and south of the nucleus, but at 4.8 GHz no such connection is observed. This is the first clear indication of the strong spectral gradients present in the radio emission of NGC 4261.
is given, as well as the reduced value from the fit.
5 Radio spectral analysis and physical parameters
The archival GMRT and VLA radio data were combined with data from the literature in order to calculate the integrated radio spectrum of 3C 270. The physical parameters of 3C 270 were then calculated using the spectral index distribution of the source. The analysis described below was performed using the Synage++ package (Murgia, 2000).
5.1 Spectral analysis
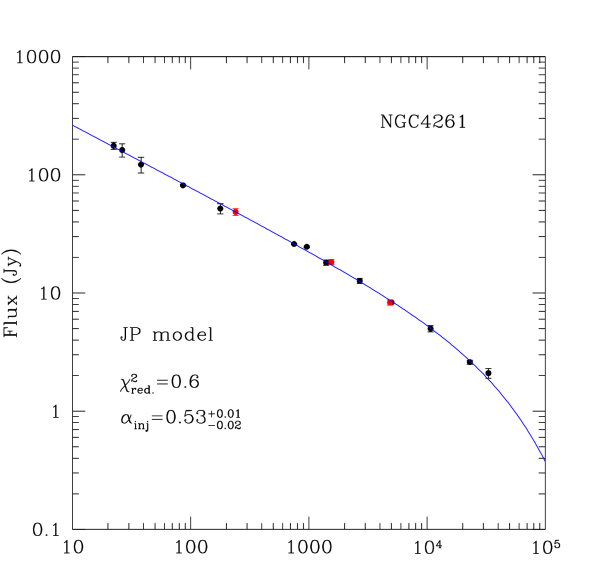
The integrated radio spectrum between 22 MHz and 33 GHz for 3C 270 is shown in Figure 4. Table 5 lists the literature flux densities used in the spectrum, and the source of each measurement. Adding our VLA measurements to the literature data, we fit a (Jaffe & Perola, 1973) (JP) model to the integrated spectrum. Our aim in fitting this model is firstly to determine whether the low-frequency data can be well modelled as a power-law, whose slope will approximate the injection spectral index, and secondly to allow us to compare our GMRT flux density measurements with the well-calibrated data from other frequencies. The model assumes that the radiative timescale of the electrons is much longer than their timescale for continuous isotropisation. The resulting fit describes the low frequency data well, with an asymptotic low-frequency index of , typical of FR I jets (Young et al., 2005). The slope steepens above 5 GHz, with a break frequency of 85 GHz, though this is likely driven to a high value owing to the high luminosity of the relatively young plasma in the jets and core. We note that a continuous-injection (CI) model gives an identical fit.
The maximum spatial scale resolved in our GMRT and VLA images is large compared to the source, with the possible exception of the 4.86 GHz VLA observation (72′, 28′, 19′ and 6′ at 240, 610, 1550 and 4860 MHz respectively). However, the VLA 1.55 and 4.86 GHz data points lie close to the fit and are both in good agreement with previous measurements at these frequencies, indicating that the VLA data capture the great majority of the flux from the source at both frequencies.
The GMRT data points are in good agreement with the model fit, suggesting that the 20% correction we applied to the GMRT flux calibration is correct. Without this correction, the GMRT 240 MHz flux density would fall 2.8 below the model prediction. Including systematic uncertainties on the flux scale and the elevation-dependent error on GMRT flux calibration would bring the measurement to within 1 of the model. However, we note that all the bright sources in the GMRT fields for which multi-wavelength data are available show systematically low flux densities; while the difference may not be strongly significant at a single frequency for 3C 270, the agreement across multiple sources and both bands suggests that the problem is real and significant.
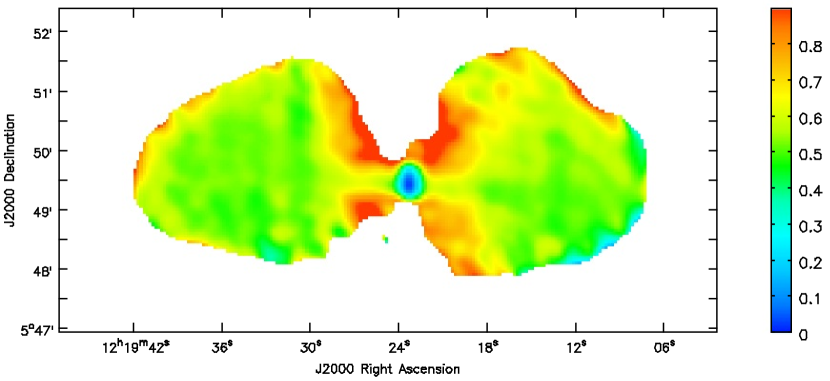
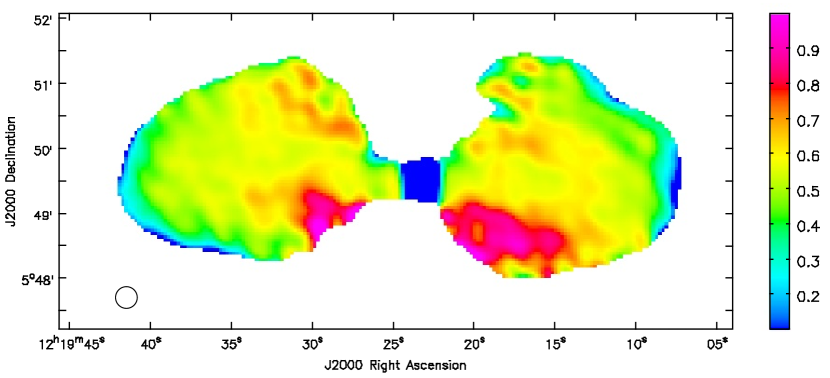
To provide a more nuanced picture of the spectral index structure within 3C 270, we created spectral index maps of the source in two frequency ranges, 240 MHz-1.55 GHz and 1.55-4.86 GHz. Each set of images was produced in IMAGR using the same uv range, Gaussian taper and cellsize. We used a 20 circular restoring beam (chosen based on the lowest resolution 1.55 GHz image), corrected for the primary beam, and aligned the images. Regions where the flux density in either band was 5 significant were removed. The resulting spectral index maps are shown in Figures 5 and 6. Typical uncertainties on the spectral index in the lobes (excluding systematic uncertainties on the flux density scale) are 0.06 for the 1.55-4.8 GHz map and 0.05 for 240 MHz-1.55 GHz. Uncertainties in the spectral indices of the jets and core can be found in Table 4.
In Figure 5, the unresolved core of the radio source can be seen. It has a spectral index , probably as a result of self-absorption (as indicated by the lack of an obvious core in the 240 MHz image, Fig. 1) since the spectral index is rather frequency-dependent (high curvature). Moving outwards the spectral index becomes steeper and a constant value of can be seen in the jets, while the lobes that dominate the total index in the lower-frequency band appear with constant but slightly steeper values (). In Figure 6 the core is obvious with a flat spectral index . The steepening of the spectral index within the lobes is much clearer in this image as a spectral index of can be seen above and below the beginning of the jets. In the jets, the spectral index at the point where they are surrounded by the lobes is and remains constant throughout. The spectrum in the lobes gradually steepens towards the nucleus, reaching values of 10.06. In both Figures 5 and 6, the features in the spectral-index maps at the edges of the source, and particularly at the ends of the lobes, are likely to be spurious and induced by residual reconstruction errors in regions of steep intensity gradient.
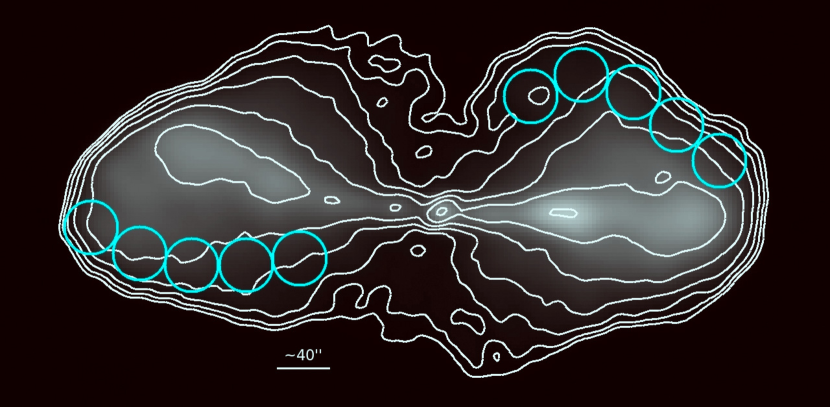


We performed a fit of the observed spectral index trend through the lobes using the techniques of Murgia (2003). As Figures 5 and 6 show, changes much more through the lobes than , indicating that the break frequency is 1.55 GHz over most of the area. The Synage++ package only considers spectral indices between two frequencies, and we therefore use it to model the trend in , while confirming that the 240 MHz data at each position do not conflict with the higher frequency data. The spectral index trend was determined by averaging the flux densities of each frequency in 40 diameter circular regions starting in the region likely to contain the youngest plasma, at the end of the jets, and then moving back along the paths shown in Figure 7 to the oldest plasma toward the nucleus. The circular regions were chosen to be larger than the beam size so that the measurements of the spectral index are independent. Figures 8 and 9 show the resulting spectral index measurements in the west and east lobes respectively.
The trends in the west and east lobe were fitted using a JP model. Assuming a simple constant source expansion velocity (), and knowing that the break frequency of the emission from a passively ageing relativistic plasma 1/age2, we expect to find , where is the distance from the end of the jet. The best fit for the observed spectral trend in west and east lobe of the source can be seen as a solid line in Figures 8 and 9, respectively. We note that the model provides a reasonable description of the spectral index trend in both lobes, suggesting that our assumption of constant expansion velocity is not unreasonable. The model provided similar values of and for both lobe regions. In the west lobe the calculated injection spectral index from the model was with a break frequency of GHz while in the east lobe we used a fixed injection spectral index of and got a GHz (see also Table 6). The break frequencies measured change little if the injection indices in the two lobe heads are assumed to be the same, either 0.5 or 0.56, and we note that both values are similar to the value of 0.53 found from the integrated spectrum. The similarity between the two lobes indicates that they have similar plasma properties, and we therefore consider it reasonable to fix in the east lobe.
| Flux Density | Reference | |
| (MHz) | (Jy) | |
| 22.3 | 176 12 | 1 |
| 26.3 | 162 21 | 2 |
| 38 | 144 7.2 | 3 |
| 86 | 81.5 1.1 | 4 |
| 178 | 56.5 2.8 | 3 |
| 750 | 27.15 0.23 | 5 |
| 1400 | 18.62 0.93 | 3 |
| 2695 | 12.79 0.64 | 3 |
| 5000 | 8.26 0.15 | 6 |
| 10700 | 4.69 0.28 | 7 |
| 23000 | 2.6 0.1 | 8 |
| 33000 | 2.1 0.2 | 8 |
| Region | ||||
|---|---|---|---|---|
| (GHz) | ( yrs) | |||
| West lobe | 29 | |||
| East lobe | 37 |
5.2 Physical parameters of 3C 270
To calculate the key physical parameters of 3C 270, we have to make certain assumptions. Firstly, the relativistic particle and magnetic field energy densities were assumed to be uniformly distributed over the volume occupied by the radio source and in approximate energy equipartition. A low energy cut-off (where is the electron Lorentz factor) was introduced in the energy distribution of the radiating electrons rather than the fixed 10 MHz 100 GHz frequency interval used in the classic equipartition equations (Pacholczyk, 1970). We assumed that the magnetic field is unordered along the line of sight and used in the electron energy distribution, which corresponds to MeV.
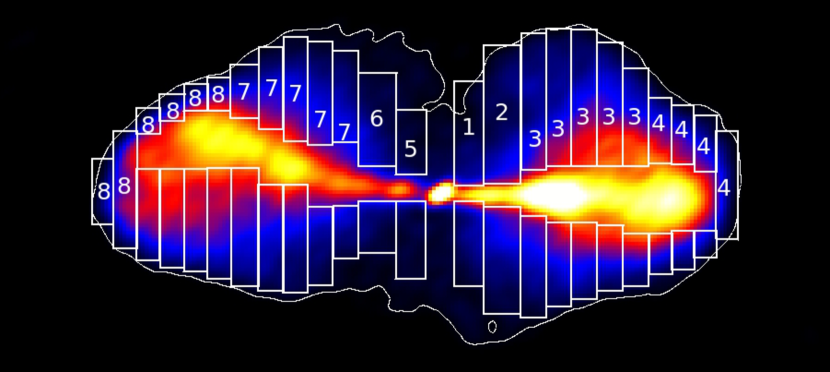
We used the injection spectral index derived from the west lobe =0.5, since this is in broad agreement with the value for the east lobe and the source as a whole. The flux density at 240 MHz (Table 7) was used to calculate the radio luminosity of the source, since among the frequencies used in this work it is least affected by electron spectral ageing. As the lobes are not well described by simple ellipsoids, we divided them into a number of rectangular regions chosen to approximate the breadth of the lobe at a range of distances along the jet axis. These are shown in Figure 10. Excluding the jets from the equipartition calculations for the lobes, we assume rotational symmetry about the jet axis to estimate the volume in each cylindrical region. We then group the regions, numbering these groups 1-8, to match the radial binning of the IGM pressure profile derived from X-ray observations. We also assume that the axis of the radio galaxy is in the plane of the sky. If the jet axis is oriented at 76∘ to the plane of the sky (as suggested by the most recent modelling, Laing & Bridle, 2014), our estimated volume will increase by 10%, altering our estimate of equipartition magnetic field by 10%.
The volumes, flux densities, spectral indices and equipartition magnetic field in regions 1-8 are listed in Table 7. We also estimated the pressure of the relativistic plasma in each region, which is defined to be
| (1) |
where is the energy of the electron population, is the volume, is the permeability of free space (4 in cgs units or 4 in SI), is the filling factor of the plasma (assumed to be 1) and is the energy ratio of the non-radiating particles to the radiating relativistic electrons. We assume =1, indicating equal energy in radiating and non-radiating particles. The factor describes the ordering of the magnetic field and we adopt , indicating a tangled magnetic field, as in O’Sullivan et al. (2011).
We find 5 G for both eastern and western lobes, though the outer parts of the lobes (regions 4 and 8) have higher , close to the estimate for the source as a whole 6.4 G. For this field (see later), electrons at =100 radiate at 5 MHz.
| Region | rmin | rmax | Vtot | ||||||
|---|---|---|---|---|---|---|---|---|---|
| (arcsec) | (arcsec) | (kpc3) | (mJy) | (mJy) | (1022 W/Hz) | (G) | (dyn cm-2) | ||
| West Lobe | |||||||||
| 1 | 10 | 33 | 1724 | 0.62 | 3.6 | 5.0 | 1.42 | ||
| 2 | 33 | 63 | 3861 | 0.62 | 7.3 | 4.9 | 1.36 | ||
| 3 | 63 | 168 | 12081 | 0.55 | 35 | 5.5 | 1.73 | ||
| 4 | 168 | 242 | 2551 | 0.50 | 10 | 6.0 | 2.06 | ||
| East Lobe | |||||||||
| 5 | 10 | 33 | 1056 | 0.55 | 1.6 | 4.6 | 1.21 | ||
| 6 | 33 | 63 | 1646 | 0.66 | 3.2 | 4.9 | 1.39 | ||
| 7 | 63 | 168 | 9753 | 0.50 | 26 | 5.3 | 1.64 | ||
| 8 | 168 | 282 | 4668 | 0.52 | 25 | 6.5 | 2.43 |
5.3 Radiative age
When considering the development of the radio jets and lobes, we adopt a simple conceptual model, in which at any given time plasma is rapidly transported out from the central engine to the tip of the jet. At this point the jet flow is halted by contact with the IGM, and the plasma driven out of the jet moves out radially to form the lobe. In this model, the age of the lobe plasma is linked to the distance along the jet; the back of the lobes (close to the nucleus) formed when the jet only extended a few kiloparsecs, while the tips of the lobes have only formed recently. In principle, backflows could develop, transporting younger plasma away from the jet tips into regions of the lobe formed at earlier times. However, in the absence of such a flow, or external forces causing reacceleration, plasma in the lobes is expected to age passively, with the high-frequency break in its spectral index falling to lower frequencies over time.
The radiative age of the radio source of NGC 4261 can be calculated if the break frequency of the source is known (e.g., Myers & Spangler, 1984). The magnetic field is considered to be uniform and constant over the whole of the source lifetime when radiative losses dominate over expansion losses. Neglecting reacceleration processes, the radiative age (the time since the last period of injection of relativistic electrons began) can be obtained as
| (2) |
where is expressed in GHz, and and in G (Parma et al., 2007). is the equipartition magnetic field and is the equivalent magnetic field strength of the cosmic microwave background (CMB) radiation at zero redshift, and equation 2 thus includes both inverse Compton and synchrotron losses.
Using equation 2 and the mean magnetic field for the source, 5 G, we estimated a radiative age of 29 Myr for the western lobe and 37 Myr for the eastern one. We also derived an estimate of the advance speed of the lobe tip, /c, where c is the speed of light. This velocity was calculated as = LD/, assuming a simple constant velocity and using the linear distance (LD) from the back of the lobe to the tip of the jet as measured from the radio images in Section 4. We found that for both lobes 0.004c (1300 km s-1 for the western lobe and 1200 km s-1 for the eastern one).
By comparison, the sound speed in the IGM in the environment around NGC 4261, estimated from the measured X-ray temperature, increases from about 380 km s-1 near the core to 590 km s-1 beyond 100′′. The advance speed of the lobe tip therefore appears to be supersonic relative to the IGM. Conversely, the Alfvén speed in the lobe is about 105 km s-1 (using the lobe plasma properties deduced in Section 6.2). That is, speed of expansion of the lobe is strongly sub-Alfvénic, and so will not excite magnetic shocks in the lobes. The internal characteristic speed of the waves in the magnetized relativistic plasma were calculated from
| (3) |
where is the Alfvén speed expressed in m s-1, is the energy density of the relativistic particle population, and is the magnetic field pressure.
6 Discussion
6.1 The age of the source
Before considering the implications of our radiative age measurements, we first discuss potential sources of error in our approach. We have performed a relatively simple modelling of the 1.55-4.86 GHz spectral index trend in the lobes, and our model rests on a number of assumptions. These include constant source expansion velocity, constant magnetic field, our choice of spectral model, and that reacceleration, adiabatic expansion and mixing are not important processes in the lobes. As mentioned in Section 5.1, the fact that our model provides a reasonable description of the spectral index trend suggests that the assumption of a constant expansion velocity is at least reasonable; we see no evidence that velocity changes are required, though of course other factors could disguise deviations from the trend. As a further test, we refitted the spectral index profiles, adding one additional region closer to the AGN. In both lobes, the fits were poorer, primarily because of the differences in the extent of the emission seen in the lobes close to the nucleus (back of the lobes) at 1.55 and 4.8 GHz, which lead to divergence from the smooth trend in spectral index. For example, in the west lobe, the added region is close to the edge of the lobe at 4.8 GHz, leading to a steeper than expected spectral index and a reduced =8.7. Both fits find lower break frequencies 4-5 GHz, suggesting radiative ages 45 Myr, older than our best estimate, but not by a large factor.
Our use of the JP model may be over-simple, but we are limited in this by the available data. Harwood et al. (2013) compare the utility of several spectral models to describe spectral ageing in FR-II galaxies and conclude that the Tribble (1993) model provides the best combination of fit quality and physical realism; Harwood et al. consider the JP model at least as physically accurate, but it provides a poorer fit. However, they find that to differentiate between models requires data at 7-9 frequencies, whereas we have only 3 available. Further observations are therefore needed to determine whether a different model might provide a better description (and age estimate) for 3C 270.
Losses caused by adiabatic expansion would affect our age estimate, lowering the break frequency and therefore the estimated age. However, adiabatic losses decrease the luminosity of the plasma, and are more effective in doing so than they are in reducing . We might expect losses in the jets as they flare from the narrowly collimated structures seen in the X-ray to the broad jets we observe in the radio, but the fact that the lobes have high surface brightnesses and smooth surface brightness distributions suggests that adiabatic losses within the lobes are probably not important. Variation in the magnetic field within the lobes could affect our results, but on large scales we only measure a relatively small (20%) change in field strength across the lobes (see Table 7), perhaps as little as 8% in the radius range used to estimate age. This is insufficient to balance the observed spectral index trend, and we therefore consider our assumption of a constant field to be a reasonable approximation. Small-scale field variations cannot be ruled out, but would again require improved spectral modelling and additional observations.
Moving on to the results, our spectral-index profile modelling (Figures 8 and 9), implies ages of and 37 Myr for the west and east lobes respectively (Table 6). These ages are less than the 75 Myr upper limit estimated by O’Sullivan et al. (2011) from the IGM sound speed. While the upper limit and our values are consistent, the factor two difference between the values seems to be significant. Eilek (1996) first noted that the synchrotron ages for FRI and FRII radio sources derived from the spectra differed from the dynamical ages as much as a factor of 10. By this standard the factor of 2 discrepancy we observe is relatively mild. Several studies suggest plausible explanations for the age difference between spectral and dynamical ages (Blundell & Rawlings, 2000), including in situ acceleration of particles (e.g., Eilek, 1996; Carilli et al., 1991) and magnetic fields that vary with position in the lobes (e.g., Katz-Stone et al., 1993; Eilek & Arendt, 1996). Studies have shown much better agreement between dynamical and spectral ages in young sources (10 Myr, Matthews & Scheuer 1990; Kaiser et al. 1997), but the cause of the discrepancy in older sources is still unknown. We will discuss three possible explanations for the age discrepancy in 3C 270: i) a period of highly supersonic expansion early in the AGN outburst; ii) multiple outbursts or large changes in jet power; iii) a backflow capable of mixing younger electrons from the jets into the old plasma at the back of the lobes.
In scenario (i), the expansion of the lobes was much faster in the past, so that the assumption of a constant near-sonic expansion velocity by O’Sullivan et al. (2011) leads to an overestimate of the age of the source. For the larger eastern lobe, the radiative age (37 Myr) implies that the lobes should be driving into the IGM at Mach2, if they have expanded at constant velocity. Shocks in the IGM, driven by this expansion, would be detectable in the available X-ray observations as increases in temperature and surface brightness, and are ruled out by the measurements described in O’Sullivan et al. (2011). However, there is also the possibility of that a period of supersonic expansion occurred early in the life of the source, followed by a period of slower expansion which we are now observing. In this case, the shocks would have detached from the lobe tips as the expansion speed dropped, and moved outwards, potentially passing out of the field of view of the XMM-Newton observation. Assuming that the shock front is just outside the XMM field of view (14′ or 130 kpc) we can calculate the duration of the supersonic phase. The minimum Mach number of such a shock would be 6 (3500 km s-1). The corresponding maximum period of supersonic expansion would be 7.5 Myr, during which time the lobes would expand to 28.5 kpc along the jet axis. After this, expansion would continue at the sound speed for the remaining 3/4 of the lifetime of the radio source.
A Mach6 shock in the IGM would cause an increase in X-ray surface brightness of a factor 13.5 and a temperature increase of a factor 12. Even if the efficiency of energy deposition is low, such a shock would have strongly heated the IGM, and the observed temperature would be the result of this heating. For a 10% heating efficiency, we would expect the shock to have deposited 1058 erg in the central 10 kpc alone, and the current rate of radiative energy loss, 1041 erg s-1 would only have removed 1% of this energy. This implies a pre-shock core temperature as low as 0.1 keV, lower than is observed in any group or cluster, and more comparable with the temperature of the interstellar gas in our own Galaxy than that expected in a giant elliptical. Since NGC 4261 appears to be fairly typical of the population of group and cluster-central FR-I radio galaxies, we might also expect to see a population of such sources driving shocks of similar strength, with evidence of strong shock heating. No such population has been identified. The scenario of a single, highly supersonic outburst therefore seems unlikely.
In scenario (ii) the AGN would have undergone more than one outburst, or the jet power may have varied significantly over time. In this case our estimated age could correspond only to the newest outburst or period of high jet power. A restarted jet, or period of more powerful outflow, could drive shocks into the lobes, causing in situ reacceleration in the old plasma while producing new expansion at the lobe tips. Worrall et al. (2010) note structure that could be caused by variations on 104 yr timescales in the X-ray jet, while the changes in radio brightness along the western jet suggest variation on longer timescales. This scenario is plausible, and difficult to rule out with current data.
In scenario (iii) a backflow would transport young, energetic electrons back towards the nucleus, reducing the mean age of the plasma. Numerical simulations (e.g., Perucho & Marti, 2007) support the possibility of mildly relativistic backflows in a sheath surrounding light FRI jets. Modelling of the base of the jets in 3C 270 does not reveal any evidence of such a backflow (Laing & Bridle, 2014), but it cannot be ruled out on larger scales. However, if backflows are limited to a sheath around the jets (Laing & Bridle, 2012), the question of how electrons are mixed outward into the larger lobe remains. A bulk backflow, with transport of and mixing of plasma throughout the lobe would be required, but seems less plausible given the lobe morphology.
Considering the merits of these three possibilities, we favour scenario (ii), and suggest a model for the expansion history of the source in which, 75 Myr ago, an outburst swept its way through the X-ray gas, beginning the excavation of the cavities. These cavities grew in stages as the jet power varied over time, with the lobe plasma being refreshed by each new outburst or period of high jet power, the most recent of which is only 30 Myr old. The overall lobe/cavity inflation time would thus be similar to the X-ray estimate, but the plasma we see in the lobes is a mixture of old and new particles injected by a period of stronger jet activity over the last 30-40 Myr.
6.2 Pressure balance and particle content
The non-thermal energy density in the lobes of an extended radio source cannot be determined by the radio data alone. Only a minimum value can be estimated when we assume the contribution from the magnetic field and the relativistic particles equal (Burbidge, 1958). The additional information needed to constrain the internal energy density can be obtained either from measurement of the inverse-Compton emission caused by the up-scattering of photons off the relativistic electrons in the lobes, or by assuming pressure equilibrium between the lobes and their environment and measuring the IGM pressure using X-ray data (Longair et al., 1973).
We first test our ability to detect inverse-Compton emission from the lobes. Assuming equipartition, O’Sullivan et al. (2011) estimated an expected X-ray flux density from up-scattered cosmic microwave background (CMB) photons to be 2 nJy from each lobe at 1 keV. Using our improved constraints on the properties of the lobe plasma, we repeat this calculation, and find that we expect a flux of 6.510-14 erg s-1 in the 0.5-7 keV band (4.1 nJy at 1 keV) from each lobe. We then reprocessed the longest XMM-Newton dataset available (ObsID 0502120101, 70 ks after cleaning) using the latest calibration and most recent version of the XMM Science Analysis System (sas 13.5). Following the techniques described in O’Sullivan et al., we find no detection of inverse-Compton flux from the lobes, but are able to place 3 upper limits on the 0.5-7 keV flux of 610-14 erg cm-2 s-1 (3.8 nJy) for the west lobe, and 6.210-14 erg cm-2 s-1 (4.0 nJy) for the east lobe. These limits are marginally below the predicted flux, and so may suggest that the lobe plasma is out of equipartition, with more energy in the magnetic field than in the particle population. However, the uncertainties in the radio fluxes, XMM calibration (see, e.g. Nevalainen et al., 2010, Tsujimoto et al. 2011) and the choice of X-ray spectral model only weakly constrain departures from equipartition in the sense of domination by the electron (and positron) energy density. Deeper X-ray data are needed to provide a lower flux limit and determine whether the lobes are truly in equipartition.
We also estimated the likely optical flux in the inner part of the lobes from up-scattering of infra-red photons emitted by the stellar population. Unfortunately, the expected signal is low, a factor 10-3 below the optical luminosity of the stellar population in the same region. We are therefore unable to constrain the properties of the lobe emission from its inverse-Compton emission, at least with the currently available data.
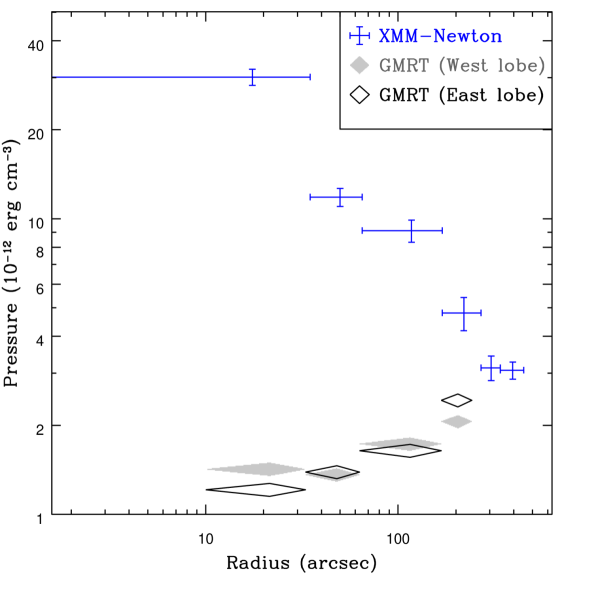
As inverse-Compton emission does not provide a definitive constraint, we compare the apparent lobe pressure with that of the surrounding IGM. Figure 11 shows the pressure profiles of the thermal gas () along with the profile of the radio pressure derived in this study, as a function of the distance from the source’s centre. The X-ray pressure profile is drawn from the XMM-Newton analysis of O’Sullivan et al. (2011). As can be seen from Fig. 11 the X-ray pressure profile declines with radius as expected, while the pressure profile derived from the radio lobes rises with radius. The radio lobes appear to be underpressured with respect to the surrounding environment in all regions and in both lobes by a factor ranging from 2 to 30. We note that the O’Sullivan et al. (2011) IGM pressure profile is in excellent agreement with the earlier measurements of Croston et al. (2008), but that Croston et al. found a mean internal pressure for the radio lobes of 910-13 erg cm-3, slightly lower than the pressures we measure in the lobes.
A similar pressure imbalance has been found in previous lobe studies of other FR I radio sources, where / is usually 1, reaching values up to 100, assuming the standard equipartition arguments (e.g. Feretti et al., 1992; Dunn et al., 2005; Croston et al., 2008; Bîrzan et al., 2008; Dunn et al., 2010). This can only suggest two possible situations for the radio lobes in the case of 3C 270: 1) Deviation from equipartition within the radio lobes with a higher magnetic field energy density than calculated, or 2) the equipartition argument is still valid but either the radio lobes contain a significant amount of non-radiating particles that contribute to the internal pressure or the filling factor of the plasma is less than unity. Since we believe that jets entrain material in FR I galaxies and in this specific galaxy we have reason to think the filling factor might be at the back of the lobes (volume overestimation including part of the brighter X-ray emitting gas near the cool core), we examine the implications of the lack of pressure balance in the case where equipartition stands.
Assuming that the radio lobes of 3C 270 are in approximate pressure equilibrium with the IGM, we have the ability to constrain the particle content of the lobes from the comparison of the apparent pressures of the relativistic plasma of the radio lobes and that of the thermal plasma of the IGM (e.g., Hardcastle & Worrall, 2000; Bîrzan et al., 2008).
In Table 8, the results shown for estimation were calculated by forcing to equal (note that in Table 6 we adopted a fixed ). The regions of the radio pressure in this study were chosen so as to match the X-ray annuli used by O’Sullivan et al. (2011). Both lobes show the same trend with the factor rising as we move from the end of the jets (regions 4 and 8) to the back of the lobes near the core (regions 1 and 5). The size of the bins were not exactly equal so the increase of is not linear.
Assuming that the filling factor , the additional pressure required by the rise of in regions 2-4 and 6-8 can be provided by non-radiative particles in the relativistic plasma of the lobes. This non-radiating component could be introduced via the entrainment and heating of thermal plasma by the radio jets. A probable source of entrained material is stellar mass loss from stars within the jets (Phinney, 1983; Komissarov, 1994; Hardcastle et al., 2003, 2007). In O’Sullivan et al. (2011) the rate of stellar mass-loss from AGB stars into each jet was estimated to be 1.67 M⊙ yr-1. By assuming a 37 Myr timescale for the AGN outburst, we expect a minimum of 60000 of stellar material to be entrained by each jet.
| Region | Ee | Vtot | Total energy | ||
|---|---|---|---|---|---|
| ( 1056 erg) | (dyn cm-2) | ( 1067 cm3) | ( 1056 erg ) | ||
| West Lobe | |||||
| 1 | 1.1 | 30.2 | 5.1 | 42.5 | 14.6 |
| 2 | 2.3 | 11.8 | 11.3 | 17.4 | 11.9 |
| 3 | 9.2 | 9.1 | 35.5 | 10.5 | 26.2 |
| 4 | 2.3 | 4.8 | 7.5 | 4.7 | 2.1 |
| East Lobe | |||||
| 5 | 0.6 | 30.2 | 3.1 | 49.8 | 9 |
| 6 | 1 | 11.8 | 4.8 | 17 | 5.1 |
| 7 | 7.1 | 9.1 | 28.7 | 11.1 | 21.4 |
| 8 | 5 | 4.8 | 13.7 | 3.9 | 3.3 |
Thermal plasma entrained from stars within the radio jets represents a plausible minimum mass of entrained material. Taking the limiting assumption that in regions 4 and 8 the only entrained material is that from stars in the jets (i.e., that no additional entrainment occurs across the lobe/IGM boundary), we can estimate an upper limit on the temperature to which this thermal component must be heated in order to bring the lobes into thermal balance with their surroundings. We find the temperature of the entrained material to be kBT11 MeV which corresponds to a plasma with electrons having a Lorentz factor 20, well into the relativistic regime. Electrons of 20 are expected to radiate in the equipartition magnetic field at 1 kHz, making them invisible in the observable radio band. Comparable values have been found by applying similar arguments to Cen A (Wykes et al., 2013) and 3C 31 (Croston & Hardcastle, 2014). The very low density of this entrained thermal plasma component ( cm-3) means that no significant thermal or non-thermal X-ray emission is expected from it. By summing up from each region, where V is the volume of each region, we estimate that the total energy (Table 8) required to heat all the entrained material in the lobe to 11 MeV is erg.
Alternatively, pressure balance could be produced if the filling factor . This could occur in several ways, for example if we have overestimated the lobe volume or if significant variations in the density of relativistic particles and magnetic field exist within the lobes.
The most likely location in which may be 1 is in regions 1 and 5, which have values of much greater than those of the neighbouring regions. Since regions 1 and 5 of the lobes overlap with the brighter X-ray emission north and south of the cool core, it is possible either that our assumption that the morphology of the lobe can be described as an annulus in this region is oversimplistic, or that the lobe and IGM plasmas are mixed, with filaments or clouds of IGM gas penetrating the volume apparently occupied by the lobe. If we estimate the value of k based on the increase in k from regions 1-3 and 5-7, we find that we would expect 24 for region 1 and 23 for region 5. This suggests that could be as low as 0.59 for region 1 and 0.48 for region 5.
If thermal plasma is present in the lobes, we would expect it to cause Faraday rotation. We can therefore compare our expected density of entrained material with limits derived from the rotation measures for 3C 270 found by Guidetti et al. (2011) and Laing & Bridle (2014). While these measurements include the effects of external Faraday rotation, they do provide an upper bound on the internal rotation measure. Following Feretti et al. (1999) we calculate the expected rotation measure from:
| (4) |
where RM is the rotation measure in rad m-2, ne is the electron number density in cm-3, Bz is the magnetic field along the line-of-sight in G and L is the integration path (the depth of the lobe along the line-of-sight) in kpc. Based on the Guidetti et al. and Laing & Bridle results, an RM of order 10 rad m-2 seems representative for the system. We find that an electron gas density of 8.210-5 cm-3 would be required to produce RM=10 rad m-2 purely from internal depolarization. The expected electron density of thermal plasma entrained in the lobes (1.410-7 cm-3) is low compared to this limit, and would be expected to produce RM0.02 rad m-2, well below the sensitivity of the Guidetti et al. (2011) maps. We therefore agree with the conclusion drawn by Guidetti et al., that the RM structures they observe are probably caused by foreground depolarization.
We can also test whether regions 1 and 5, which we earlier suggested have filling factors less than unity, could contain a mix of thermal and relativistic plasmas, or whether it is more like that our adopted geometry leads us to overestimate their volume. Using equation 4 and the IGM electron density derived from the X-rays in O’Sullivan et al. (2011) we find that we expect an internal RM of rad m-2 for both regions. While Guidetti et al. (2011) do find evidence of enhanced depolarization at the inner edges of the lobes, our predicted value is a factor 20 higher than they observe. This indicates that the relativistic and thermal plasmas along these lines of sight are probably not well mixed. This could suggest that the geometry we have assumed for the lobes close to the core is too simple, for example if filaments or sheets of thermal plasma penetrate the lobe while remaining magnetically separate. Alternatively, the internal properties of the lobe plasma may differ in these regions from those seen through the rest of the lobes.
In O’Sullivan et al. (2011) the total enthalpy, 4PV - the energy required to expand the lobe to its current size against the pressure of the IGM, plus the energy stored in the magnetic field and particles in the lobe - was estimated to be erg. Our energy estimate of erg required to heat any entrained material is about 40% of the enthalpy estimated in O’Sullivan et al. (2011). This is a factor of 1.8 greater than estimated by O’Sullivan et al., mainly owing to our more accurate treatment of lobe volume. The estimate changes little if the lower filling factors in regions 1 and 5 are adopted.
In summary, we have examined the constraints which can be placed on the particle populations in the radio lobes from the available radio and X-ray measurements. We find that only a relatively small mass of entrained gas is needed to bring the lobes into pressure equilibrium with their surroundings, that this is probably consistent with entrainment of stellar material lost from stars within the jets, and that such material would have a low density and therefore would not have detectable effects on the polarization.
7 Conclusions
In this paper, we have presented a detailed spectral analysis of the FR I radio source 3C 270, emanating from the nearby group-central elliptical galaxy NGC 4261. We have analysed 240 MHz and 610 MHz data from the GMRT, and data from the VLA at 1.55 GHz and 4.86 GHz.
Combining the analysed GMRT and VLA data with data flux density measurements from the literature between 22 MHz and 33 GHz, we used a Jaffe & Perola (JP) model to determine the asymptotic low-frequency spectral index of 3C 270 to be . From the GMRT 240 MHz and VLA 1.55 GHz and 4.8 GHz, we produced spectral index maps of the source which suggest a spectral index of 0.16 for the unresolved and probably self-absorbed core, a constant spectral index along the jets of 0.5 and a gradual steepening from the tip of the jets through to the back of the lobes of 0.81.
Assuming equipartition of energy between the magnetic field and the relativistic particles, and adopting a minimum Lorentz factor of =100 for the radiating electrons, we estimate the radiative age of 3C 270. We modelled the observed 1.55-4.86 GHz spectral index trend in the lobes, fitting a Jaffe & Perola (JP) model. We find a radiative age of and 37 Myr for the west and east lobes respectively. This is about half the dynamical age of 75 Myr found previously using X-ray data (O’Sullivan et al., 2011). We considered three possible scenarios for this discrepancy. The least likely is that the source underwent an early period of supersonic expansion. While the shocks from such an expansion might now be outside the field of view of the available X-ray observations, they would have very significantly heated the IGM, implying unphysically low pre-shock temperatures.
A second alternative is that a backflow within the lobes may be transporting young, energetic electrons from the jet into regions of older plasma, leading us to underestimate the age. This cannot be ruled out, but previous high resolution observations of the base of the jets do at least argue that no backflow is observed on small scales. Finally, the third possibility, which we favour, is the observed source is the product of multiple AGN outburst or large change in jet power, with the radiative age corresponding to the latest outburst or period of high jet power. Worrall et al. (2010) noted structures in the X-ray jet that could be indicate variations in power on 104 yr timescales, and larger scale variations in jet brightness are observed in the radio. A renewed outburst would not only inject a fresh population of young electrons into the lobes, but would likely drive shocks into the only population, causing reacceleration. The end result would be a source whose lobe expansion time might be similar to the X-ray age estimate while the radiative age represents the onset of more recent activity.
Assuming that the pressures in the radio lobes equal that of the IGM we calculate that the ratio of energies of non-radiating to radiating particles, k, ranges from from the tip of the jets to the lobes close to the core (Table 8, Fig. 10). This suggests that gas entrainment was more effective at earlier times, when the jets were shorter. Assuming, as a limiting case, that currently only material lost from stars in the jets is entrained, we estimate that the temperature of the entrained material would need to be 11 MeV if it is to bring the lobes into pressure balance with the IGM. This corresponds to a total energy of erg required to heat the entrained material in the lobe, 40% of the total enthalpy of the lobes estimated in O’Sullivan et al. (2011).
Based on our estimates of the density of the entrained material, we predict the likely internal rotation measure arising from this component, and compare it to RM measurements from the literature. The density of cm-3 indicates that the contribution of the entrained material to the Faraday depolarization is undetectable. In regions 1 and 5 where the thermal X-ray emitting plasma co-exists with the relativistic plasma, we would expect a RM of rad m-2 for both regions if mixing had taken place. This is ruled out by the observations, implying that little mixing between the thermal and relativistic plasmas has occurred.
Acknowledgments
K. Kolokythas is supported by the University of Birmingham. E. O’Sullivan acknowledges support for this work from the National Aeronautics and Space Administration through Chandra Award Number AR3-14014X issued by the Chandra X-ray Observatory Center, which is operated by the Smithsonian Astrophysical Observatory for and on behalf of NASA under contract NAS8-03060, and through the Astrophysical Data Analysis programme, award NNX13AE71G. S. Giacintucci acknowledges the support of NASA through Einstein Postdoctoral Fellowship PF0-110071 awarded by the Chandra X-ray Center (CXC), which is operated by the Smithsonian Astrophysical Observatory (SAO). GMRT is run by the National Centre for Radio Astrophysics of the Tata Institute of Fundamental Research. Some of this research was supported by the EU/FP7 Marie Curie award of the IRSES grant CAFEGROUPS (247653). We thank T. Ponman and Andreas Zezas for useful discussions of NGC 4261 and formation history. We thank the anonymous referee for his help in improving the paper.
References
- Artyukh et al. (1969) Artyukh V. S., Dagkesamanskii V. V., Vitkevich R. D., Kozhukhov V. N., 1969, SvA, 12, 567
- Baars et al. (1977) Baars J. W. M., Genzel R., Pauliny-Toth I. I. K, Witzel A., 1977, A&A, 61, 99
- Bennett C. L. et al. (2003) Bennett C. L., Hill R. S., Hinshaw G., Nolta M. R., Odegard N., Page L., Spergel D. N., Weiland J. L., Wright E. L., Halpern M., Jarosik N., Kogut A., Limon M., Meyer S. S., Tucker G. S. and Wollack E., 2003, ApJS, 148, 97
- Blundell & Rawlings (2000) Blundell K. M. and Rawlings S., 2000, AJ, 119, 1111
- Bonfini et al. (2012) Bonfini P., Zezas A., Birkinshaw M., Worrall D. M., Fabbiano G., O’Sullivan E., Trinchieri G., Wolter A., 2012, MNRAS, 421, 2872
- Birkinshaw & Davies (1985) Birkinshaw M., Davies R. L., 1985, ApJ, 291, 32
- Bîrzan et al. (2008) Bîrzan L., McNamara B. R., Nulsen P. E. J., Carilli C. L. and Wise M. W., 2008, ApJ, 686, 859
- Burbidge (1958) Burbidge, 1958, ApJ, 127, 48
- Cappellari et al. (2011) Cappellari M., Emsellem E., Krajnović D., McDermid R. M., Scott N., Verdoes Kleijn G. A. et al., 2011, MNRAS, 413, 813
- Carilli et al. (1991) Carilli C., Perley R., Dreher J., Leahy J., 1991, ApJ, 383, 554
- Chandra, Ray & Bhatnagar (2004) Chandra P., Ray A., Bhatnagar, 2004, ApJ, 612, 974
- Chiaberge et al. (2003) Chiaberge M., Gilli R., Macchetto F. D., Sparks W. B. and Capetti A., 2003, ApJ, 582, 645
- Croston et al. (2008) Croston J. H., Hardcastle M. J., Birkinshaw M., Worrall D. M. and Laing R. A., 2008, MNRAS, 386, 1709
- Croston & Hardcastle (2014) Croston J. H. and Hardcastle M. J., 2014, MNRAS, 438, 3310
- D’Abrusco et al. (2013) D’Abrusco R., Fabbiano G., Strader J., Zezas A., Mineo S., Fragos T., Bonfini P., Luo B., Kim D. W. and King A., 2013, ApJ, 773, 87
- David et al. (2011) David L. P., O’Sullivan E., Jones C., Giacintucci S., Vrtilek J., Raychaudhury S., Nulsen P. E. J. Forman W., Sun M. and Donahue M., 2011, ApJ, 728, 162
- Davies & Birkinshaw (1986) Davies R. L., Birkinshaw M., 1986, ApJ, 303, L45
- Davis et al. (1995) Davis D. S., Mushotzky R. F., Mulchaey J. S., Worrall D. M., Birkinshaw M., Burstein D., 1995, ApJ, 444, 582
- Dunn et al. (2005) Dunn R. J. H., Fabian A. C. and Taylor G. B., 2005, MNRAS, 364, 1343
- Dunn et al. (2010) Dunn R. J. H., Allen S. W., Taylor G. B., Shurkin K. F., Gentile G., Fabian A. C. and Reynolds C. S., 2010, MNRAS, 404, 180
- Eilek (1996) Eilek J. A., 1996, ASPC, 100, 281
- Eilek & Arendt (1996) Eilek J., Arendt P., 1996, ApJ, 457, 150
- Fabian et al. (2006) Fabian A. C., Sanders J. S., Taylor G. B., Allen S. W., Crawford C. S., Johnstone R. M., Iwasawa K., 2006, MNRAS, 366, 417
- Fabian (2012) Fabian A. C., 2012, ARA&A, 50, 455
- Feretti et al. (1992) Feretti L., Perola G. C. and Fanti R., A&A, 265, 9
- Feretti et al. (1999) Feretti L., Dallacasa D., Govoni F., Giovannini G., Taylor G. B. and Klein U., A&A, 344, 472
- Ferrarese, Ford & Jaffe (1996) Ferrarese L., Ford H. C., Jaffe W., 1996, ApJ, 470, 444
- Forbes et al. (2006) Forbes D. A., Ponman T., Pearce F., Osmond J., Kilborn V., Brough S., Raychaudhury S., Mundell C., Miles T., Kern K., 2006, PASA, 23, 38
- Forman et al. (2007) Forman W., Jones C., Churazov E., Markevitch M., Nulsen P., Vikhlinin A., Begelman M., Böhringer H., Eilek J., Heinz S., Kraft R., Owen F. and Pahre M., 2007, ApJ, 665, 1057
- Garcia (1993) Garcia A. M., 1993, A&AS, 100, 47
- Giacintucci et al. (2008) Giacintucci S., Vrtilek J. M., Murgia M., Raychaudhury S., O’Sullivan E. J., Venturi T., David L. P., Mazzotta P., Clarke T. E. and Athreya R. M., 2008, ApJ, 682, 186
- Giacintucci et al. (2011) Giacintucci S., O’Sullivan E., Vrtilek J., David L. P., Raychaudhury S., Venturi T., Athreya R. M., Clarke T. E., Murgia M., Mazzotta P., Gitti M., Ponman T., Ishwara-Chandra C. H., Jones C. and Forman W. R., 2011, ApJ, 732, 95
- Giacintucci et al. (2012) Giacintucci S., O’Sullivan E., Clarke T. E., Murgia M., Vrtilek J. M., Venturi T., David L. P., Raychaudhury S. and Athreya R. M., 2012, ApJ, 755, 172
- Giordano et al. (2005) Giordano L., Cortese L., Trinchieri G., Wolter A., Colpi M., Gavazzi G. and Mayer L., 2005, ApJ, 634, 272
- Gliozzi, Sambruna & Brandt (2003) Gliozzi M., Sambruna R. M. and Brandt W. N., 2003, A&A, 408, 949
- Goodger et al. (2010) Goodger J. L., Hardcastle M. J., Croston J. H., Kraft R. P., Birkinshaw M., Evans D. A., Jordán A., Nulsen P. E. J., Sivakoff G. R., Worrall D. M., Brassington N. J., Forman W. R., Gilfanov M., Jones C., Murray S. S., Raychaudhury S., Sarazin C. L., Voss R. and Woodley K. A., 2010, ApJ, 708, 675
- Guidetti et al. (2011) Guidetti D., Laing R. A., Bridle A. H., Parma P. and Gregorini L., 2011, MNRAS, 413, 2525
- Hardcastle & Worrall (2000) Hardcastle M. J. and Worrall D. M., 2000, MNRAS, 319, 562
- Hardcastle et al. (2003) Hardcastle M. J., Worrall D. M., Kraft R. P., Forman W. R., Jones C. and Murray S. S., 2003, MNRAS, 593, 169
- Hardcastle et al. (2007) Hardcastle M. J., Kraft R. P., Sivakoff G. R., Goodger J. L., Croston J. H., Jordán A., Evans D. A., Worrall D. M., Birkinshaw M., Raychaudhury S., Brassington N. J., Forman W. R., Harris W. E., Jones C., Juett A. M., Murray S. S., Nulsen P. E. J., Sarazin C. L. and Woodley K. A., 2007, ApJ, 670, L81
- Harwood et al. (2013) Harwood, J. J., Hardcastle, M. J., Croston, J. H. and Goodger, J. J., 2013, MNRAS, 435, 3353
- Ho, Filippenko & Sargent (1997) Ho L. C., Filippenko A. V., Sargent W. L. W., 1997, ApJS, 112, 315
- Humphrey et al. (2009) Humphrey P. J., Buote D. A., Brighenti F., Gebhardt K., Mathews W. G., 2009, ApJ, 703, 1257
- Jaffe & Perola (1973) Jaffe W. J., Perola G. C., 1973, A&A, 26, 423
- Jaffe et al. (1993) Jaffe W., Ford H. C., Ferrarese L., van den Bosch F., O’ Connell R. W., 1993, Nat, 364, 213
- Jones & Wehrle (1997) Jones D. L. and Wehrle A. E., 1997, AAS, 191, 10403
- Kaiser et al. (1997) Kaiser C. R., Dennett-Thorpe J. and Alexander P., 1997, MNRAS, 292, 723
- Katz-Stone et al. (1993) Katz-Stone D., Rudnick L., Anderson M., 1993, ApJ, 407, 549
- Kellermann et al. (1969) Kellermann K.I., Pauliny-Toth I.I.K. and Williams P. J. S., 1969, ApJ, 157, 1
- Kellermann & Pauliny-Toth (1973) Kellermann K.I., Pauliny-Toth I.I.K., 1973, AJ, 78, 828
- Komissarov (1994) Komissarov S. S., 1994, MNRAS, 269, 394
- Kraft et al. (2007) Kraft R. P., Nulsen P. E. J., Birkinshaw M. Worrall D. M., Penna R. F., Forman W. R., Hardcastle M. J., Jones C. and Murray S. S., 2007, ApJ, 665, 1129
- Kraft et al. (2012) Kraft R. P., Birkinshaw M., Nulsen P. E. J., Worrall D. M., Croston J. H., Forman W. R., Hardcastle M. J., Jones C. and Murray S. S., 2012, ApJ, 749, 19
- Laing & Bridle (2012) Laing R. A. and Bridle A. H., 2012, MNRAS, 424, 1149
- Laing & Bridle (2013) Laing R. A. and Bridle A. H., 2013, MNRAS, 432, 1114
- Laing & Bridle (2014) Laing R. A. and Bridle A. H., 2014, MNRAS, 437, 3405
- Longair et al. (1973) Longair M. S., Ryle M., Scheuer P. A. G., 1973, MNRAS, 164, 243
- Matthews & Scheuer (1990) Matthews A. P. and Scheuer P. A. G., 1990, MNRAS, 242, 616
- McNamara & Nulsen (2007) McNamara B. R. and Nulsen P. E. J., 2007, ARA&A, 45, 117
- Mulchaey et al. (2003) Mulchaey J. S., Davis D. S., Mushotzky R. F. and Burstein D., 2003, ApJ, 145, 39
- Murgia et al. (1999) Murgia M., Fanti C., Fanti R., Gregorini L., Klein U., Mack K.-H. and Vigotti M., 1999, A&A, 345, 769
- Murgia (2000) Murgia, 2000, Ph.D. thesis, Univ. Bologna
- Murgia (2003) Murgia, 2003, PASA, 20, 19M
- Murgia et al. (2011) Murgia M., Parma P., Mack K.-H., de Ruiter H. R., Fanti R., Govoni F., Tarchi A., Giacintucci S. and Markevitch M., 2011, A&A, 526A, 148
- Myers & Spangler (1984) Myers S. T. and Spangler S. R., 1985, ApJ, 291, 52
- Nevalainen et al. (2010) Nevalainen J., David L. and Guainazzi M., 2010, A&A, 523, 22
- Nulsen et al. (2005) Nulsen P. E. J., McNamara B. R., Wise M. W., David L. P., 2005, ApJ, 628, 629
- Osmond & Ponman (2004) Osmond J. P. F. and Ponman T. J., 2004, MNRAS, 350, 1511
- O’Sullivan et al. (2011) O’Sullivan E., Giacintucci S., David L. P., Gitti M., Vrtilek J. M., Raychaudhury S., Ponman T. J., 2011, ApJ, 735, 11
- O’Sullivan et al. (2011) O’Sullivan E., Giacintucci S., David L. P., Vrtilek J. M. and Raychaudhury S., 2011, MNRAS, 411, 1833
- O’Sullivan et al. (2011) O’Sullivan E., Worrall D. M., Birkinshaw M., Trinchieri G., Wolter A., Zezas A., Giacintucci S., 2011, MNRAS, 416, 2916
- Pacholczyk (1970) Pacholczyk A. G., 1970, Series of Books in Astronomy and Astrophysics, Freeman & Co., San Francisco
- Parma et al. (2007) Parma P., Murgia M., de Ruiter H. R. et al., 2007, A&A, 470, 875
- Pauliny-Toth et al. (1966) Pauliny-Toth I. I. K., Wade C. M. and Heeschen D. S., 1966, ApJS, 13, 65
- Pauliny-Toth & Kellermann (1968) Pauliny-Toth I. I. K. and Kellermann K. I., 1968, AJ, 73, 953
- Perley & Butler (2013) Perley R. A. and Butler B. J., 2013, ApJS, 204, 19
- Perucho & Marti (2007) Perucho M. and Martí J. M., 2012, MNRAS, 382, 526
- Peterson & Fabian (2006) Peterson J. R. and Fabian A. C., 2006, PhR, 427, 1
- Phinney (1983) Phinney E. S., 1983, PhD, T, 97
- Piner et al. (2001) Piner B. G., Jones D. L., Wehrle A. E., 2001, AJ, 122, 2954
- Roger et al. (1969) Roger R. S., Costain C. H. and Lacey J. D., 1969, AJ, 74, 366
- Scaife & Heald (2012) Scaife A. M. M. and Heald G. H., 2012, MNRAS, 423, 30
- Tal et al. (2009) Tal T., van Dokkum P. G., Nelan J. and Bezanson R., 2009, AJ, 138, 1417
- Tribble (1993) Tribble, P., 1993, MNRAS, 261, 57
- Tremblay et al. (2009) Tremblay G. R., Chiaberge M., Sparks W. B., Baum S. A., Allen M. G., Axon D. J. Capetti A. et al., 2009, ApJS, 183, 278
- Tsujimoto et al. (2011) Tsujimoto M., Guainazzi M., Plucinsky P. P., Beardmore A. P., Ishida M., Natalucci L., Posson-Brown J. L. L., Read A. M., Saxton R. D., Shaposhnikov N. V., 2011, A&A, 525, 25
- Viner & Erickson (1975) Viner M. R., Erickson W. C., 1975, AJ, 80, 931
- Worrall & Birkinshaw (1994) Worrall D. M. and Birkinshaw M., 1994, ApJ, 427, 134
- Worrall et al. (2010) Worrall D. M., Birkinshaw M., O’ Sullivan E., Zezas A., Wolter A., Trinchiery G., Fabbiano G., 2010, MNRAS, 408, 701
- Worrall et al. (2012) Worrall D. M., Birkinshaw M., Young A. J., Momtahan K., Fosbury R. A. E., Morganti R., Tadhunter C. N. and Verdoes Kleijn G., 2012, MNRAS, 424, 1346
- Wykes et al. (2013) Wykes S., Croston J. H., Hardcastle M. J., Eilek J. A., Biermann P. L., Achterberg A., Bray J. D., Lazarian A., Haverkorn M., Protheroe R. J., Bromberg O., 2013, A&A, 558, 19
- Young et al. (2005) Young A., Rudnick L., Katz D., Delaney T., Kassim N.E., Makishima K., 2005, ApJ, 626, 748
- Zezas et al. (2005) Zezas A., Birkinshaw M., Worrall D. M., Peters A., Fabbiano G., 2005, ApJ, 627, 711