Spectral weight redistribution in (LaNiO3)n/(LaMnO3)2 superlattices from optical spectroscopy
Abstract
We have studied the optical properties of four (LaNiO3)n/(LaMnO3)2 superlattices (SL) (=2, 3, 4, 5) on SrTiO3 substrates. We have measured the reflectivity at temperatures from 20 K to 400 K, and extracted the optical conductivity through a fitting procedure based on a Kramers-Kronig consistent Lorentz-Drude model. With increasing LaNiO3 thickness, the SLs undergo an insulator-to-metal transition (IMT) that is accompanied by the transfer of spectral weight from high to low frequency. The presence of a broad mid-infrared band, however, shows that the optical conductivity of the (LaNiO3)n/(LaMnO3)2 SLs is not a linear combination of the LaMnO3 and LaNiO3 conductivities. Our observations suggest that interfacial charge transfer leads to an IMT due to a change in valence at the Mn and Ni sites.
Recent progress in the growth of correlated oxide heterostructures has sparked interest in understanding and exploiting the novel electronic and magnetic properties that emerge at the interfaces between different material systems mannhart . In transition metal oxides, electronic orbitals tend to overlap less than the - and - orbitals in semiconductors, resulting in strong electronic correlations imada , higher values of the effective mass of charge carriers, and larger coupling to the polarized lattice. Correlation effects can be further enhanced at oxide interfaces, since the rupture of the periodicity of the ion lattice at the interface may reduce the electronic screening and thus increase the on-site Coulomb interaction. Interfacial charge redistribution in these systems results in the reconstruction of orbital and spin degrees of freedom (electronic reconstruction) producing correlated two-dimensional (2D) states with novel electronic and magnetic behaviors bhatta .
We address here (LaNiO3)n/(LaMnO3)2 superlattices hoffman13 , where the subscript denotes the layer thickness in terms of pseudocubic unit cells. X-ray spectroscopy of this system shows that the Mn oxidation state is converted from 3+ to 4+, while Ni is intermediate between 2+ and 3+ hoffman13 . A metal to insulator transition is observed as is decreased from 5 to 2. Charge transfer at the LNO/LMO interface therefore provides the opportunity to control the interplay between magnetism and charge transport in a Ni based oxide, as highlighted by several recent theoretical lee ; dong and experimental gibert ; hoffman13 studies.
LaNiO3 (LNO) is the only member of the perovskite rare-earth nickelate series that does not undergo a metal to insulator transition at low temperatures (T) torrance92 . Due to the low-spin 3 configuration of Ni3+, it has been proposed that the combination of LNO with other oxides in some superlattice (SL) structure may provide the possibility to mimic the CuO2 planes of high-temperature superconductors chaloupka08 ; hansmann09 . LaMnO3 (LMO) on the other hand, is an antiferromagnetic insulator, known for being the parent compound of colossal magnetoresistance manganites tokura99 ; tokura06 .
In this work we have measured the reflectivity of four (LNO)n/(LMO)2 SLs (=2, 3, 4, 5) together with a LNO thin film, from 100 to 16000 cm-1 at nearly normal incidence and between 20 and 400 K. The measurements were performed by means of a BRUKER 70v interferometer, using a gold mirror as a reference and various beamsplitters, detectors and thermal sources to cover the whole infrared range. The samples were grown by molecular beam epitaxy, as previously described in Ref. hoffman13 . LNO and LMO thin films prepared under the same conditions as the superlattices were found to possess electronic and magnetic properties comparable to high-quality bulk single-crystal samples, suggesting the samples in this study are stoichiometric. By varying the number of bilayers within each superlattice, the total thickness of the samples was kept constant at about 64 nm, as confirmed by x-ray reflectivity measurements. Our reflectivity measurements elucidate the mechanism behind the metal insulator transition with decreasing . In particular, we observe a systematic shift in the spectral weight away from the Drude peak, and also from higher frequencies (near-infrared and above) into the mid-infrared, with the onset of insulating behavior as decreases from 5 to 2. Our observations are consistent with a localization mechanism that is driven by interfacial transfer of electrons from LMO into LNO.
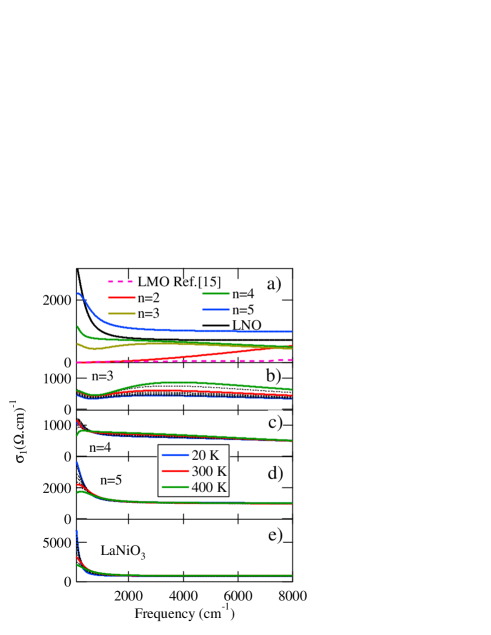
In Fig. 1 we report the reflectivities of the four SLs, together with that of LNO, from 100 to 8000 cm-1. Due to the small thickness of the SLs, the reflectivity is dominated by the STO substrate as shown by the gray line in Fig. 1a. Below 800 cm-1, i.e., in the far-infrared region characterized by the large STO phonon band, the reflectivity decreases with increasing . On the other hand, the opposite occurs in the mid-infrared (800-8000 cm-1), where the reflectivity of the SL is enhanced with respect to the substrate. A similar effect was previously observed in the (LaMnO3)/(SrMnO3) series perucchi , where an increase (decrease) in reflectivity in the mid- (far-) infrared range is attributed to higher conductivity properties. The reflectivity of the =2 superlattice does not vary significantly with temperature. As shown in Fig. 1b, the temperature dependence of the =3 compound is essentially confined to frequencies above 1000 cm-1. As increases, the observed T-dependence progressively moves towards the far-infrared range, with the =5 and pure LNO samples being independent of temperature above 2000 cm-1.

The optical conductivity of the LNO/LMO superlattices can be extracted through a fitting procedure based on the Kramers-Kronig consistent Lorentz-Drude model kuzmenko05 , by taking into account the finite thickness of the sample and the substrate’s contribution to the reflectivity perucchi . An overview of all the room temperature optical conductivities is provided in Fig. 2a, after subtracting the phonon modes of the SL. This helps to single out the electronic contribution to the optical conductivity.
For the =2 compound, the optical conductivity smoothly tends to zero in the dc limit, thus indicating insulating behavior. However, the onset of a mid-infrared band is clearly present. We note that in pure LMO the first absorption band is centered at about 2.5 eV (20000 cm-1), while no spectral weight is found in the mid-infrared region okimoto97 . At larger values of , the optical conductivity increases in the whole infrared range, as a signature for the onset of metallization. For the =5 compound, a clear Drude term is present, superimposed on an almost flat background infrared conductivity. Interestingly, the =5 SL differs from pure LNO, which displays a sharper Drude peak and lower mid-infrared spectral weight.
In panels b to e in Fig. 2, we report the T-dependence of the optical conductivities in the various compounds. For low , the T-dependence is more pronounced in the mid-infrared range, while with increasing , the T-induced changes gradually shift towards the far-infrared. We observe a non-negligible increase of the mid-infrared spectral weight, with increasing temperature for the low SLs. For larger , as well as for pure LNO, the Drude peak lowers and slightly broadens, with increasing temperature.
The LNO film displays metallic properties, with dc conductivity values reaching up to 104 (.cm)-1, in good agreement with previously reported values of resistivity hoffman13 . A clear Drude peak coexists with a broad electronic background associated with interband transitions within the Ni manifold basov . The plasma frequency (), calculated as the spectral weight underlying the Drude peak, is about 9000 cm-1. As displayed in Fig. 3, the temperature dependence of the spectral weight , integrated up to , follows the quadratic relation ortolani05 ; toschi05 . The dependence of is a general feature of metallic systems, that finds a natural explanation within a tight-binding approach, through the temperature dependence of the kinetic energy. In conventional metals, the energy scale set by should be large enough to fully recover the conservation of the spectral weight, resulting in a vanishingly small ortolani05 . The parameter gauges the presence of correlation effects baldassarre08 , which extend the temperature dependence of the spectral weight to energy scales larger than . For LNO 10-7K-2, a value which is sizably larger than that found in gold (1.310-8K-2) ortolani05 , and comparable to La2-xSr2CuO4 (2.510-7K-2) ortolani05 . An alternative method to estimate correlations is to calculate the ratio of kinetic energies obtained from experiment and from band theory , which ranges from 0 for a Mott insulator, to 1 for conventional metals qazilbash09 . is proportional to the spectral weight due to the Drude term. By integrating the optical conductivity up to 500 cm-1 (which roughly corresponds to a cut-off for the Drude’s spectral weight ouellette10 ) and employing the LDA (Local Density Approximation) data from Ref. ouellette10 we find for LNO, similar to underdoped and optimally doped cuprates qazilbash09 .
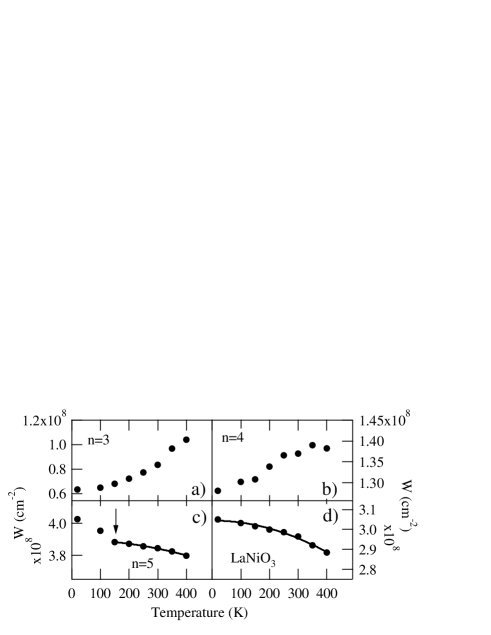
The optical conductivity of the =5 SL presents many analogies with pure LNO. Since a Drude peak is also well distinguishable in the data, we can again estimate the plasma frequency to be about 8500 cm-1, roughly the same as for LNO. A behavior of is found at temperatures between 150 and 400 K, with 10-7K-2. Below 150 K, which notably corresponds to the magnetic ordering temperature of bulk LMO and LNO/LMO SLs hoffman13 , a clear change is observed in the slope of , thus suggesting a coupling between magnetism and carrier density. The overall spectral weight is significantly larger in the =5 compound, due to a larger mid-infrared conductivity.
In the compounds with 5, the separation of the Drude term from the incoherent electronic background is more arbitrary. We can roughly estimate of about 5000 and 4000 cm-1 for the =4 and =3 compounds respectively. does not follow a quadratic law, and even increases with increasing temperature (panels a and b in Fig. 3), thus highlighting the increased role of incoherent excitations in shaping the infrared conductivity.
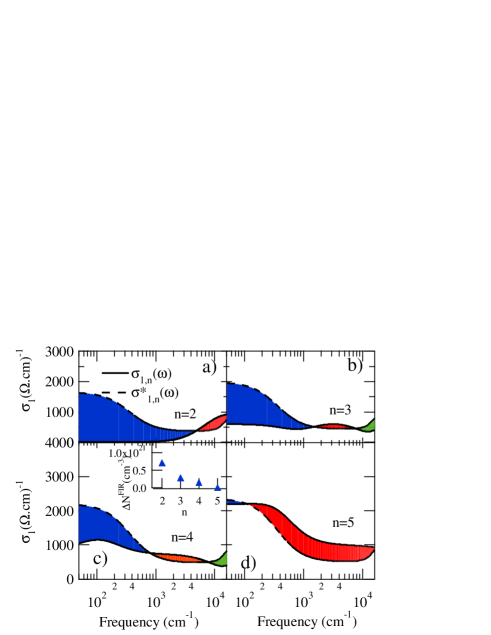
In order to better understand the present phenomenology, we introduce the average optical conductivity , defined as a weighted linear combination of the optical conductivity of the single constituents of a given SL:
| (1) |
Since disregards interfacial effects, the comparison between the measured and allows us to single out the features directly induced by the presence of the interfaces (Fig. 4).
The presence of the interface induces a loss of spectral weight in the low frequency side, for all SL compounds (blue area in Fig. 4). From this quantity, we can calculate the charge density () involved in such spectral weight redistribution by assuming , where . As shown in the inset of Fig. 4c, increases monotonically with decreasing , i.e., by increasing the number of interfaces in the SL.
The interfaces are also responsible for the piling up of new spectral weight at mid-infrared frequencies (red area in Fig. 4). The mid-infrared spectral weight redistribution can not be systematically estimated for all compounds, since for =2 and =5, the red area extends above our maximum frequency limit (16000 cm-1). However, we can safely conclude that the red area is always larger than the blue one (note log scale on x axis in Fig. 4). This indicates that the additional mid-infrared spectral weight is only in part due to the loss of spectral weight at low frequencies, and that a redistribution from the high frequency side (green area in Fig. 4) is also at play.
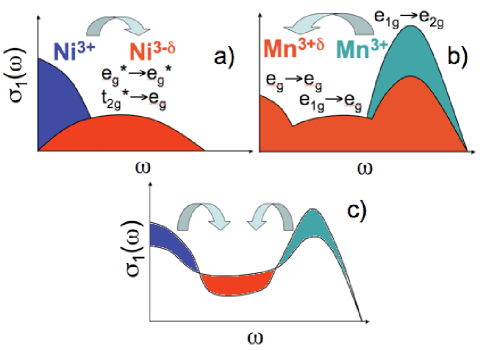
The optical data can be understood within the qualitative model depicted in Fig. 5. In the superlattice compound, with decreasing , the valence of Ni decreases from its nominal Ni3+ value typical of stoichiometric LaNiO3. The reduction in the Ni oxidation state is known sanchez96 to drive a metal to insulator transition already at values about +2.75. From transport measurements on LNO reduced in oxygen sanchez96 , it is known that the semiconducting behavior is characterized by infrared activation energies (250 cm-1 for Ni2.75, and 1000 cm-1 for Ni2.5). We thus expect that the introduction of LMO layers in the SL, by reducing Ni valence, progressively depletes the low energy, coherent spectral weight of LNO, which piles up in the infrared, as schematically shown in Fig. 5a.
On the other hand, LMO is an insulator, with the first optical absorption occurring at about 2.5 eV okimoto97 , corresponding to the Jahn-Teller splitting of the band. When the Mn valence increases from 3+ to a higher oxidation state (as in La1-x(Sr/Ca)xMnO3), polaronic states appear in the mid-infrared, whose spectral weight is taken from the Jahn-Teller band at 2.5 eV (see Fig. 5b). At intermediate values of the Mn oxidation state () a metallic state may also set in, due to double-exchange physics zener51 ; millis95 . While we know from x-ray spectroscopy that Mn has mainly 4+ character in the SLs, the spectral weight increase observed below the magnetic ordering temperature in the inset of Fig. 2d, may be a hint at the survival of the double-exchange physics in the LNO/LMO series. Panel 5c, pictorially describes the effect of the charge transfer between Mn and Ni sites on the overall optical conductivity, thus providing a qualitative explanation for the piling up of spectral weight at mid-infrared frequencies, at the expense of the far-infrared, and high energy (visible/UV) sides. Interfacial charge redistribution was previously identified as a possible origin of changes to the mid-infrared spectral response in manganite perucchi ; choi11 and vanadate superlattices jeong11 . This is in contrast to what is observed in LNO/LaAlO3 superlattices liu12 ; benckiser11 and in ultrathin LNO films scherwitzl11 , where localization is believed to occur due to dimensional confinement and enhanced correlations.
Infrared data show that the LNO/LMO superlattices display the presence of significant mid-infrared excitations that are not present in LNO or LMO alone. Since SLs are intrinsically ordered structures, we can rule out disorder as a possible source for the presence of such incoherent excitations. On the other hand, both electronic correlation and polaronic effects (or even more likely, a mixture of the two) can be invoked as the mechanisms underlying the piling up of spectral weight in the mid infrared range. By increasing , it is possible to progressively enhance the coherent excitations, thereby tuning the degree of metallicity of the SL. For =5 the low energy electrodynamics is dominated by coherent excitations, while some coupling with magnetic ordering takes place below 150 K. Ab initio calculations could be of help in better elucidating these points baldassarre08 . The LNO/LMO systems thus provide an exciting new platform to manipulate and control the interplay of electronic, magnetic and vibrational degrees of freedom in a disorder-free 2D oxide material.
Acknowledgements.
This work was partially supported by Italian Ministry of Research (MIUR) program FIRB Futuro in Ricerca grant no. RBFR10PSK4. J.D.H and A.B. acknowledge support from Department of Energy, Office of Basic Energy Science, Materials Science and Engineering Division. Work at Argonne National Laboratory, including the use of the Center for Nanoscale Materials and Advanced Photon Source, was supported by the U.S. Department of Energy, Office of Basic Energy Sciences under contract number DE-AC02-06CH11357.References
- (1) J. Mannhart and D. G. Schlom, Science 327, 1607 (2010).
- (2) M. Imada, Rev. Mod. Phys. 70, 1039 (1998).
- (3) A. Bhattacharya and S. J. May, Annu. Rev. of Mater. Res. v. 44, 65-90 (2014).
- (4) J. Hoffman et al., Phys. Rev. B 88, 144411 (2013).
- (5) A. T. Lee and M. J. Han, Phys. Rev. B 88, 035126 (2013).
- (6) S. Dong and E. Dagotto, Phys. Rev. B 87, 195116 (2013).
- (7) M. Gibert et al., Nature Materials 11, 195 (2012).
- (8) J.B. Torrance, P. Lacorre, A.I. Nazzal, E.J. Ansaldo, and C. Niedermayer, Phys. Rev. B 45, 8209 (1992).
- (9) J. Chaloupka and G. Khaliullin, Phys. Rev. Lett. 100, 016404 (2008).
- (10) P. Hansmann et al., Phys. Rev. Lett. 103, 016401 (2009).
- (11) Y. Tokura and Y Tomioka, J. Magn. Mater. 200, 1 (1999).
- (12) Y. Tokura, Rep. Prog. Phys. 69, 797 (2006).
- (13) A. Perucchi et al., Nano Letters 10, 4819 (2010).
- (14) A.B. Kuzmenko, Rev. Sc. Instr, 76, 083108 (2005).
- (15) Y. Okimoto, T. Katsufuji, T. Ishikawa, T. Arima, and Y. Tokura, Phys. Rev. B 55, 4206 (1997).
- (16) M. K. Stewart et al., Phys. Rev. B 83, 075125 (2011).
- (17) M. Ortolani, P. Calvani and S. Lupi, Phys. Rev. Lett. 94, 067002 (2005).
- (18) A. Toschi et al., Phys. Rev. Lett. 95, 097002 (2005).
- (19) L. Baldassarre et al., Phys. Rev. B 77, 113107 (2008).
- (20) M.M. Qazilbash et al., Nature Physics 5, 629 (2009).
- (21) D.G. Ouellette et al., Phys. Rev. B 82, 165112 (2010).
- (22) R.D. Sanchez et al., Phys. Rev. B 54, 16574 (1996).
- (23) C. Zener, Phys. Rev. 82, 403 (1951).
- (24) A.J. Millis, P.B. Littlewood, B.I. Shraiman, Phys. Rev. Lett. 74, 5144 (1995).
- (25) W.S. Choi et al., Phys. Rev. B 83, 195113 (2011).
- (26) D.W. Jeong et al., Phys. Rev. B 84, 115132 (2011).
- (27) J. Liu et al, Phys. Rev. B 83, 161102(R) (2011).
- (28) E. Benckiser et al., Nature Materials 10, 189 (2011).
- (29) R. Scherwitzl et al., Phys. Rev. Lett. 106, 246403 (2011).