Identification of novel Cu, Ag, and Au ternary oxides from global structural prediction
Abstract
We use ab initio global structural prediction, and specifically the minima hopping method, to explore the periodic table in search of novel oxide phases. In total, we study 183 different compositions of the form MXO2, where M=(Cu, Ag, Au) and X is an element of the periodic table. This set includes the well-known Cu delafossite compounds that are, up to now, the best -type transparent conductive oxides known to mankind. Our calculations discover 81 stable compositions, out of which only 36 are included in available databases. Some of these new phases are potentially good candidates for transparent electrodes. These results demonstrate, on one hand, how incomplete is still our knowledge of the phase-space of stable ternary materials. On the other hand, we show that structural prediction combined with high-throughput approaches is a powerful tool to extend that knowledge, paving the way for the experimental discovery of new materials on a large scale.
![[Uncaptioned image]](/html/1503.07327/assets/spg166.jpg)
The delafossite crystal structure.
1 Introduction
Most of the knowledge painfully accumulated over centuries concerning the crystal structure of (inorganic) materials is nowadays gathered in generally available databases. The most used of these, the Inorganic Crystal Structure Database (ICSD) 1 contains around 170,000 entries. These entries include unfortunately duplicated structures, insufficiently characterized phases (e.g., missing the positions of H atoms), and several alloys. If we restrict ourselves to well-defined crystal structures we find around 40,000 entries.
It is this amount of 40,000 entries that has been studied theoretically, in a systematic manner, over the last few years using high throughput techniques. The results of these large-scale studies can be found in excellent publicly available databases, such as the Materials Project 2, the Open Quantum Materials Database 3, or the Ab-initio Electronic Structure Library AFLOWLIB 4. These are then used as a starting point for sophisticated machine learning techniques that try to design new materials with tailored properties. These techniques have been touted as the most cost effective path to the discovery of new materials in a diverse range of applications, such as Li batteries 5, 6, thermoelectricity 7, 8, 9, photovoltaics 10, 11, 12, 13.
But let us go a step back, and look at the 40,000 materials we know nowadays. The first question that comes to our mind is if this set is representative of the number of (thermodynamically stable) materials that we can create in a lab. The answer to this question is probably no. It is true that elementary substances and binary compounds are relatively well studied, but enormous gaps still exist in our knowledge of ternary and multinary materials. Of course, a systematic experimental endeavor of synthesis and characterization of all possible phases is extremely expensive and time-consuming. It is for this task that numerical simulations appear as the most cost-effective way to explore the gigantic search space of compositions at our disposal.
In this context, most theoretical studies follow a very simple recipe. It is well-known that Nature often chooses the same solution to similar problems. Therefore, one takes a known, experimentally characterized structure, change its chemical composition, and hope that this will also be a (dynamically and thermodynamically) stable phase for the new composition. Sometimes the chemical composition can be varied by “brute force” or one can use sophisticated machine learning algorithms to predict what are the most promising substitutions 14, 15, 16, 17. A recent example of the first approach is the work of Carrete and coworkers 9, who computed all possible compositions of half-Heusler compounds in the cubic structure (around 80,000 possibilities), while the latter approach was used, for example, by Hautier and coworkers 18 who investigated Nature’s missing oxides, i.e., which oxides were thermodynamically stable, but still unknown to mankind. It is evident that in either case the major drawback of this approach is the impossibility to discover any material with different crystal structure than those of the compounds already contained in available databases.
In this Article, we address this problem and go a step further, showing that structural prediction algorithms can be used on a large scale together with high-throughput methods to predict the lowest-energy crystal structures of materials with unreported chemical compositions. The problem that global structural prediction methods try to solve is very simple to explain: given the chemical composition of a solid, obtain the minimum energy crystal structure, i.e. its ground-state. In possession of this structure, we can then evaluate its energy and a number of spectroscopic properties using standard methods based on density functional theory and beyond. Of course, the number of possible minima in a solid increases exponentially with the size of the unit cell, which makes structural prediction an extremely hard numerical problem. Fortunately, several smart algorithms for global structural prediction appeared over the last decade, ranging from random search to evolutionary algorithms 19, 20, 21, 22.
Our method of choice is the minima hopping method 23, 24. This is an efficient algorithm designed to predict the low-energy crystal structures of a system given solely its chemical composition. At a given pressure, the enthalpy surface is explored by performing consecutive short molecular dynamics escape steps followed by local geometry relaxations, taking into account both atomic and cell variables. The initial velocities for the molecular dynamics trajectories are chosen approximately along soft mode directions, allowing efficient escapes from local minima and aiming towards lower energy valleys. Revisiting already known structures is avoided by a feedback mechanism. The minima hopping method has been used for structural prediction in a wide range of materials 25, 26, 27, 28, including the dependence on pressure 29 and the exploration of binary phase diagram 30 with remarkable results.
We use this machinery to study a subset of oxides, namely those having a composition of the type (Cu,Ag,Au)XO2, which includes the “famous” delafossites Cu(Al,In,Ga)O2 31, 32, 33, 34. These compounds of this family are still the most promising p-type transparent conductive oxides (TCO) known to mankind. TCOs possess the uncommon property of being at the same time transparent to the visible spectrum and good electric conductors. These properties make them indispensable for many high-technology devices which require transparent contacts, such as flat panel displays, touch screens, thin-film and stacked solar cells, functional windows, etc. Good electron (n-)doped TCOs, namely those based on SnO2, In2O3, and ZnO, are already widely used in commercial applications. However, potential p-type TCOs identified up to date have conductivities at least one-two orders of magnitude lower than their n-type counterparts and carrier mobilities too small for large-scale exploitation. The best p-type TCO until now is CuCr(1-x)MgxO2 35, which displays a conductivity of 220 cm-1 and a hole mobility of about 1 cm2/Vs, while also suffering from poor transparency, with transmission in the visible smaller than 30%. The origin of the relatively higher hole mobility of Cu delafossites relies on the fact that the highest valence bands are obtained through the strong hybridization of almost-degenerate oxygen and copper states. This hybridization reduces the localization of the top valence states on oxygen atoms, leading to more dispersive - anti-bonding bands with smaller hole effective masses36. A tetrahedral coordination of oxide ions (as in delafossite crystals) is particularly advantageous as it allows strong hybridization. Cu1+ (or equivalently Ag1+ and Au1+) appear ideal elements for creating a - dispersive top valence while preserving transparency, as their closed shell will prevent from absorption in the visible. Even if it is believed that a Cu+1 configuration is the best to obtain TCOs, we decided nevertheless to explore blindly also compositions that favor Cu2+ or even Cu3+, as we do not want to preclude the possible formation of crystalline structures different from delafossite that would let emerge interesting electronic properties in different environments.
We can extract from the analysis above some expected good rules for the design of improved p-type TCOs: (i) cations should have shells proximate in energy to oxygen states; (ii) cation shells should be closed to avoid optical absorption in the visible range; (iii) strong hybridization of oxygen and cation states is required to increase the band dispersion36. Following these simple ideas, few other Cu oxides were already successfully tested in experiments after Cu(Al,In,Ga)O2 31, 32, 33, 34, such as CuCrMgO2 37, SrCu2O2 38 or LaCuOS 39 and (Cu,Ag)ScO2 35. Our aim is now to extend and make more systematic this investigation by pre-screening in silico all possible Cu, Ag, and Au based ternary oxides, in order to offer to experimentalists a reliable guide on the stability and electronic properties of the still unknown compositions. While we selected the broad family of (Cu,Ag,Au)XO2 oxides as some of their members are examples of compounds satisfying the empirical rules for good p-type TCO candidates, we decided at the same time to limit as much as possible the restrictions imposed to the choice of chemical elements inside this family, not to hinder the emergence of unreported crystal structures with completely different electronic properties.
Note that the set under consideration here is also a subset of the systems studied using high-throughput techniques in the above-mentioned work of Hautier and coworkers18. As a consequence, we will be able to provide a direct comparison of the success rate of our mixed approach, that combines high-throughput with structural prediction, in comparison with a purely high-throughput study. For reference, we should keep in mind that three metastable materials of the type (Cu,Ag,Au)XO2 unreported in experimental databases were obtained in Ref. 18, namely (i) a trigonal phase of AgCoO2 (50 meV above the convex hull of thermodynamic stability) based on the prototype experimental structure of AgInO2, (ii) a tetragonal phase of AgCsO2 (340 meV above the hull) based on the prototype CuCsO2 , and (iii) an hexagonal phase of AgLaO2 based on the prototype AgAlO2 (4 meV above the hull).
2 Methodology
We performed minima hopping simulations for all stoichiometries of the type (Cu,Ag,Au)XO2, where X is any element of the periodic table up to Bi with the exclusion of the rare gases and the lanthanides. Forces and energies were calculated within density functional theory 40, 41 in the projector augmented wave (PAW) formalism 42 as implemented in vasp 43, 44. For a given stoichiometry, the initial geometries were obtained randomly, ensuring only that the minimal distance between the atoms was at least equal to the sum of the covalent radii. The MHM searches were performed using the Perdew-Burke-Erzernhof (PBE) 45 approximation to the exchange-correlation functional. We used default “high” accuracy energy cutoffs. Each minima hopping run was repeated at least twice, using both one and two formula units (4 or 8 atoms). This may seem a relatively small number of atoms in the unit cell, but if we look at the experimentally known structures of the (Cu,Ag,Au)XO2 family, we realize that almost all of them have a ground-state with less than 8 atoms (exceptions are some metastable phases of AgCO2 with 16 atoms per unit cell and a stable phase of AgBO2 with 128 atoms per unit cell). Therefore, we assume that this is not a major limitation.
We then compared the structures obtained in our runs with the ones present in available experimental and theoretical databases 2, 3. Almost all experimental structures appeared at the early stages of our minima hopping runs, which certainly proves the efficiency of the method for this kind of task. Finally, we took the experimental structures and other relevant theoretical phases that we discovered during our minima hopping runs, and used them as prototypes for modified stoichiometries. We believe that this procedure, which effectively mixes high-throughput techniques with structural prediction is essential in such large scale applications as each method can be used to provide a check on the other.
In total we investigated 183 stoichiometries, and we obtained 21,000 minima, of which 7,500 were further analyzed. In this last step we followed the same protocol as in the Materials Project database: spin-polarized calculation using the PBE 45 exchange-correlation functional, with the exception of the oxides of Co, Cr, Fe, Mn, Mo, Ni, V, W where an on-site Coulomb repulsive interaction U 46 with a value of 3.32, 3.7, 5.3, 3.9, 4,38, 6.2, 3.25, and 6.2 eV, respectively, was added to correct the -states. PAW setups were taken from the version 5.2 of vasp. At this stage the energy cutoff was set to 520 eV (irrespective of the elements considered) and k-point grids were automatically chosen to ensure convergence to better than 2 meV per atom. For all low-lying minima we studied the thermodynamic phase equilibria of the ternary system, considering the energy balance with respect to all possible decompositions in ternary, binary and elementary compounds that respect the overall stoichiometry: i.e, we measured the thermodynamic stability by calculating the energy distance from the convex hull of stability, which is the set of lines that connects the lowest energy ordered phases, using pymatgen 47 and the data available in the Materials Project database. According to this definition, a compound is stable if its total energy distance to the convex hull is zero. Finally, the crystallographic analysis of the structures was performed using findsym 48.
3 Results
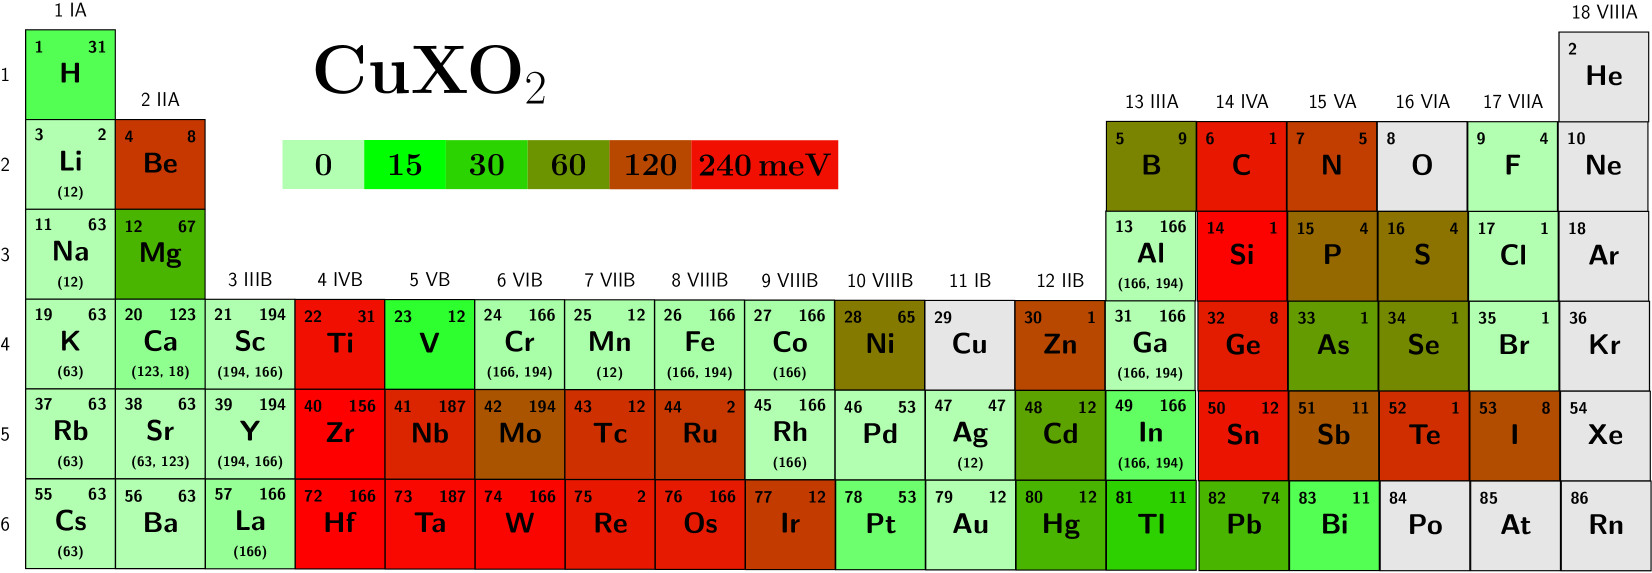
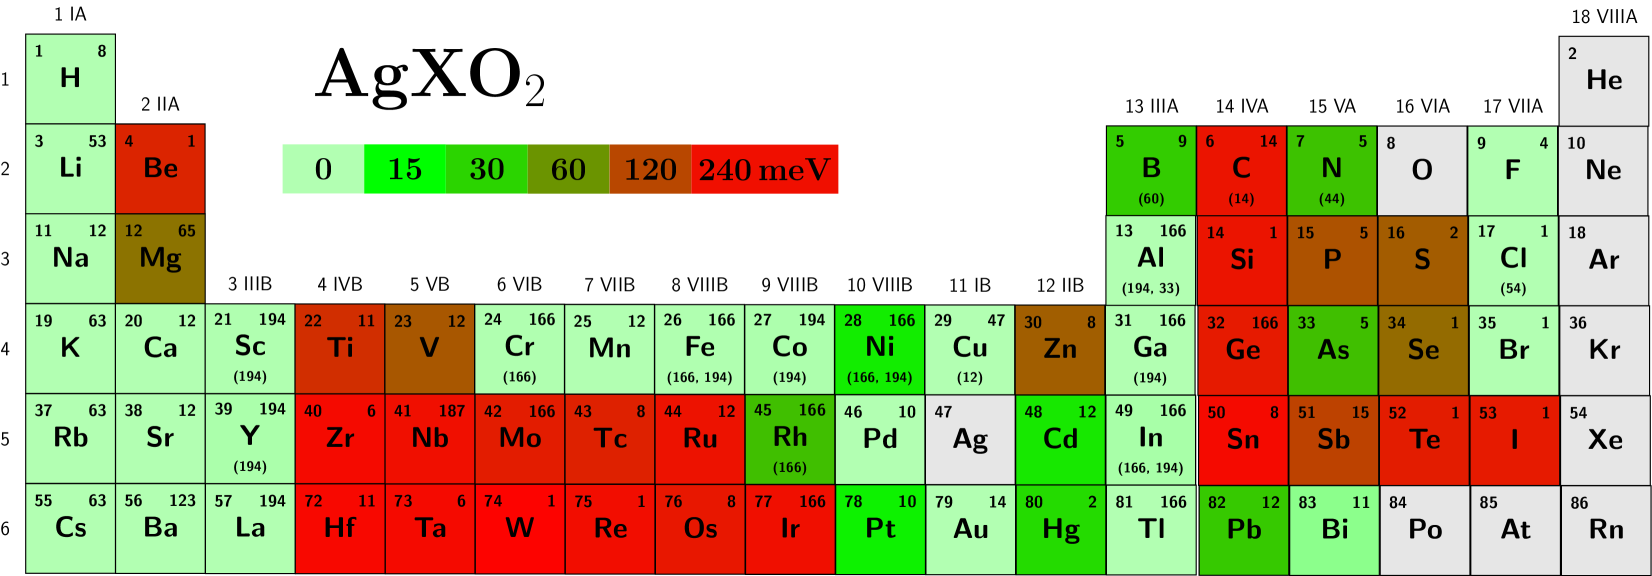
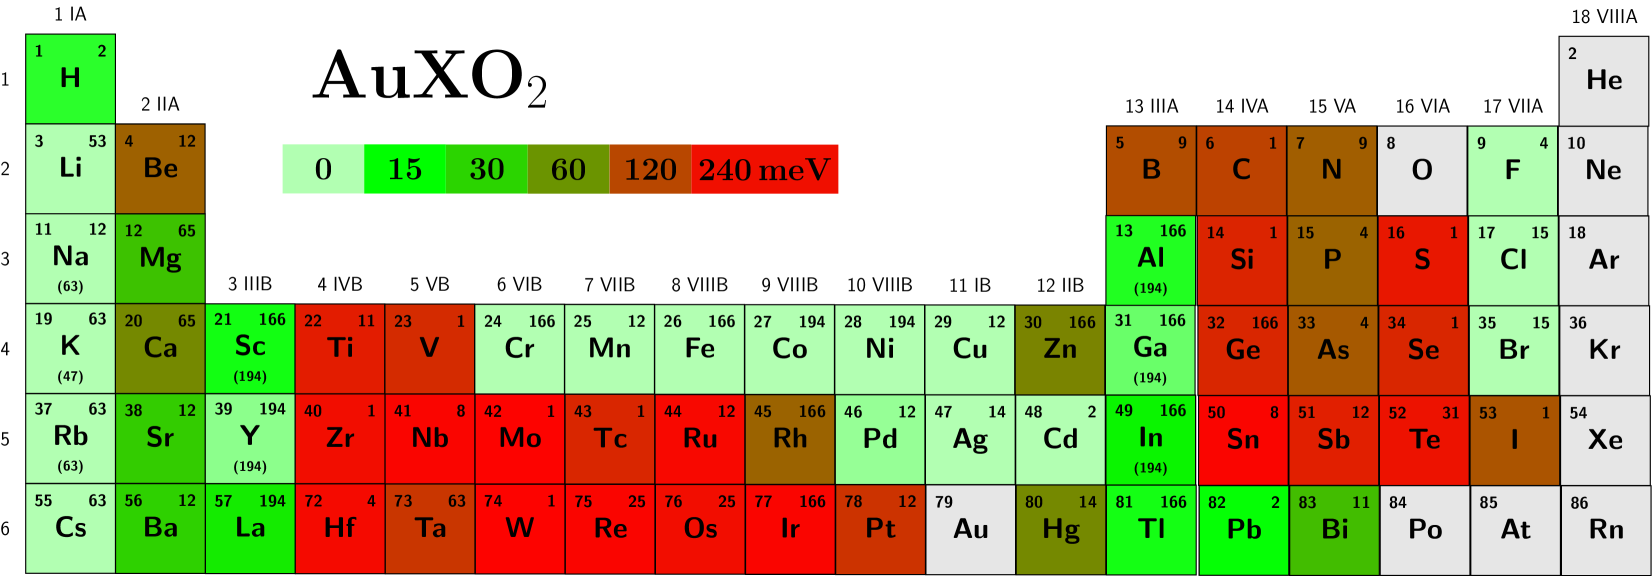
Our results are summarized in Fig. 1. In these periodic tables the color scale indicates the distance of the calculated energy of the ground-state structure to the convex hull of stability. Light green cases indicate stable structures (i.e. that the specific composition correspond to a crystal structure on the hull). We further indicate the atomic number (upper left), the space group we predict for the lowest energy phase (upper right), and the space groups of the lowest-energy experimental structure that we found in available databases (in parenthesis below the chemical symbol). This means that all squares without a number below the chemical symbol represent crystal structures predicted theoretically. Further details can be found in the Supporting Information that includes structural and electronic data of the most important (meta-) stable structures.
As we can see from Fig. 1, many compositions are thermodynamically stable, and many others are quite close to the convex hull. Note that our calculations are performed at zero temperature and pressure for perfect periodic crystals. However it is well known that unstable phases can be stabilized by temperature, pressure, defects, dopants, etc. Moreover, due to the theoretical error associated to the calculation of the total energy, an inversion of the ordering of the phases very close in energy is always possible. In view of the above, we believe it is relevant to discuss all compositions that are either thermodynamically stable or quasi-stable (within 20 meV from the convex hull). This choice of 20 meV as a threshold of stability comes from the observation that well studied experimental compounds such as CuInO2 and AgNiO2 are above the hull by 10-20 meV in our calculations performed for perfect stoichiometric bulk crystals. The set of structures that we select within this threshold of 20 meV contains therefore phases that have a large chance of being synthesized experimentally. We find that this stability condition is fulfilled by 81 compositions (30 containing Cu, 29 containing Ag, and 25 containing Au), of which only 36 (19 containing Cu, 11 containing Ag, and 8 containing Au) are present in experimental databases. We are now in the position to compare our predictions with previous theoretical works. We compared directly the crystal structures whenever they were available for comparison. If the structure in literature was not given, we used available information on the symmetries and distance to the convex hull to compare with our results. There are two phases (AgLaO2 and AgCsO2) previously predicted in Ref. 18, while theoretical crystal structures for CuBaO2, CuAuO2, CuHgO2, AgLiO2, AgNaO2 can be found in the Materials Project database. In the two cases of AgLaO2 and AgNaO2 we find the same crystal structure as previously predicted. However, in the other five cases the MHM runs were able to find lower-energy phases. In particular, the reported structures of CuBaO2, AgLiO2, and AgCsO2 were well above the hull, while our lowest-energy structures are thermodynamically stable. We should also observe that there may exist even lower energy structures that were not detected in the MHM runs (because their unit cell contains more than 8 atoms, for example). However, the compounds we predict to be thermodynamically stable have a high chance of being experimentally synthesizable, even if the actual atomic arrangement may eventually differ from the one that we have determined. In this sense, the periodic tables shown in Fig. 1 offer a simple guide to experimentalists by indicating which compositions are expected to be easy and which are expected to be hard to synthesize, based on thermodynamic considerations.
Before entering in a detailed discussion on the electronic properties of the new stable phases found in our simulations, a few general remarks are in order. (i) There are some basic atomic arrangements that are energetically favorable (with some exceptions) for many compounds of the (Cu,Ag,Au)XO2 family. The most common ones are the delafossite structure of, e.g., CuFeO2 (space groups 166 and 194) and the tetragonal structure of CuCaO2 (space group 123), together with some slightly distorted, and therefore less symmetric, variants. We stress, however, that some recurrent crystal structures that we identified do not have any representative compound in databases. (ii) A majority of the structures are layered, but there is a substantial variety in the geometry of the layers. (iii) We observe a mixture of semiconducting and metallic structures, and for some compositions we can even find semiconducting and metallic phases separated by only a few meV/atom.
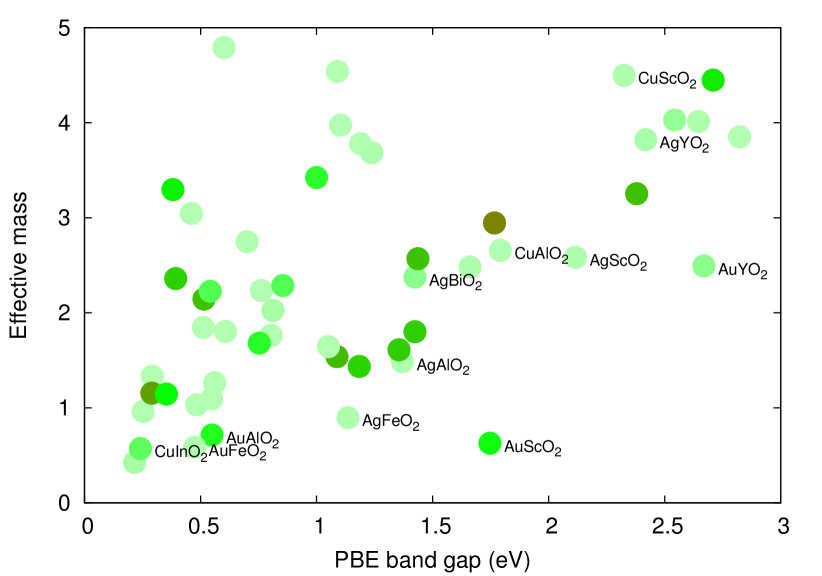
Having the crystal structures of new stable and metastable (Cu,Ag,Au)XO2 compounds opens the way for a series of further theoretical studies. In fact, we can now calculate a wealth of physical properties using the numerous methods and codes available for theoretical spectroscopy. Our main motivation for the choice of this class of systems is the p-type conductivity measured in Cu delafossites. Therefore, we calculated the average hole effective mass and the electronic band-gap for the ground-state of all the stoichiometries studied. All calculations were perform with using pymatgen 47 and BoltzTrap 49 software packages. Following the same approach as Ref. 12 we calculated the averaged hole effective mass tensor for a carrier concentration of cm-3 and a temperature of 300 K. We then used the higher limit estimation for (see Supplemental Information of Ref. 12). The results are summarized in Fig. 2. In the figure, the color of the points indicates thermodynamical stability, respecting the same color scale as in Fig. 1. We observe that the numbers we indicate for the energy gap should be taken with care as they are Kohn-Sham gaps obtained with the PBE(+U) exchange-correlation functional, and are systematically underestimated 50, 51. The true gaps are substantially larger (usually at least twice as large) than the ones we indicate. Moreover, systems that are metallic within PBE(+U) can sometimes be semiconducting in experiment, however the inverse never happens. Note that band dispersions, and therefore effective masses, are generally less sensitive to the choice of the approximation used for the calculation of band structures.
For p-type transparent conductive materials we desire low-hole effective masses (to improve conductivity), and high energy gaps (to ensure transparency). Approximately in the center of Fig. 2 we find CuAlO2, the compound where p-type electrical conductivity in transparent thin-films was discovered for the first time 31. Its gap is sufficiently large (note that the PBE gap of 1.8 eV is substantially lower than the experimental gap of around 3.5 eV (see, e.g., Refs.50, 51 and references therein), but the hole effective mass is relatively high. Indeed, the p-type conductivity in CuAlO2 is still too low for technological applications. From Fig. 2 we can see that several materials have the potential to outperform CuAlO2, such as AgScO2, AuScO2, AuYO2, AgAlO2, AgBiO2, etc. Due to the presence of (expensive) noble metals (Ag and Au), it is unlikely that such materials can directly find large scale applications in technology, nevertheless an experimental study of conductivity in new interesting phases could give valuable ideas on if (and eventually how) hole mobilities can be increased beyond present limits.
In tables 1, 2 and 3 we summarize the information concerning the energy distances from the convex hull, the band gaps and the hole effective masses.
| Structure | Ehull | Spg | Gap | |
|---|---|---|---|---|
| CuHO2 | 8 | 31 | 0.5 | 2.23 |
| CuLiO2 | 0 | 2 | 0.5 | 17.9 |
| CuFO2 | 0 | 4 | 0.8 | 11.8 |
| CuNaO2 | 0 | 63 | 0.4 | 3.04 |
| CuMgO2 | 43 | 67 | 0.0 | – |
| CuAlO2 | 0 | 166 | 1.8 | 2.66 |
| CuClO2 | 0 | 1 | 0.8 | 48.9 |
| CuKO2 | 0 | 63 | 0.8 | 13.7 |
| CuCaO2 | 3 | 123 | 0.0 | – |
| CuScO2 | 0 | 194 | 2.4 | 4.50 |
| CuVO2 | 11 | 12 | 1.0 | 3.42 |
| CuCrO2 | 0 | 166 | 1.6 | 5.52 |
| CuMnO2 | 0 | 12 | 0.1 | 0.06 |
| CuFeO2 | 1 | 166 | 0.9 | 2.02 |
| CuCoO2 | 0 | 166 | 1.1 | 5.63 |
| CuGaO2 | 0 | 166 | 0.8 | 2.23 |
| CuBrO2 | 0 | 1 | 0.9 | 9.67 |
| CuRbO2 | 0 | 63 | 0.8 | 8.98 |
| CuSrO2 | 0 | 63 | 0.0 | – |
| CuYO2 | 0 | 194 | 2.6 | 4.01 |
| CuRhO2 | 0 | 166 | 0.7 | 2.75 |
| CuPdO2 | 0 | 53 | 0.0 | – |
| CuAgO2 | 0 | 47 | 0.0 | – |
| CuInO2 | 7 | 166 | 0.3 | 0.57 |
| CuCsO2 | 0 | 63 | 0.9 | 5.24 |
| CuBaO2 | 0 | 63 | 0.0 | – |
| CuLaO2 | 2 | 166 | 2.7 | 4.03 |
| CuYbO2 | 0 | 123 | 0.0 | – |
| CuPtO2 | 6 | 53 | 0.0 | – |
| CuAuO2 | 0 | 12 | 0.0 | – |
| CuHgO2 | 43 | 12 | 0.0 | – |
| CuTlO2 | 31 | 11 | 0.4 | 2.36 |
| CuPbO2 | 43 | 74 | 0.0 | – |
| CuBiO2 | 8 | 11 | 1.0 | 2.29 |
| Structure | Ehull | Spg | Gap | |
|---|---|---|---|---|
| AgHO2 | 0 | 8 | 0.0 | – |
| AgLiO2 | 0 | 53 | 0.5 | 1.85 |
| AgBO2 | 33 | 9 | 1.4 | 1.61 |
| AgNO2 | 37 | 5 | 1.4 | 2.57 |
| AgFO2 | 0 | 4 | 0.6 | 7.61 |
| AgNaO2 | 0 | 12 | 0.6 | 4.79 |
| AgAlO2 | 0 | 166 | 1.4 | 1.49 |
| AgClO2 | 0 | 1 | 0.6 | 2902 |
| AgKO2 | 0 | 63 | 0.9 | 5.80 |
| AgCaO2 | 0 | 12 | 0.0 | – |
| AgScO2 | 0 | 194 | 2.1 | 2.58 |
| AgCrO2 | 0 | 166 | 1.7 | 2.48 |
| AgMnO2 | 0 | 12 | 0.4 | 1.33 |
| AgFeO2 | 0 | 166 | 1.1 | 0.90 |
| AgCoO2 | 0 | 194 | 1.2 | 3.68 |
| AgNiO2 | 20 | 166 | 0.0 | – |
| AgGaO2 | 0 | 166 | 0.6 | 1.09 |
| AgAsO2 | 38 | 5 | 2.4 | 3.25 |
| AgBrO2 | 0 | 1 | 0.7 | 450 |
| AgRbO2 | 0 | 63 | 1.0 | 8.80 |
| AgSrO2 | 0 | 12 | 0.6 | 1.27 |
| AgYO2 | 0 | 194 | 2.4 | 3.82 |
| AgRhO2 | 38 | 166 | 0.5 | 2.14 |
| AgPdO2 | 0 | 10 | 0.1 | 0.03 |
| AgCdO2 | 23 | 12 | 0.0 | – |
| AgInO2 | 0 | 166 | 0.2 | 0.43 |
| AgCsO2 | 0 | 63 | 1.1 | 4.54 |
| AgBaO2 | 0 | 123 | 0.0 | – |
| AgLaO2 | 0 | 194 | 2.8 | 3.85 |
| AgPtO2 | 19 | 10 | 0.3 | 3.30 |
| AgAuO2 | 0 | 14 | 0.6 | 1.80 |
| AgHgO2 | 27 | 2 | 0.0 | – |
| AgTlO2 | 0 | 166 | 0.0 | – |
| AgPbO2 | 34 | 12 | 0.3 | 0.03 |
| AgBiO2 | 3 | 11 | 1.4 | 2.38 |
| Structure | Ehull | Spg | Gap | |
|---|---|---|---|---|
| AuHO2 | 12 | 2 | 0.7 | 1.68 |
| AuLiO2 | 0 | 53 | 1.1 | 3.78 |
| AuFO2 | 0 | 4 | 1.1 | 3.97 |
| AuNaO2 | 0 | 12 | 1.1 | 7.72 |
| AuMgO2 | 37 | 65 | 0.0 | – |
| AuAlO2 | 12 | 166 | 0.6 | 0.71 |
| AuClO2 | 0 | 15 | 0.3 | 0.96 |
| AuKO2 | 0 | 63 | 1.4 | 9.20 |
| AuScO2 | 14 | 166 | 1.8 | 0.63 |
| AuCrO2 | 0 | 166 | 1.2 | 1.65 |
| AuMnO2 | 0 | 12 | 0.0 | – |
| AuFeO2 | 0 | 166 | 0.6 | 0.59 |
| AuCoO2 | 0 | 194 | 0.5 | 1.03 |
| AuNiO2 | 0 | 194 | 0.0 | – |
| AuGaO2 | 6 | 166 | 0.0 | – |
| AuBrO2 | 0 | 15 | 0.0 | – |
| AuRbO2 | 0 | 63 | 1.4 | 8.45 |
| AuSrO2 | 33 | 12 | 1.3 | 1.80 |
| AuYO2 | 3 | 194 | 2.7 | 2.49 |
| AuPdO2 | 2 | 12 | 0.0 | – |
| AuCdO2 | 0 | 2 | 0.9 | 1.76 |
| AuInO2 | 18 | 166 | 0.0 | – |
| AuCsO2 | 0 | 63 | 1.5 | 6.59 |
| AuBaO2 | 31 | 12 | 1.2 | 1.44 |
| AuLaO2 | 21 | 194 | 2.7 | 4.45 |
| AuTlO2 | 13 | 166 | 0.0 | – |
| AuPbO2 | 15 | 2 | 0.4 | 1.14 |
| AuBiO2 | 40 | 11 | 1.3 | 1.54 |
These results call for more detailed experimental studies of this restricted set of compounds, that should be accompanied by more accurate calculations of the electronic band gaps (i.e. using GW approaches beyond standard density functional theory 50, 51) and of possible defects/impurities for p-type dopability. From a purely theoretical point of view, the results of Fig. 2 demonstrate that, with our approach, we are now able to go all the way from a simple stoichiometry to the estimate of relevant material properties for a vast class of materials.
We will now analyze more in detail the structural and electronic properties of the different subclasses of compounds that we identified. We will extend this discussion to phases that are closer than 50 meV to the convex hull.
3.1 Delafossites
The trigonal (space group 166) or hexagonal (space group 194) delafossite structures (depending on the stacking sequence) are the crystal structure assumed by all stable compounds with X belonging to group IIIA (Al, Ga, In), IIIB (Sc, Y, La), or X=Cr, Fe, Co, Ni, and Rh. Also AgTlO2 and AuTlO2 (but not CuTlO2) present a low-energy delafossite structure. This phase is characterized by XO2 planes separated by flat hexagonal (Cu,Ag,Au) planes. The energy differences between the trigonal and hexagonal phases is always very small (of the order of few meV/atom), sometimes smaller than the precision in our calculations. Thermodynamically stable delafossite structures not present in databases are AgTlO2, AuCrO2, AuFeO2, AuCoO2, AuNiO2, AuTlO2 and AuLaO2.
3.2 Group IA
Hydrogen
| (a) | (b) |
|---|---|
 |
 |
(c)
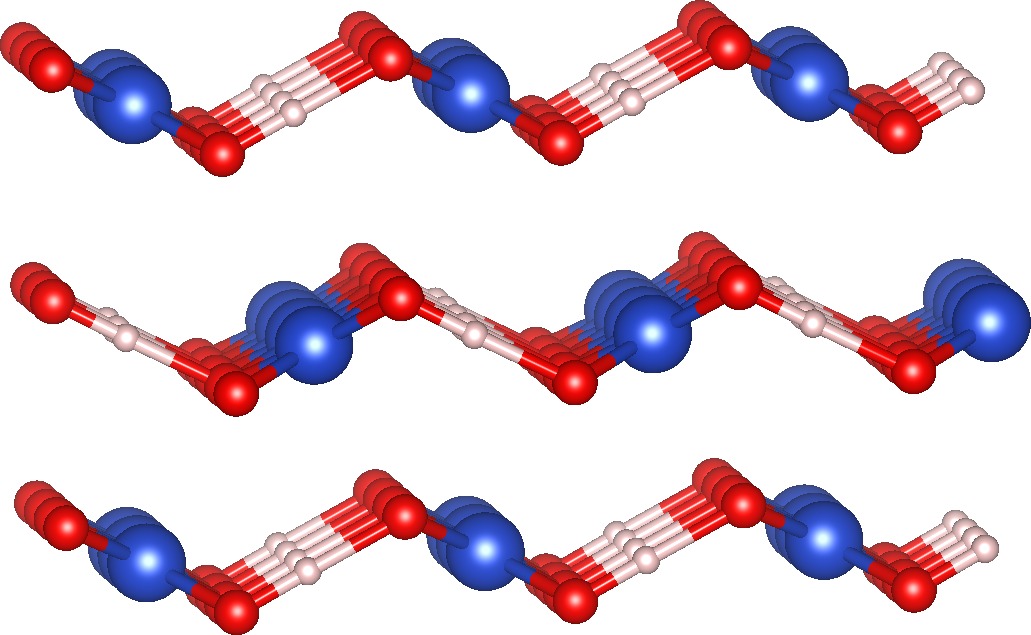
We found a series of distinct structures for (Cu,Ag,Au)HO2 (see Fig. 4). The Cu compound crystallizes in a layered structure (space group 31) composed of zigzag layers of CuHO2. It is just above the convex hull at 8 meV/atom, and is an indirect-gap semiconductor with a PBE gap of 0.5 eV. The Ag compound shows flat layers of Ag (in a square lattice) separated by zigzag lines of OH and O2 dimers. This is a monoclinic (space group 8), metallic, thermodynamically stable phase. Finally, AuHO2 is a low-symmetry structure (space group 2), composed by flat Au layers separated by aligned HO2 units. It is 11 meV/atom above the convex hull and it is an indirect gap semiconductor with a PBE gap of 0.7 eV.
| (a) | (b) |
|---|---|
 |
 |
Lithium
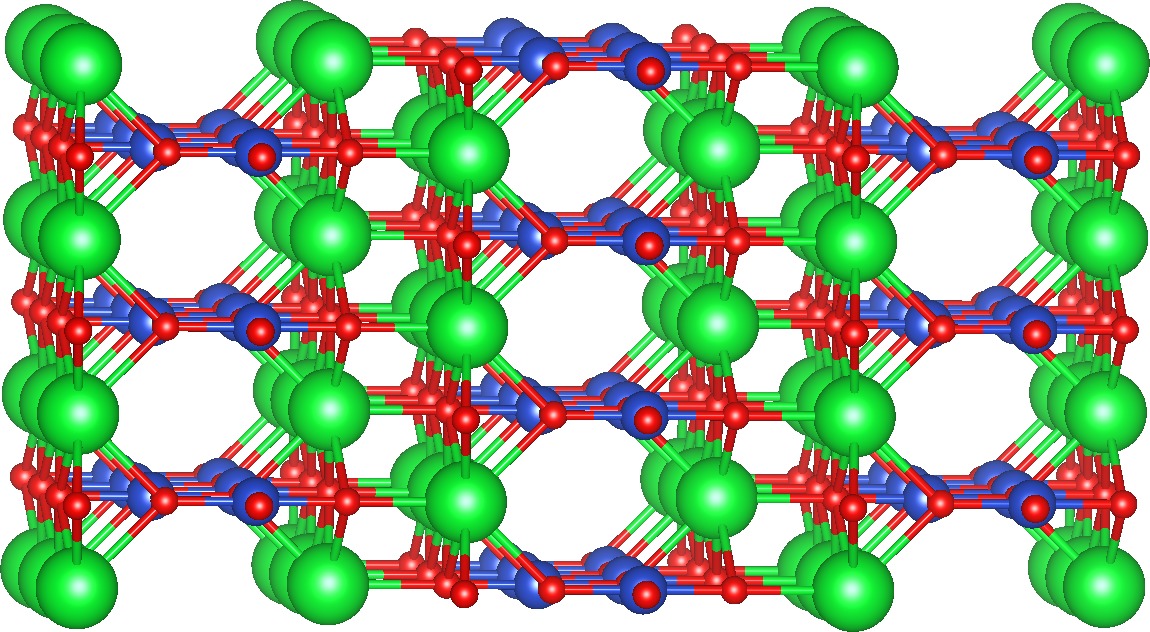
The structures of (Cu,Ag,Au)LiO2 are composed of lines of alternating (Cu,Ag,Au) and Li bonded by O in a three-dimensional arrangement (see Fig. 5). The Ag and Au compounds crystallize in an orthorhombic structure (space group 53). A distortion of this structure leads to the monoclinic phase (space group 12) found in the databases for CuLiO2, and a large distortion of this structure reduces the symmetry to the space group 2 that we find as the ground-state of CuLiO2. All compounds are indirect band-gap semiconductors, with PBE gaps of 0.5 eV (Cu), 0.5 eV (Ag), and 1.1 eV (Au).
Sodium
The compounds containing Na result in two structures very close in energy and competing for the ground-state: the orthorhombic structure (see Fig. 6) that is the structure of the ternary oxides containing K, Rb, and Cs, and the monoclinic phase that is a slightly distorted version of the structure of (Ag, Au)LiO2. For CuNaO2 we find that the former is the ground state (a mere 7 meV per atom below the monoclinic structure present in databases), while for Ag and Au the latter is more stable. These compounds are all indirect-gap semiconductors with PBE gaps of 0.4 eV (Cu), 0.6 eV (Ag), and 1.1 eV (Au).
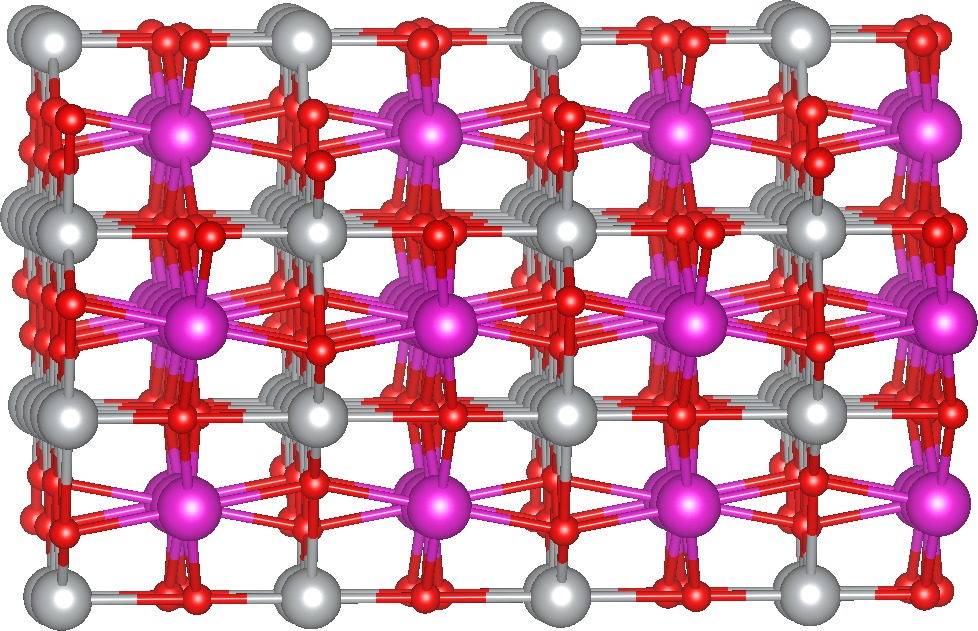
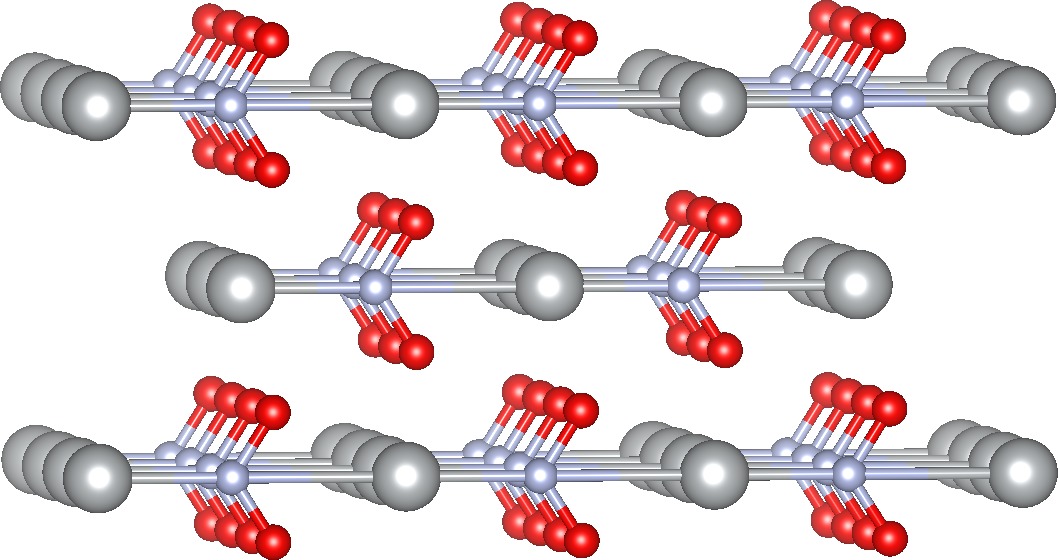
Potassium, Rubidium, Cesium
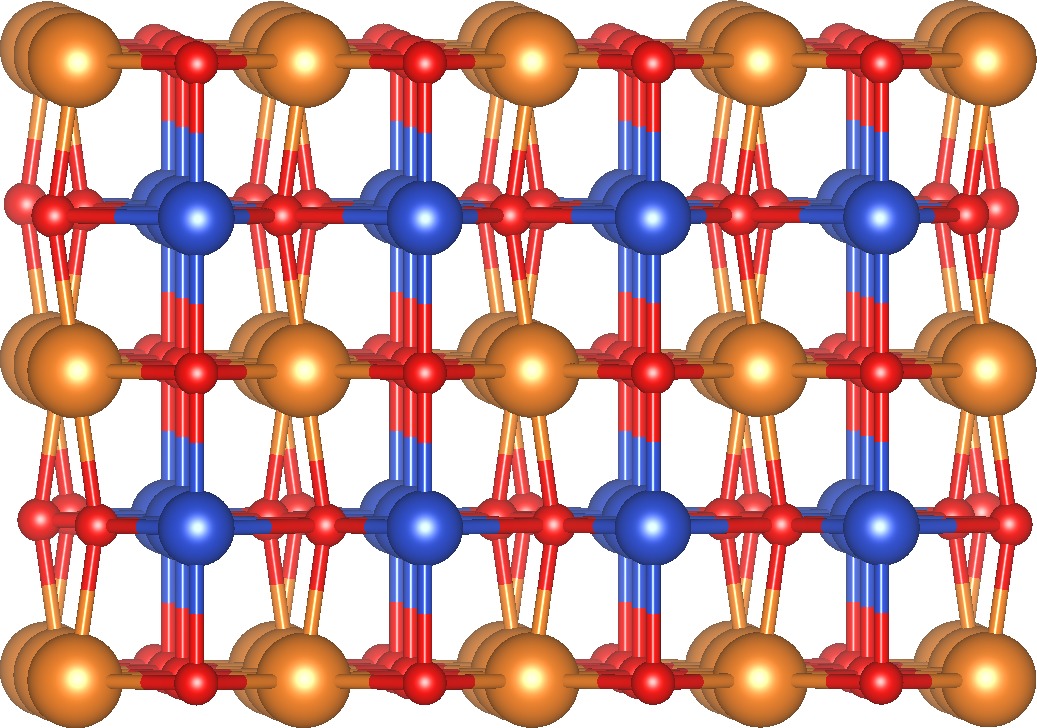
The compounds of the form (Cu,Ag,Au)(K,Rb,Cs)O2 crystallize in an orthorhombic structure (space group 63), characterized by corrugated square planes of (K,Rb,Cs) intercalated with flat stripes of CuO2 where each Cu atom shares four O atoms with two neighboring Cu (see Fig. 6). All these materials are semiconducting with an indirect PBE gap between 0.8 and 1.5 eV that increases with the size of the atoms from Cu to Au and from K to Cs. Note that this is also the lowest energy structure we found for CuNaO2.
3.3 Group IIA
Magnesium
| (a) | (b) |
|---|---|
 |
 |
The element Mg is contained in two ternary oxides with Cu (43 meV/atom from the convex hull) and with Au (36 meV/atom). They are both orthorhombic, but quite dissimilar: the structure CuMgO2 (space group 67) is a distorted variation of the tetragonal unit-cell (space group 123, see Fig. 8) of, e.g., CuCaO2. AuMgO2 is more complicated: its crystal structure (space group 65) is similar to the one of (Ag,Au)LiO2 (see right panel of Fig. 5). Both structures are metallic.
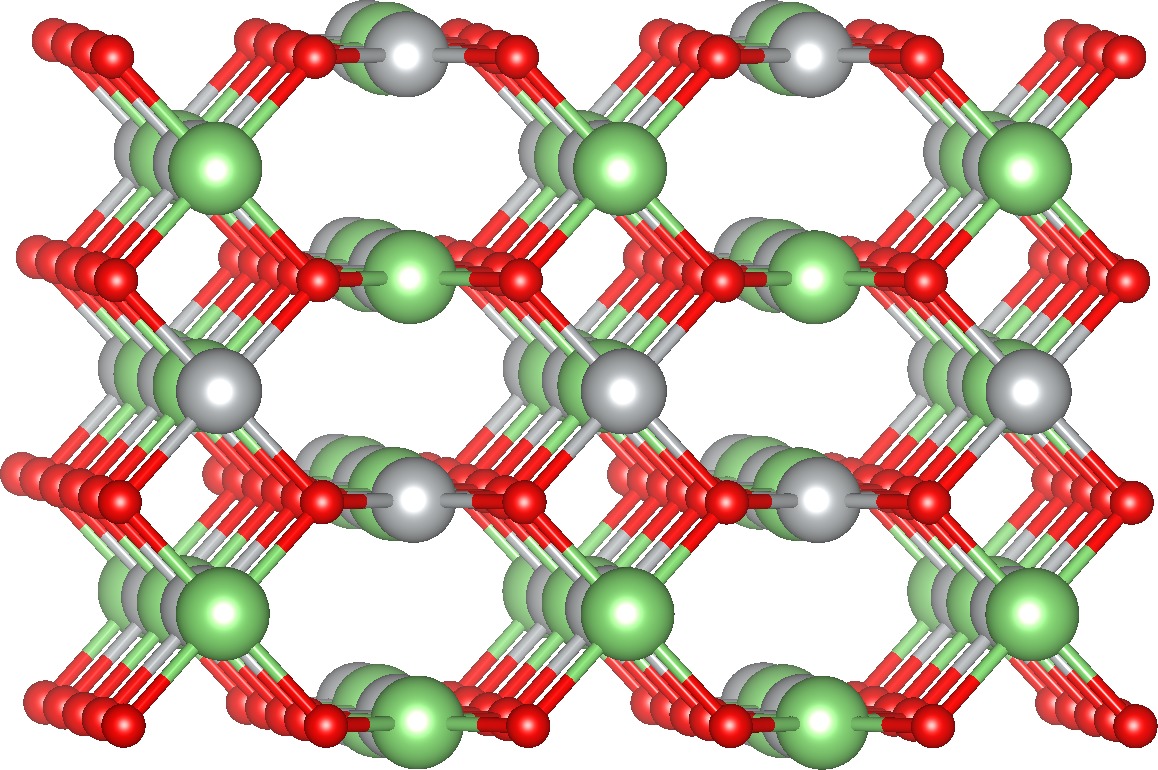
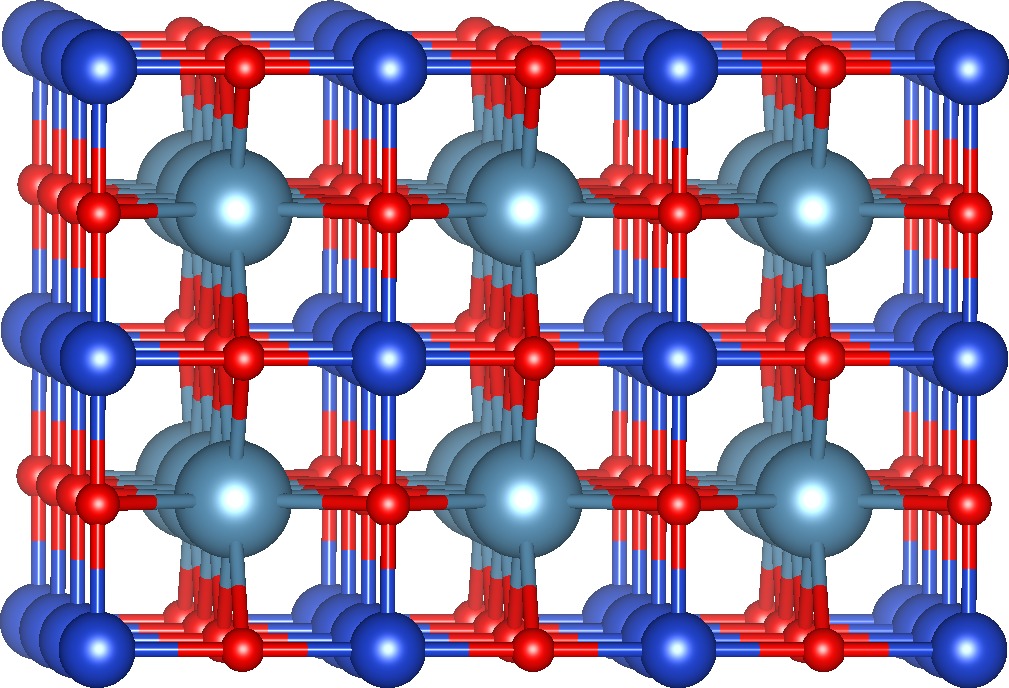
Calcium, Strontium, Barium
| (a) | (b) |
|---|---|
 |
 |
(c)
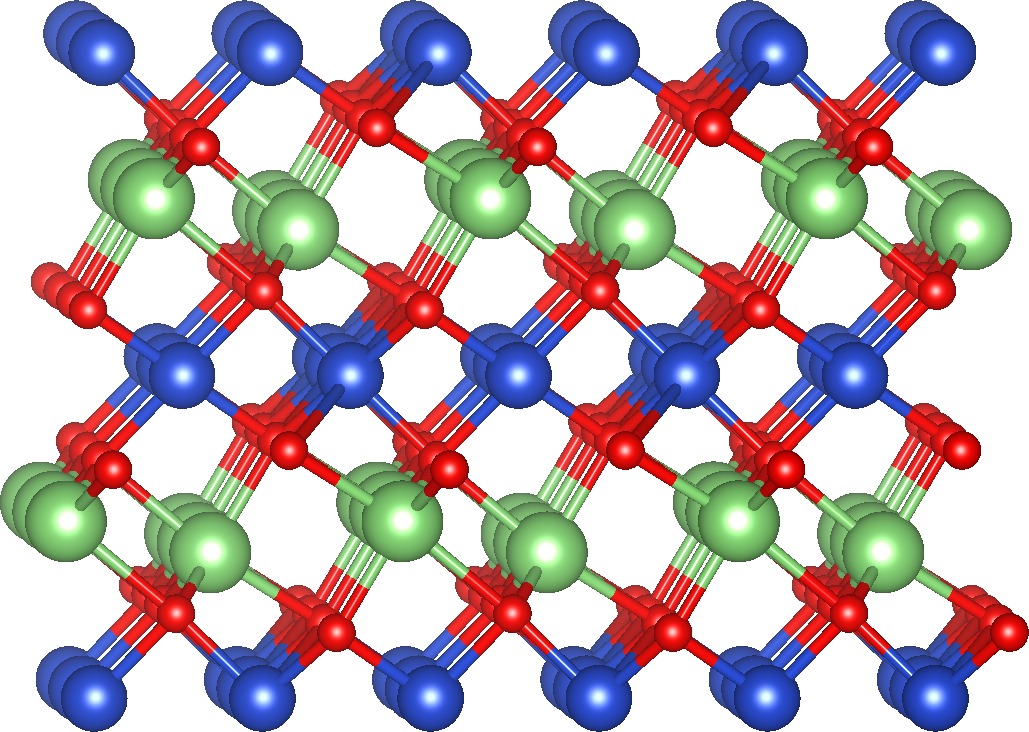
Most of the (Cu,Ag,Au)(Ca,Sr,Ba)O2 ternaries crystallize in a tetragonal lattice with space group 123 (CuCaO2, AgBaO2) or in a distorted version with a monoclinic space group 12 (AgCaO2, AgSrO2, AuSrO2, AuBaO2). These two lattices are represented in the top panels of Fig. 8. On the other hand, CuSrO2 and CuBaO2 have an orthorhombic structure (space group 63) that resembles to some to extent the one of AuMgO2. Most of these materials are metallic, with the exception of the ones that crystallize in the monoclinic phase: AgSrO2 has a PBE gap of 0.6 eV, AuSrO2 of 1.4 eV and AuBaO2 of 1.2 eV. AgCaO2 has zero PBE gap, but the small density of states at the Fermi surface and the results for the other compounds suggest that this may just be due to the well known gap underestimation of the PBE, and that a quasiparticle gap may open up when more sophisticated methods are used. Concerning the thermodynamical stability of these compounds, CuCaO2 is at 3 meV/atom above the hull, while AuSrO2 is at 33 meV and AuBaO2 at 31 meV.
3.4 Transition metals
Vanadium
The monoclinic structure (space group 12) of CuVO2 is very similar to the one of AgPbO2 (see Fig. 12). This compound is has a gap of 1.0 eV and is 11 meV/atom above the convex hull.
Manganese
The oxide phases containing Mn (space group 12) can be seen as distorted delafossites, where the O atoms are slightly displaced from their symmetry positions (CuMnO2, AuMnO2), or with a different stacking (AgMnO2). The Au compound is metallic whereas the Ag and Cu have a PBE gap of 0.4 and 0.1 eV.
Palladium, Platinum
The two Cu compounds with Pd and Pt crystallize in the orthorhombic structure of (Ag,Au)LiO2 (see right panel of Fig. 5). While the Pd compound is thermodynamically stable, CuPtO2 is 6 meV/atom above the convex hull. Both are metallic. On the other hand, the two Ag phases have a monoclinic structure (space group 10) similar to AuPbO2 (see Fig. 12), but where the Ag planes are not distorted (increasing the symmetry of the system). AgPdO2 is stable with a small PBE gap of 0.1 eV. AgPtO2 has an indirect gap of 0.3 eV, lying 19 meV above the hull. Finally, AuPdO2 it is a metallic distorted delafossite structure (space group 12) similar to the one of (Cu,Ag,Au)BiO2 (see Fig. 13).
Copper, Silver, Gold
CuAgO2 has a orthorhombic lattice characterized by square flat layers of Ag intercalated with ribbons of CuO2. The main difference to the structure of CuPbO2 (see Fig. 12) is that the four O atoms are shared in this case with two Cu neighbors and not with four. On the other hand, CuAuO2 crystallizes in a monoclinic structure (space group 12) very similar to the Au delafossite structure, with Au hexagonal flat planes separated by CuO2 layers, but where the O atoms are slightly displaced thereby reducing the symmetry from trigonal to monoclinic. This is, in fact, the structure that can be found in the databases for CuAgO2. Finally, AgAuO2 can again be seen as a distorted Au delafossite, leading to a monoclinic phase with space group 14. While CuAgO2 and CuAuO2 are metallic, AgAuO2 is an indirect gap semiconductor with a PBE gap of 0.6 eV.
| (a) | (b) |
|---|---|
 |
 |
Cadmium, Mercury
CuHgO2 has the same monoclinic structure as CuAuO2, and so it can be seen as a deformed Hg delafossite. It is a metal and it lies 43 meV/atom above the convex hull of thermodynamic stability. On the other hand, AgCdO2 crystallizes in a deformed version (see Fig. 10) of the tetragonal structure of, e.g., CuCaO2 (see Fig. 8). This is a metal, 23 meV/atom above the hull. The next compound, AgHgO2 has as ground state a low symmetry structure (space group 2, see right panel of Fig. 10) that can be seen as a small distortion of the orthorhombic phase of (Ag,Au)LiO2 (see right panel of 5). This is a metal, 27 meV above the hull. Finally, AuCdO2 has a similar crystal structure as AgHgO2, also with space group 2, but with the metal atoms forming lines of Au and of Cd (i.e., they are not alternating). This is a quasi-direct gap semiconductor with a PBE gap of 0.9 eV.
Thallium
The ground-state of CuTlO2, in contrast to the Ag and Au compounds that crystallize in the delafossite structure, is a monoclinic lattice (space group 11), characterized by hexagonal channels made of Tl filled with flat stripes of CuO2. This phase is an indirect band-gap semiconductor with a PBE gap of 0.4 eV. A (metallic) delafossite structure is also present as a meta-stable phase, around 14 meV/atom higher than the ground-state.
| (a) | (b) |
|---|---|
 |
 |
(c)
Lead
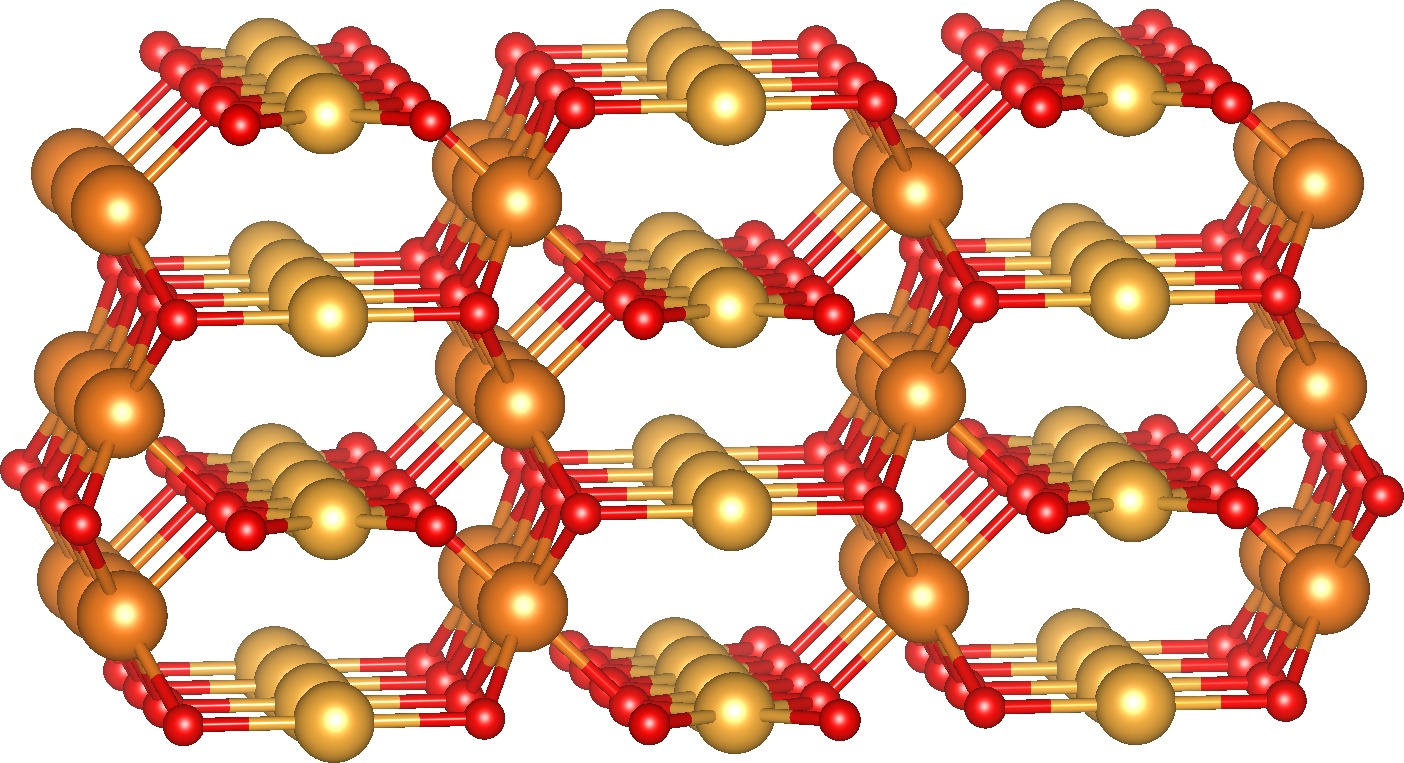
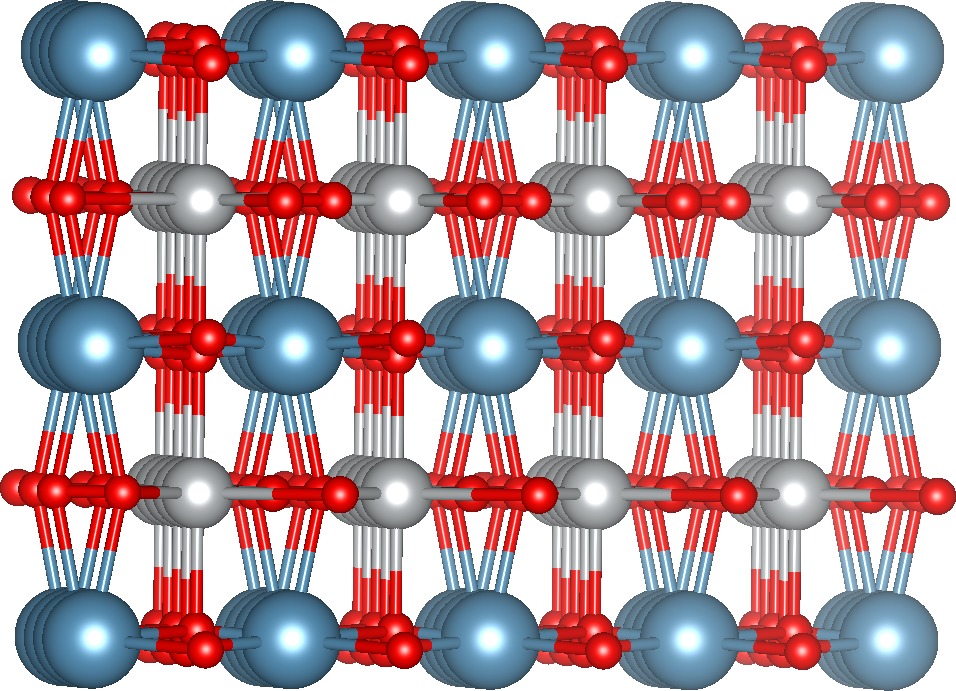
(Cu,Ag,Au)PbO2 oxides are characterized by Pb planes separated by (Cu,Ag,Au)O2 layers (see Fig. 12). For CuPbO2, Pb forms a square lattice while each Cu shares four O atoms with four Cu neighbors, while for the Ag compound, Pb forms a hexagonal lattice with isolated AgO2 units in between. Finally, the AuPbO2 structure is somewhat intermediate between the Cu and Ag compounds: the Pb layers form a distorted hexagonal lattice and each Au has two O atoms and shares an extra two. The Cu phase (space group 74) is metallic and 43 meV above the convex hull, the Ag compound (space group 12) is a 0.3 eV semiconductor and 32 meV above the hull, and finally Au forms a semiconducting phase (space group 2) with an indirect PBE gap of 0.4 eV and it is 15 meV above the convex hull.
Bismuth
The ternary oxides with Bi are indirect-gap semiconducting phases with PBE gaps of 1.0 eV (Cu), 1.4 eV (Ag), and 1.3 eV (Au). Their monoclinic space group 11 corresponds to an atomic arrangement that can be seen as a distorted delafossite, with a dimerization of the chains of Ag and BiO2 (see Fig. 13). The delafossite structure remains, however, a meta-stable phase of this composition, around 40 meV/atom higher than the ground-state. Although not strictly stable thermodynamically, these structures are remarkably close to the convex hull at 8 meV/atom (Cu), 3 meV/atom (Ag), and 40 meV/atom (Au).
3.5 Halogens
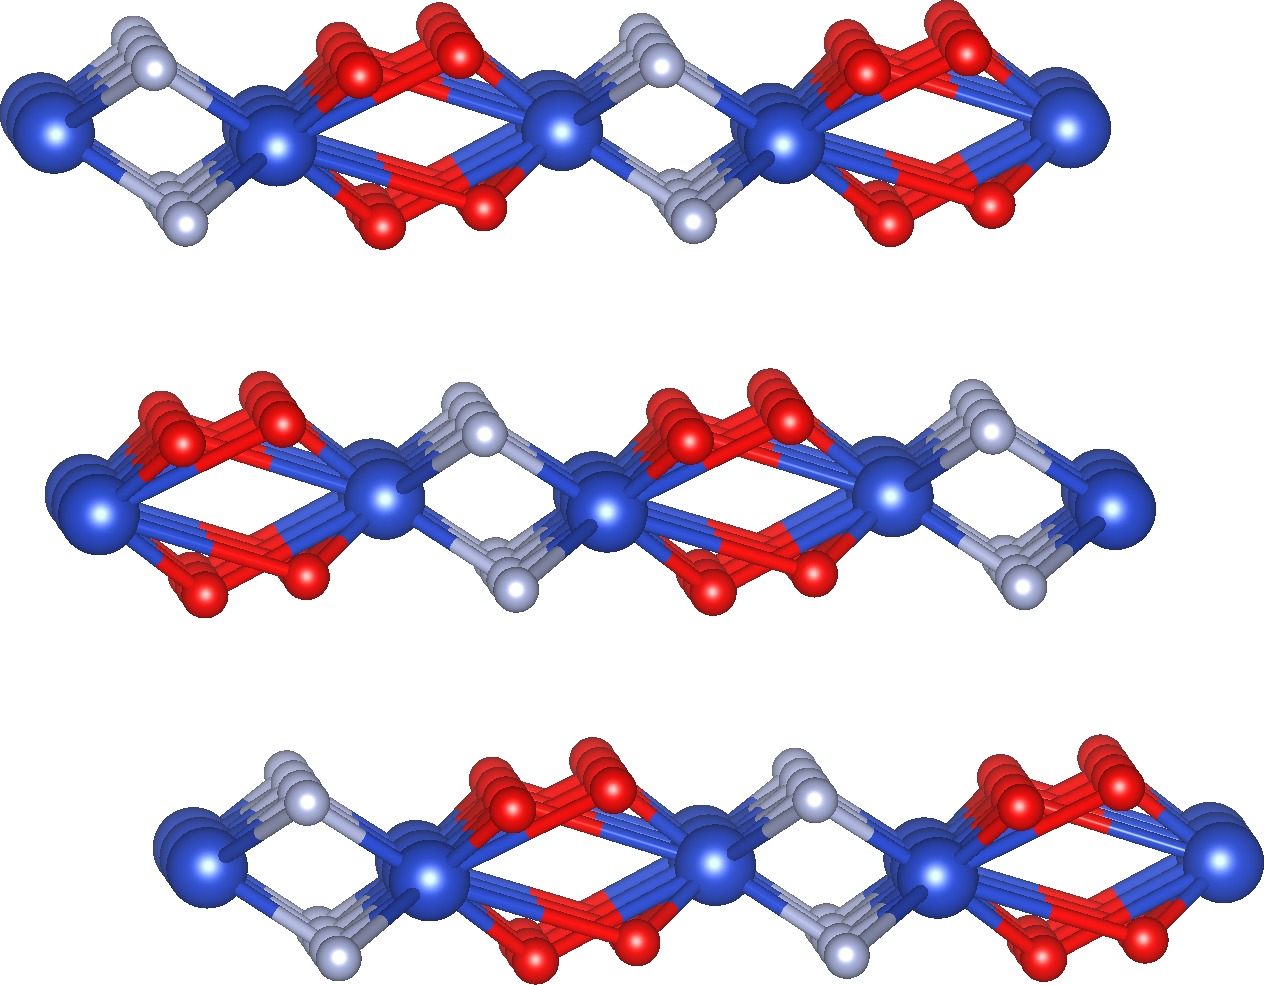
Fluorine
(Cu,Ag,Au)FO2 compounds crystallize in a monoclinic lattice (space group 4) characterized by (Cu,Ag,Au)FO2 layers (see Fig. 14). These are all semiconducting structures, with PBE electronic gaps of 0.8 eV (CuFO2), 0.6 eV (AgFO2), and 1.1 eV (AuFO2).
| (a) | (b) |
|---|---|
 |
 |
(c)

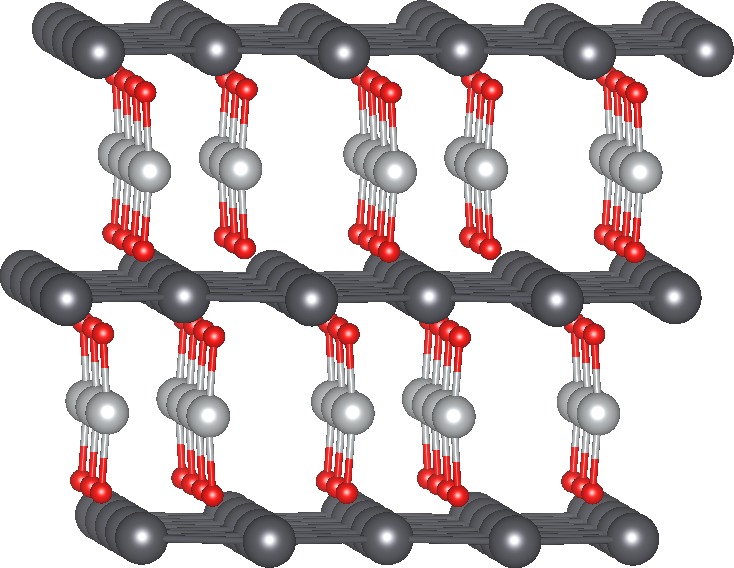
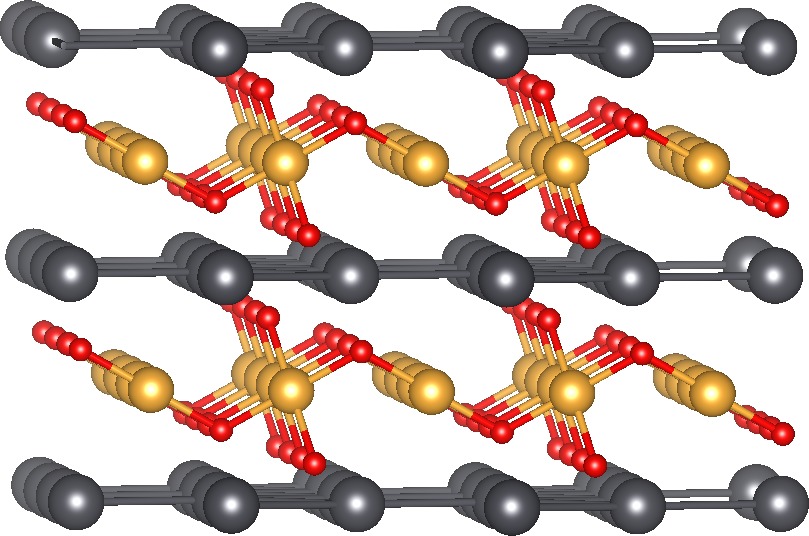
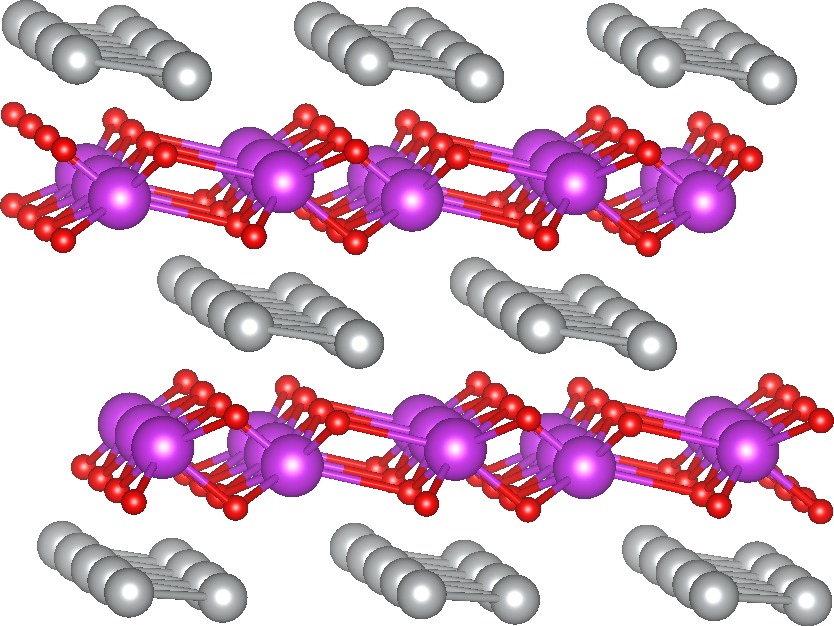
Chlorine, Bromine
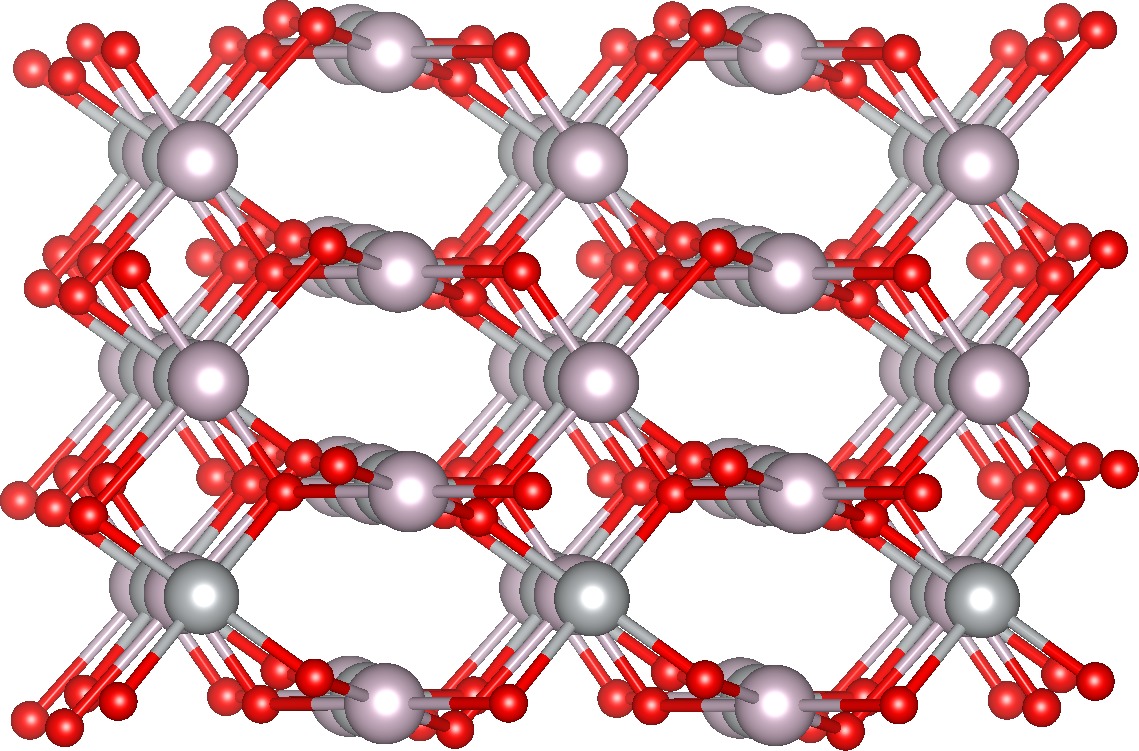
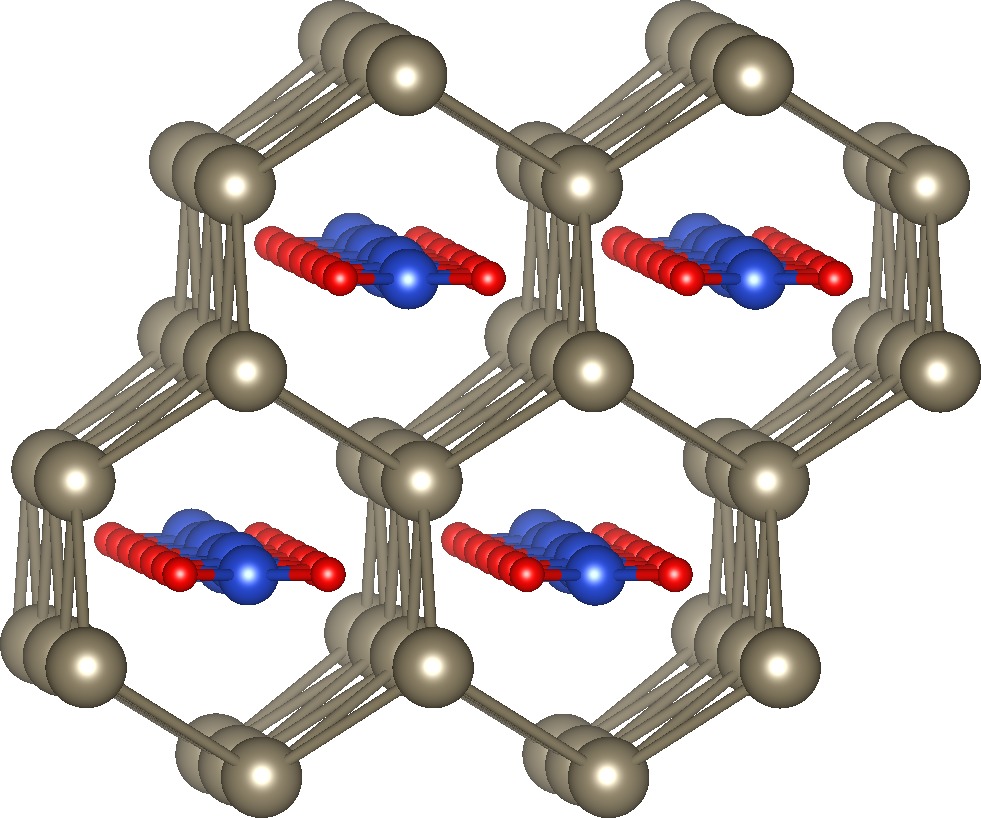
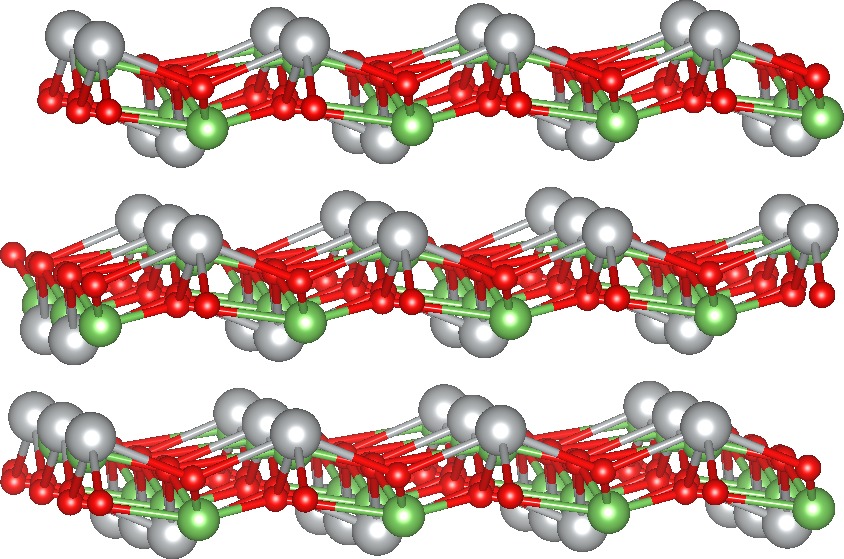
Cu(Cl,Br)O2 compounds crystallize in a low symmetry triclinic (space group 1) lattice (see panel c of Fig. 15). This has some similarities to the monoclinic structure of (Cu,Ag,Au)FO2 (see Fig. 14), in the sense that they share the same CuO2 subunits. However, in the latter structure each Cu shares four F with four neighboring Cu atoms, while in the former each Cu only shares two (Cl,Br) with two other Cu. These are thermodynamically stable structures, that are indirect gap semiconductors with PBE gap of 0.8 (CuClO2) and 0.9 (CuBrO2).
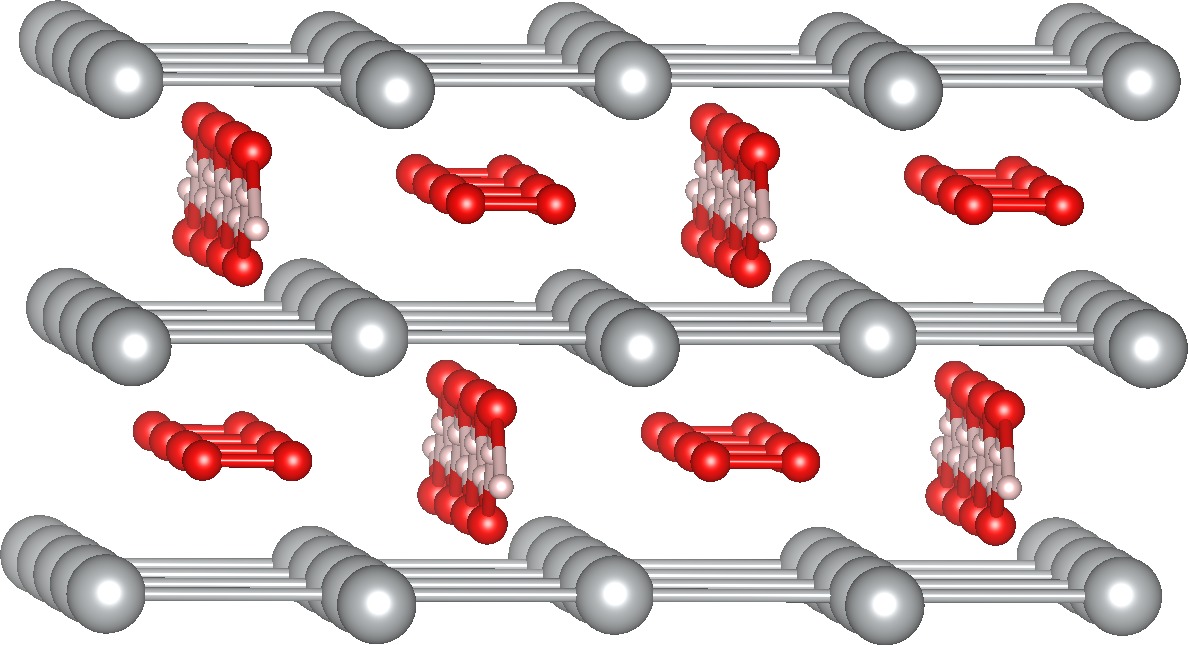
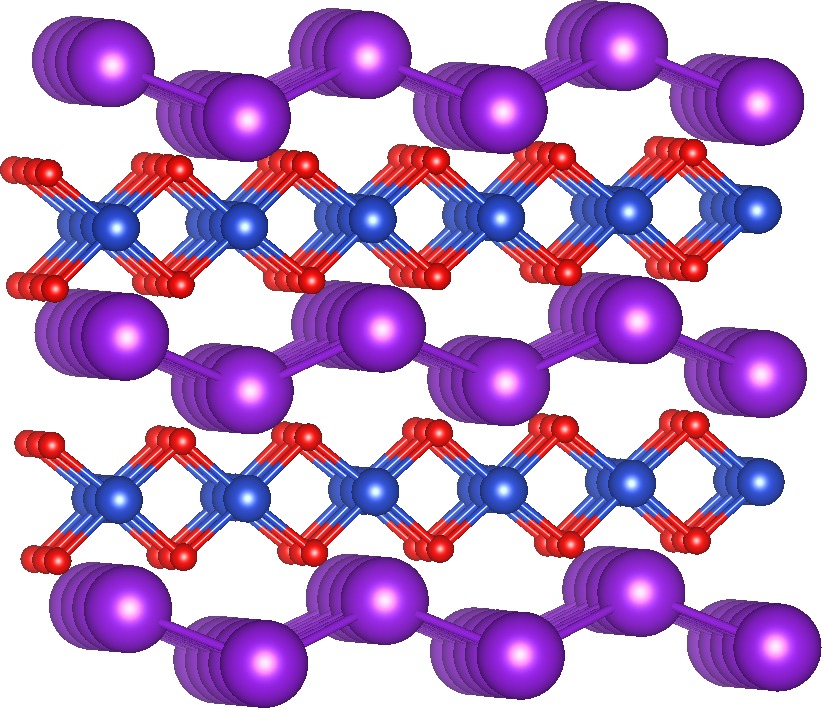
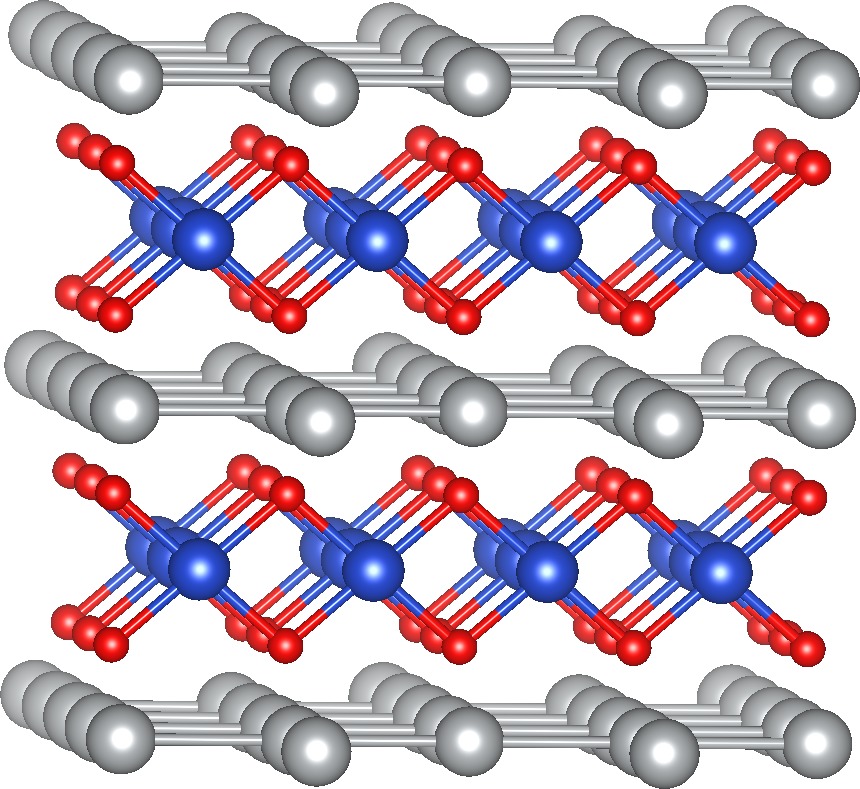
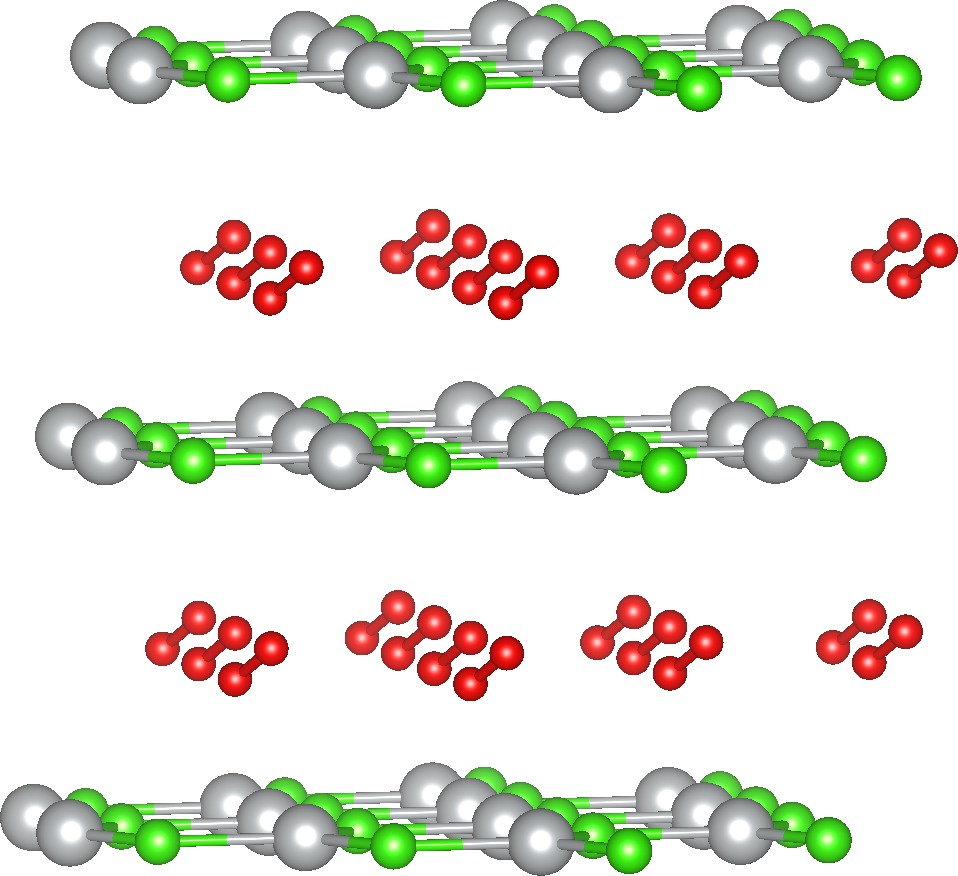
Ag(Cl,Br)O2 structures are fundamentally different from all other we found in our study. It is composed of flat hexagonal layers of Ag(Cl,Br), separated by a layer of O2 molecules (see panel a of Fig. 15), forming a low-symmetry triclinic lattice (space group 1). These turn out to be semiconductors with PBE gaps of 0.6 eV (AgClO2) and 0.7 eV (AgBrO2).
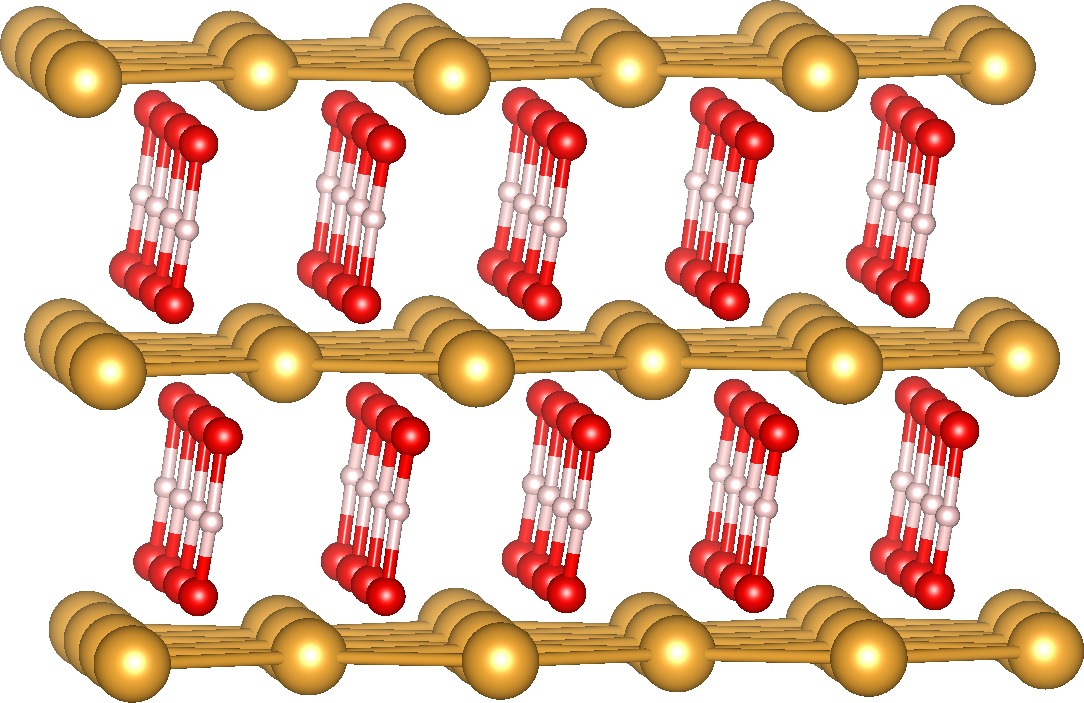
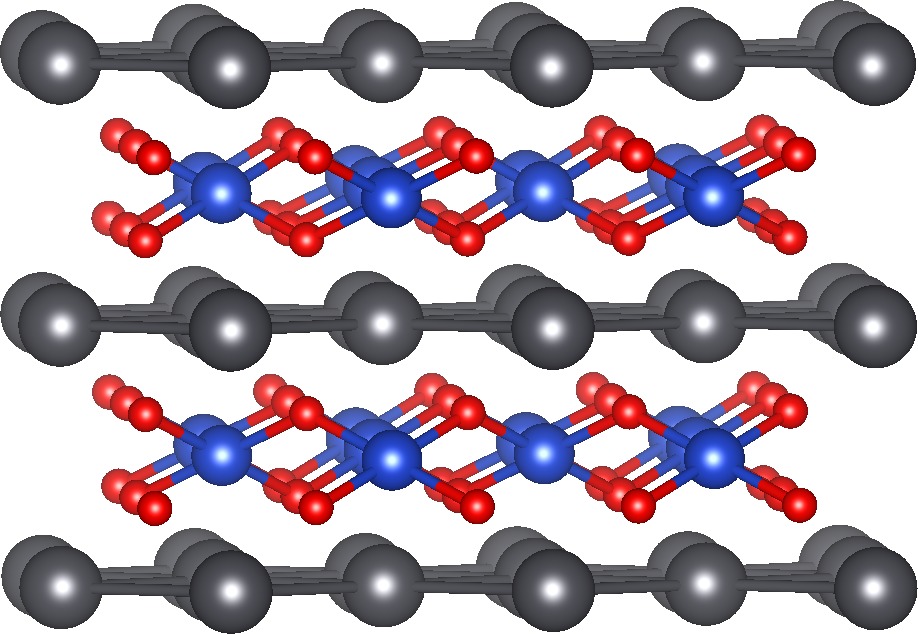
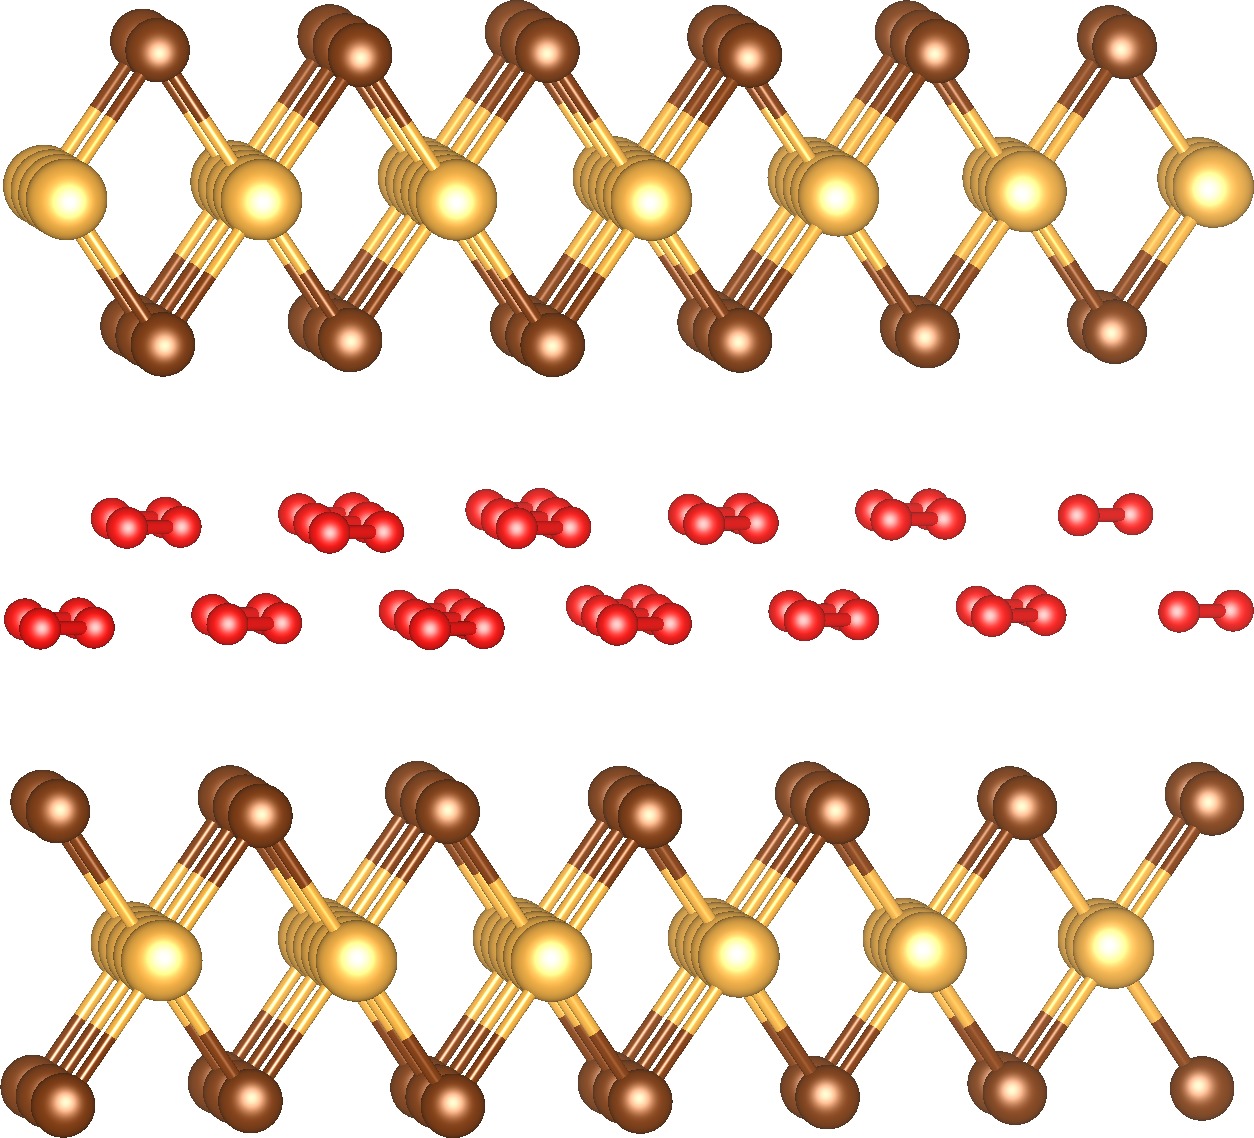
Au(Cl,Br)O2 compounds crystallize in a lattice that is composed of Au(Cl,Br) layers intercalated with O2 molecules (see panel b of Fig. 15). However, in this case the Au(Cl,Br) are not flat, but form zigzag stripes with each Au bonded to two (Cl,Br) and vice-versa, leading to a monoclinic lattice (space group 15). AuClO2 is a semiconductor with an indirect gap of 0.3 eV, while AuBrO2 turns out to be a metal with the PBE.
3.6 Others
Boron
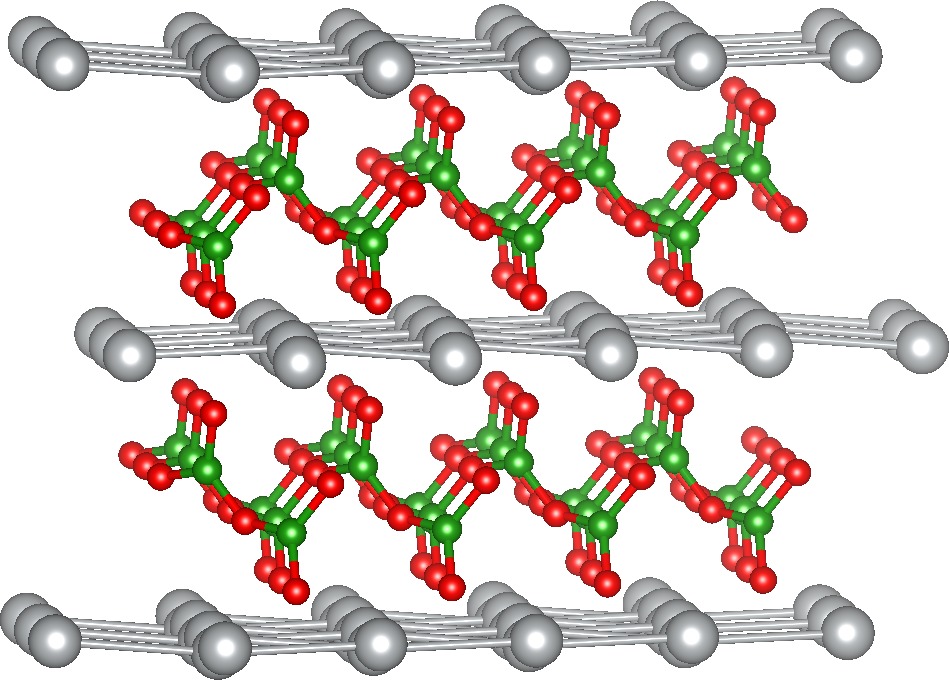
AgBO2 has a monoclinic structure (space group 9) composed by slightly buckled Ag layers, separated by BO2 chains, where each B is connected to three O, two of which are shared with two adjacent B atoms (see Fig. 16). Note that this is the same structure we had previously found for CuBO2 28. AgBO2 is 33 meV/atom above the hull, and it is a semiconductor with a PBE quasi-direct gap of 1.4 eV.
| (a) | (b) |
|---|---|
 |
 |
Nitrogen
The lowest energy phase of AgNO2 that we found is a monoclinic structure (space group 5), lying 37 meV/atom above the hull. It is composed of lines of alternating Ag and NO2. This is a deformation of the orthorhombic structure (space group 44, see Fig. 17) that can be found in the databases, and that we found to be 5 meV/atom above the ground state. Both structures are indirect gap semiconductors, with PBE gaps of 1.4 eV (monoclinic) and 1.8 eV (orthorhombic).
Arsenic
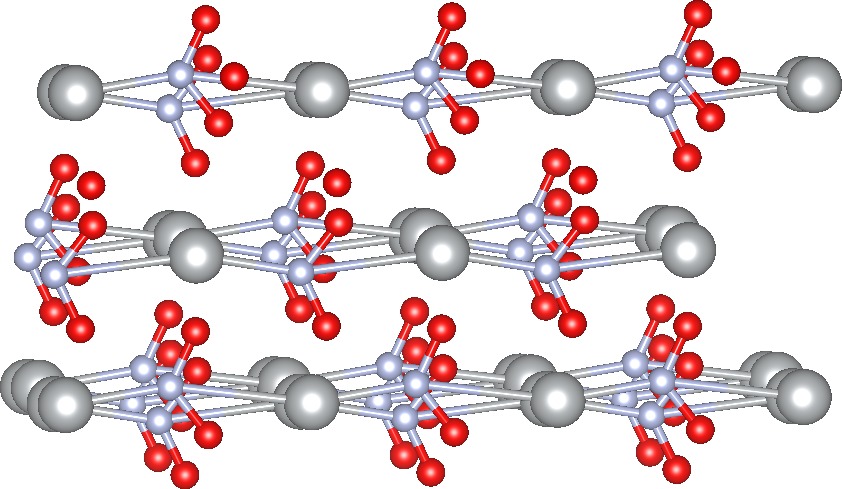
Also for AgAsO2 we found a monoclinic structure (space group 5, see Fig. 18), composed of corrugated planes of AgAsO2. This phase is 38 meV/atom above the hull, with a PBE indirect gap of 2.4 eV.
4 Conclusion
In summary, we performed structural prediction runs for 183 oxide phases containing Cu, Ag, and Au. From our runs we predict that there are 81 thermodynamically stable or quasi-stable (within 20 meV) compositions, out of which only 36 are included in available databases. These numbers should be compared to the 3 systems that were found in a previous study using high-throughput techniques combined with machine learning. Nevertheless, we believe that structural prediction should not be seen as a competitor of more traditional high-throughput techniques. In fact, both methods complement each other, and both should be used in synergy to speed up the experimental process of materials discovery. We tried to do the first steps in this direction, by combining structural prediction and a search based on prototype structures.
The subset of oxides that we explored include delafossite CuAlO2, the first delafossite p-type transparent conductive oxide. By calculating the band gaps and hole effective masses of the new stable compounds that we identified, we could reveal some potential candidates to outperform CuAlO2 as p-type transparent conductor. These few compounds deserve in our mind further consideration, both from an experimental point of view (e.g., synthesis, structural and electronic characterization) and a theoretical point of view (e.g., study of dopability, more accurate band structure and transport calculations).
Certainly, structural prediction is complex and numerically expensive. However, with our results we aim at demonstrating that, using modern supercomputers, it is possible to use such techniques to investigate a large number of chemical compositions, paving the way for a large scale search for new materials.
SB and MALM acknowledge support from the French ANR (ANR-12-BS04-0001-02). Financial support provided by the Swiss National Science Foundation is gratefully acknowledged. Computational resources were provided by GENCI (project x2013096017) in France and the PRACE-3IP project (FP7 RI-312763) resource Archer based in Scotland at the University of Edinburgh.
Crystallographic Information Files for the crystal structures studied in this work.
References
- Bergerhoff and Brown 1987 Bergerhoff, G.; Brown, I. In Crystallographic Databases; Allen, F., Ed.; International Union of Crystallography: Chester, 1987
- Jain et al. 2013 Jain, A.; Ong, S. P.; Hautier, G.; Chen, W.; Richards, W. D.; Dacek, S.; Cholia, S.; Gunter, D.; Skinner, D.; Ceder, G.; Persson, K. A. APL Materials 2013, 1, –
- Saal et al. 2013 Saal, J.; Kirklin, S.; Aykol, M.; Meredig, B.; Wolverton, C. JOM 2013, 65, 1501–1509
- Curtarolo et al. 2012 Curtarolo, S.; Setyawan, W.; Wang, S.; Xue, J.; Yang, K.; Taylor, R. H.; Nelson, L. J.; Hart, G. L.; Sanvito, S.; Buongiorno-Nardelli, M.; Mingo, N.; Levy, O. Computational Materials Science 2012, 58, 227 – 235
- Ceder 2010 Ceder, G. MRS Bulletin 2010, 35, 693–701
- Chen et al. 2012 Chen, H.; Hautier, G.; Jain, A.; Moore, C.; Kang, B.; Doe, R.; Wu, L.; Zhu, Y.; Tang, Y.; Ceder, G. Chemistry of Materials 2012, 24, 2009–2016
- Wang et al. 2011 Wang, S.; Wang, Z.; Setyawan, W.; Mingo, N.; Curtarolo, S. Phys. Rev. X 2011, 1, 021012
- Opahle et al. 2013 Opahle, I.; Parma, A.; McEniry, E. J.; Drautz, R.; Madsen, G. K. New Journal of Physics 2013, 15, 105010
- Carrete et al. 2014 Carrete, J.; Mingo, N.; Wang, S.; Curtarolo, S. Advanced Functional Materials 2014, 7427–7432
- Yu and Zunger 2012 Yu, L.; Zunger, A. Phys. Rev. Lett. 2012, 108, 068701
- Yu et al. 2013 Yu, L.; Kokenyesi, R. S.; Keszler, D. A.; Zunger, A. Advanced Energy Materials 2013, 3, 43–48
- Hautier et al. 2013 Hautier, G.; Miglio, A.; Ceder, G.; Rignanese, G.-M.; Gonze, X. Nat Commun 2013, 4
- Hautier et al. 0 Hautier, G.; Miglio, A.; Waroquiers, D.; Rignanese, G.-M.; Gonze, X. Chemistry of Materials 0, 0, null
- Morgan et al. 2005 Morgan, D.; Ceder, G.; Curtarolo, S. Meas. Sci. Technol. 2005, 16, 296
- Hautier et al. 2011 Hautier, G.; Fischer, C.; Ehrlacher, V.; Jain, A.; Ceder, G. Inorganic Chemistry 2011, 50, 656–663, PMID: 21142147
- Fujimura et al. 2013 Fujimura, K.; Seko, A.; Koyama, Y.; Kuwabara, A.; Kishida, I.; Shitara, K.; Fisher, C. A. J.; Moriwake, H.; Tanaka, I. Advanced Energy Materials 2013, 3, 980–985
- Pilania et al. 2013 Pilania, G.; Wang, C.; Jiang, X.; Rajasekaran, S.; Ramprasad, R. Sci. Rep. 2013, 3, Article
- Hautier et al. 2010 Hautier, G.; Fischer, C. C.; Jain, A.; Mueller, T.; Ceder, G. Chemistry of Materials 2010, 22, 3762–3767
- Oganov and Glass 2006 Oganov, A. R.; Glass, C. W. J. of Chem. Phys. 2006, 124, 244704
- Curtarolo et al. 2005 Curtarolo, S.; Kolmogorov, A. N.; Cocks, F. H. Calphad 2005, 29, 155 – 161
- Wang et al. 2010 Wang, Y.; Lv, J.; Zhu, L.; Ma, Y. Phys. Rev. B 2010, 82, 094116
- Pickard and Needs 2011 Pickard, C. J.; Needs, R. J. J. Phys.: Condens. Matter 2011, 23, 053201
- Goedecker 2004 Goedecker, S. J. Chem. Phys. 2004, 120, 9911–9917
- Amsler and Goedecker 2010 Amsler, M.; Goedecker, S. J. Chem. Phys. 2010, 133, –
- Amsler et al. 2012 Amsler, M.; Flores-Livas, J. A.; Lehtovaara, L.; Balima, F.; Ghas emi, S. A.; Machon, D.; Pailhès, S.; Willand, A.; Caliste, D.; Botti, S.; San Miguel, A.; Goedecker, S.; Marques, M. A. L. Phys. Rev. Lett. 2012, 108, 065501
- Huan et al. 2013 Huan, T. D.; Amsler, M.; Marques, M. A. L.; Botti, S.; Willand, A.; Goedecker, S. Phys. Rev. Lett. 2013, 110, 135502
- Amsler et al. 2013 Amsler, M.; Botti, S.; Marques, M. A. L.; Goedecker, S. Phys. Rev. Lett. 2013, 111, 136101
- Cerqueira et al. 2013 Cerqueira, T.; Sarmiento-Pérez, R.; Trani, F.; Amsler, M.; Goedecker, S.; Marques, M.; Botti, S. MRS Communications 2013, 3, 157–160
- Flores-Livas et al. 2012 Flores-Livas, J. A.; Amsler, M.; Lenosky, T. J.; Lehtovaara, L.; Botti, S.; Marques, M. A. L.; Goedecker, S. Phys. Rev. Lett. 2012, 108, 117004
- Sarmiento-Pŕez et al. 2013 Sarmiento-Pŕez, R.; Cerqueira, T. F.; Valencia-Jaime, I.; Amsler, M.; Goedecker, S.; Botti, S.; Marques, M. A. L.; Romero, A. H. New Journal of Physics 2013, 15, 115007
- Kawazoe et al. 1997 Kawazoe, H.; Yasukawa, M.; Hyodo, H.; Kurita, M.; Yanagi, H.; Hosono, H. Nature 1997, 389, 939
- Yanagi et al. 2001 Yanagi, H.; Hase, T.; Ibuki, S.; Ueda, K.; Hosono, H. Appl. Phys. Lett. 2001, 78, 1583–1585
- Yanagi et al. 2002 Yanagi, H.; Ueda, K.; Ohta, H.; Orita, M.; Hirano, M.; Hosono, H. Solid State Comm. 2002, 121, 15–17
- Ueda et al. 2001 Ueda, K.; Hase, T.; Yanagi, H.; Kawazoe, H.; Hosono, H.; Ohta, H.; Orita, M.; Hirano, M. J. Appl. Phys. 2001, 89, 1790–1793
- Nagarajan et al. 2001 Nagarajan, R.; Duan, N.; Jayaraj, M.; Li, J.; Vanaja, K.; Yokochi, A.; Draeseke, A.; Tate, J.; Sleight, A. International Journal of Inorganic Materials 2001, 3, 265 – 270, University of California Santa Barbara Conference papers
- Sheng et al. 2006 Sheng, S.; Fang, G.; Li, C.; Xu, S.; Zhao, X. physica status solidi (a) 2006, 203, 1891–1900
- Nagarajan et al. 2001 Nagarajan, R.; Draeseke, A. D.; Sleight, A. W.; Tate, J. Journal of Applied Physics 2001, 89, 8022–8025
- Kudo et al. 1998 Kudo, A.; Yanagi, H.; Hosono, H.; Kawazoe, H. Applied Physics Letters 1998, 73, 220–222
- Ueda et al. 2000 Ueda, K.; Inoue, S.; Hirose, S.; Kawazoe, H.; Hosono, H. Applied Physics Letters 2000, 77, 2701–2703
- Hohenberg and Kohn 1964 Hohenberg, P.; Kohn, W. Phys. Rev. 1964, 136, B864–71
- Kohn and Sham 1965 Kohn, W.; Sham, L. J. Phys. Rev. 1965, 140, A1133–8
- Blöchl 1994 Blöchl, P. Phys. Rev. B 1994, 50, 17953
- Kresse and Furthmüller 1996 Kresse, G.; Furthmüller, J. Computational Materials Science 1996, 6, 15 – 50
- Kresse and Furthmüller 1996 Kresse, G.; Furthmüller, J. Phys. Rev. B 1996, 54, 11169–11186
- Perdew et al. 1996 Perdew, J. P.; Burke, K.; Ernzerhof, M. Phys. Rev. Lett. 1996, 77, 3865–3868
- Anisimov et al. 1991 Anisimov, V. I.; Zaanen, J.; Andersen, O. Phys. Rev. B 1991, 44, 943
- Ong et al. 2013 Ong, S. P.; Richards, W. D.; Jain, A.; Hautier, G.; Kocher, M.; Cholia, S.; Gunter, D.; Chevrier, V. L.; Persson, K. A.; Ceder, G. Computational Materials Science 2013, 68, 314 – 319
- Stokes and Hatch 2005 Stokes, H. T.; Hatch, D. M. Journal of Applied Crystallography 2005, 38, 237–238
- Madsen and Singh 2006 Madsen, G. K.; Singh, D. J. Computer Physics Communications 2006, 175, 67 – 71
- Vidal et al. 2010 Vidal, J.; Trani, F.; Bruneval, F.; Marques, M. A. L.; Botti, S. Phys. Rev. Lett. 2010, 104, 136401
- Trani et al. 2010 Trani, F.; Vidal, J.; Botti, S.; Marques, M. A. L. Phys. Rev. B 2010, 82, 085115