Morphological evolution in situ: Disk-dominated cluster red sequences at
Abstract
We have carried out a joint photometric and structural analysis of red sequence galaxies in four clusters at a mean redshift of using optical and near-IR HST imaging reaching to at least 3 magnitudes fainter than . As expected, the photometry and overall galaxy sizes imply purely passive evolution of stellar populations in red sequence cluster galaxies. However, the morphologies of red sequence cluster galaxies at these redshifts show significant differences to those of local counterparts. Apart from the most massive galaxies, the high redshift red sequence galaxies are significantly diskier than their low redshift analogues. These galaxies also show significant colour gradients, again not present in their low redshift equivalents, most straightforwardly explained by radial age gradients. A clear implication of these findings is that red sequence cluster galaxies originally arrive on the sequence as disk-dominated galaxies whose disks subsequently fade or evolve secularly to end up as high Sérsic index early-type galaxies (classical S0s or possibly ellipticals) at lower redshift. The apparent lack of growth seen in a comparison of high and low redshift red sequence galaxies implies that any evolution is internal and is unlikely to involve significant mergers. While significant star formation may have ended at high redshift, the cluster red sequence population continues to evolve (morphologically) for several Gyrs thereafter.
keywords:
galaxies: evolution — galaxies: clusters — galaxies: luminosity function, mass function — galaxies: clusters: general — galaxies: elliptical and lenticular, cD1 Introduction
The common picture of galaxy populations in clusters is that they are remarkably homogeneous in nearby as well as distant objects, out to at least, if not beyond. The locally measured luminosity functions and colour-magnitude relations show little or no significant variation as a function of gross cluster properties (De Propris et al., 2003a; Lopez-Cruz et al., 2004). There is no clear evidence for evolution in the typical near-IR luminosity (and therefore stellar mass) of galaxies to , other than pure passive evolution of their stellar populations (De Propris et al., 1999, 2007; Andreon, 2006, 2008; Muzzin et al., 2008; Mancone et al., 2010, 2012) at and brighter, implying no significant growth of cluster galaxies over the past 2/3 of the Hubble time. Similarly, distant clusters studied thus far are usually dominated by red sequence galaxies with colours consistent with passively evolved local samples, having high formation redshifts and short (Gyr) star formation timescales (Kodama & Arimoto, 1997; Blakeslee et al., 2003; Mei et al., 2006a, b, 2009, 2012). This argues for a model where cluster galaxies assembled most of their stellar content at early times and with their stellar populations formed over short periods (e.g. Pipino & Matteucci, 2004).
Unlike old early-type field galaxies at similar redshifts (Longhetti et al., 2007; Cimatti et al., 2008; Damjanov et al., 2009; Whitaker et al., 2012; Cassata et al., 2013; Williams et al., 2014) which are more compact than similarly massive low redshift counterparts (Shen et al., 2003), the sizes of red cluster galaxies also do not appear to have evolved appreciably (Cerulo et al., 2014; Delaye et al., 2014; Jørgensen & Chiboucas, 2013; Jørgensen et al., 2014) since high redshift. Consequently, the red sequence cluster galaxies have been presumed to be ”red and dead”, at least as far as their star formation activity and growth is concerned.
More recent work has shown that at least for some clusters at higher redshifts there is evidence for a population of massive blue star-forming galaxies in their centres (Brodwin et al., 2013; Zeimann et al., 2013; Alberts et al., 2014; Mei et al., 2014) with a possible ’reversal of fortune’ in the morphology-colour-density relation at (Tran et al., 2010). This is unlike the classical Butcher-Oemler effect (Butcher & Oemler, 1978, 1984; Dressler, 1984) where the excess blue systems in high redshift clusters tend to be low mass galaxies (De Propris et al., 2003b; Pimbblet & Jensen, 2012), but instead involves star-forming galaxies with masses comparable to the spheroids that dominate the red sequence population in the local Universe. At these redshifts, there appears to be diversity in star formation and growth between clusters, e.g. some show evidence of on-going mass assembly among luminous galaxies (Rudnick et al., 2012; Fassbender et al., 2014) while others appear to resemble passive local systems (Andreon et al., 2014; Koyama et al., 2014).
This diversity is the likely signature of the end of the epoch of significant star formation and growth in the cores of massive clusters, any later evolution in this galaxy population is necessarily more subtle. Morphologically, it is usually assumed that passive red colours correlate with spheroid dominated structures, i.e. the red sequence galaxies are early types, but we should note that passive or red spirals (disks) also exist at low redshifts (Koopmann & Kenney, 1998; Wolf et al., 2009) which indicates that stellar population and structural evolution do not have to be synchronous.
One key advantage of studying cluster galaxy populations as opposed to field or group systems is that once a galaxy resides within a massive cluster it remains in such an environment thereafter. We can therefore identify the progenitors of local red sequence galaxies in distant clusters precisely because of the lack of significant evolution in luminosity functions and colours, whereas in the field galaxy population evolution can only be measured through the statistical changes in the properties of the sample at different redshifts. The aim of this paper is to measure the evolution of luminosity, colour, size and shape for galaxies in clusters at to provide an overall view of galaxy evolution in the densest environments. This redshift interval may correspond to the highest lookback time at which the more massive cluster galaxies are still quiescent and a direct line of descent can therefore be drawn to local samples. The properties of cluster galaxies may then offer clues to the more general problem of galaxy evolution, in the same fashion as stars in clusters have been instrumental (through their homogeneity) to our understanding of stellar evolution. As we will show, while the red sequence at may well be populated by galaxies that have finished forming stars, and assembling their mass, they must still be evolving significantly in their morphological properties for a significant period of time thereafter.
2 Dataset
In order to probe both the photometry and morphology of red sequence galaxies down to low near-IR luminosities (and consequently stellar masses) at we require HST data of sufficient depth in both optical and near-IR bands. The infrared is needed to select galaxies as closely as possibly by stellar mass and explore its 2D distribution. Ground-based data simply cannot reach the fluxes and surface brightnesses necessary at these redshifts. Although a significant number of the known clusters have been imaged by HST and therefore have data in the archive, currently only a few have sufficiently deep data in a sufficient range of bands. For example, we do not consider the two Lynx clusters at as only optical data (but no infrared) are available in the archive.
For this work we aim to be able to reach at least M in the observed near-IR, which is roughly equivalent to a stellar mass comparable to that of the LMC (so ) assuming only passive evolution in luminosity. We then require optical data (probing the rest frame blue/near-UV) of a depth sufficient to identify and characterise most or all of the red sequence galaxies in combination with the near-IR. In practice, the reddest band available in the archival data is the WFC3 , which corresponds to the rest-frame band at the redshifts of interest here. Given the current state of the archive we chose to study four clusters at with data of sufficient quality and depth. These four systems are XMM1229 at , RDCS1252+2927 at , ISCS1434 at and XMM2235 at , with near-IR data obtained as part of Proposal 12051, PI Perlmutter. Exposure times were of around 4ks each. Optical imaging in the and bands, to sample the rest-frame and were derived from a variety of sources (XMM1229 from program 10496, PI: Perlmutter; RDCS1252 from PID 9290, PI: Ford; ISCS1434 also from PID 10496 and XMM2235 from PID 10531, PI: Mullis). Exposure times vary between 1.5 and 7.2 ks in and between 3 and 10 ks in .
Initial photometry was carried out exactly as in our earlier work (De Propris et al., 2013). We used Sextractor (Bertin & Arnouts, 1996) with the same parameters as used previously to measure both total and aperture magnitudes on each separate image and bandpass. In addition to the cluster fields, we used similarly-deep reference fields which are treated in exactly the same way in order to understand the expected contribution from foreground/background interlopers when determining luminosity functions. For the reference fields we used the same data on the Extended Groth Strip as that used in De Propris et al. (2013), as well as band images of the Early Release Data 2 field, which covers part of the southern GOODS field (Giavalisco et al., 2004). The latter provides us with and photometry, allowing us to derive the red sequence luminosity functions in addition to the overall cluster luminosity functions. Note all magnitudes are on the AB system.
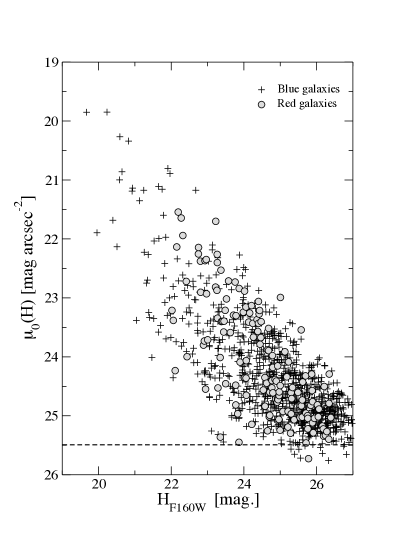
For star-galaxy separation, we plot the central surface brightness (measured in the Sextractor detection aperture) vs. total magnitude in Fig. 1. Stars are identified as a high surface brightness ‘edge’ at all luminosities. All objects remaining after star-galaxy separation were visually inspected to remove possible contaminants such as cosmic ray streaks, diffraction spikes, brighter galaxies segmented by the algorithm and (for cluster fields) large gravitational arcs. Note that we performed a similar procedure on our reference fields as well. These will be discussed in more detail in a future paper.
In addition to the standard flux cuts typically used in photometric selection of galaxy samples, we also consider the effect of surface brightness on the completeness of any sample of red sequence objects. While luminous galaxies are detected within a broad wedge-shaped region in Fig. 1, there is a horizontal ‘cut’ at low surface brightnesses, which represents the detectability limit set by the sky brightness. While this significantly affects the bulk of the galaxy distribution at , comparatively low surface brightness outliers start to be lost by , so we limit our sample selection to brighter than this. The surface brightness limit induces a significant selection effect (e.g., Disney 1976; Phillipps & Driver 1995) which we will discuss later in this paper in relation to the red sequence luminosity functions.
3 Colour and Luminosity Evolution
We first reconfirm several results from published studies of the luminosity functions and colour magnitude relations of distant clusters.
The data at hand reach to as faint (e.g. Strazzullo et al., 2010) or fainter luminosities than has been previously achieved at this redshift, enabling us to better measure the faint-end slope of the galaxy luminosity function and study the evolution of the red sequence, which allows us to relate our further analysis of sizes and morphologies to galaxies more representative of the descendant population in lower redshift clusters rather than purely the most massive galaxies.
As in our previous paper on a similar HST dataset at (De Propris et al., 2013), we derive composite luminosity functions in the band from the background-subtracted counts in each cluster field, following the procedure described by Colless (1989). We have shifted all clusters to a mean redshift of , following the procedure in De Propris et al. (1999), assuming a distance modulus from the conventional cosmological model111Throughout this paper we assume the concordance values for cosmological parameters: , and H km s-1 Mpc-1 and differential corrections (between the cluster and ) from a Bruzual & Charlot (2003) model forming its stars at with solar metallicity and an e-folding time of 1 Gyr, which generally yields a good fit to the colour-magnitude relations of the red galaxies in distant clusters (e.g., Mei et al. 2009; Rudnick et al. 2012).
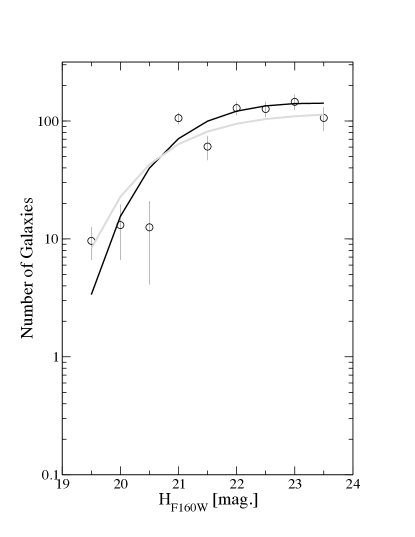
Fig. 2 shows the composite band luminosity function derived from the combination of the four clusters, having shifted the photometry of each to , the best fitting Schechter function and the derived error ellipses. Errors include a contribution from non-Poissonian clustering computed as in Huang et al. (1997) and Driver et al. (2003). The best fit to this composite function has and where is the apparent magnitude at corresponding to M∗. The uncertainties on both are shown in the inset of Fig 2 as and error ellipses. In the figure we also show the composite infrared luminosity function of 10 local clusters measured from a pure spectroscopic sample in De Propris & Christlein (2009), shifted to assuming the above passively evolving model.
Looking only at the points fainter than , the faint end slope appears well-determined (by eye it is consistent with ), but as is usual the uncertainty in M∗ and the resulting uncertainty in positioning the exponential cutoff affects the determination of the faint end slope. The uncertainty in the bright end is dominated by the background subtraction. As we show later, the effect of this is decreased significantly in the determination of the luminosity function of the red sequence alone, purely because the bright red sequence galaxies fall in an otherwise less populated region of colour-magnitude space. A larger cluster sample would be needed to pinpoint more accurately.
For our chosen cosmology our luminosity function at has . Given the local luminosity function from De Propris & Christlein (2009) and assuming for local galaxies, this agrees with the local value of values within 5%, given the corrections calculated from the passively evolving model. The implied evolution of , in comparison to low redshift clusters, is consistent with a pure passive evolution scenario where bright galaxies are assembled at high redshift and suggests that no significant growth has occurred in the galaxy luminosities (or rather, in stellar masses) since at least the redshifts of the present sample of clusters.
This has already been established by several previous studies (e.g., De Propris et al. 1999; Andreon 2006; De Propris et al. 2007; Muzzin et al. 2008; Mancone et al. 2010), some reaching to even higher redshifts (Andreon et al., 2014; Wylezalek et al., 2014). Similarly, the value for is consistent with the zero redshift values in clusters as measured by Barkhouse et al. (2007) for 57 Abell clusters in . Andreon (2008) and Mancone et al. (2012) also found a similar lack of evolution for since and 1.3, respectively, while we measured in for several clusters at in our previous work (De Propris et al., 2013).
There is therefore no evidence for significant growth in the luminosity of typical cluster galaxies since down to at least 2.5 magnitudes below the point. Consistent with the results of Andreon et al. (2014) and Wylezalek et al. (2014), it appears that any evolution must essentially preserve the shape of the galaxy luminosity function across more than a decade in stellar mass. Any mergers and accretion from the field would have to be very finely compensated by galaxy growth and destruction to produce remarkably self-similar objects across two thirds of the age of the Universe.
3.1 Red Sequence Luminosity Functions
In order to obtain the red sequence luminosity function, we must first consider the colour-magnitude diagrams of the clusters. We generate colour-magnitude relations for galaxies in the cluster fields in vs. as shown in Fig. 3, where colours were measured in apertures and magnitudes are total magnitudes. The existence of well-defined red sequences is apparent, though of varying strength between clusters reflecting their overall richness. As expected, their colour-magnitude relations are consistent with passive evolution of the local relations to the appropriate redshift (cf. Kodama & Arimoto 1997; Mei et al. 2012; Snyder et al. 2012). The relations can be followed to the magnitude limits of our data, with no apparent evidence for a weakening at the faint end in the best defined cases (e.g. RDCS1252).
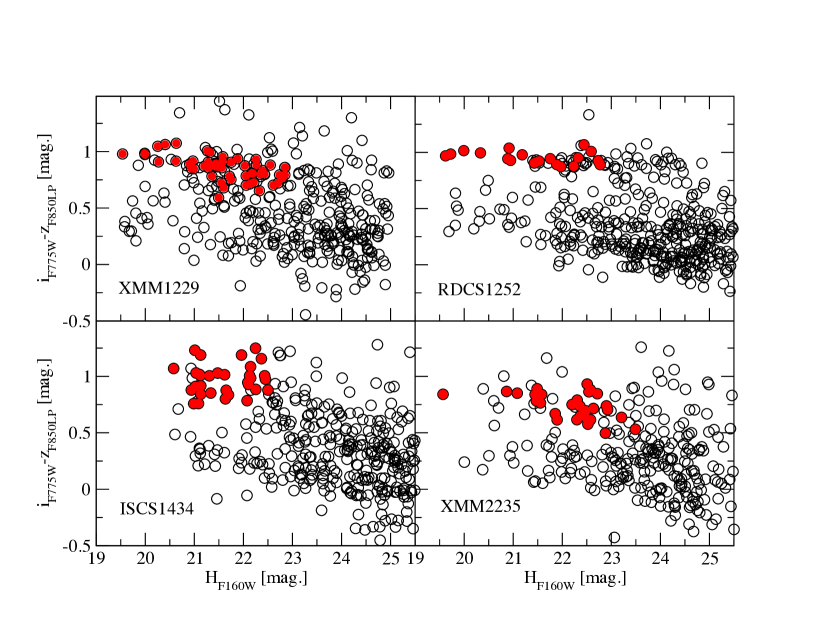
We select out red sequence galaxies in the following manner: we derive the slope and intercept of the red sequence by minimum absolute deviation (Armstrong & Kung, 1978) and then take all objects within mag. of the ridge line as belonging to the red sequence. We make the same cuts on the colour-magnitude distributions of field galaxies in the ERS2 field to estimate the contribution from foreground and background galaxies, normalising to the areas of the observed cluster fields. As with the total luminosity functions in Fig. 2, we have then shifted all clusters to the mean redshift of and we have estimated the non-Poissonian contributions to the errors.
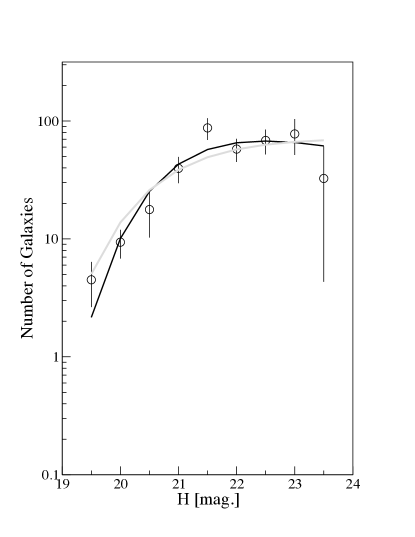
The resulting luminosity function in for red sequence galaxies is shown in Fig. 4. This has and , with error ellipses as shown in the inset. We also show the local luminosity function (as in Fig. 2), shifted to the redshift of the clusters as described for the previous figure. Even though the local luminosity function is for all galaxies, red sequence galaxies dominate local clusters. Our measured translates to , again in excellent agreement with the local value assuming a passively evolving model, implying no significant luminosity (mass) growth. Note that in the Coma cluster De Propris et al. (1998) measured and for a sample of 111 members, all of whom but one lie on the red sequence. The expected correction of mag. brings these two values in good agreement, given the photometric errors. The similarity in the and measured for the whole cluster (above) and the red sequence, implies that these high redshift systems are already dominated by red, quiescent galaxies at these early times. The error bars on individual points are smaller than those in the full luminosity function (Fig. 2) because the background/foreground contamination is lower in that part of the colour-magnitude space.
The consistency of the faint end of the LF for the red sequence down to , with that seen in nearby clusters argues that the faint end of the red sequence in massive clusters, at least down to , is already in place at the redshifts we study. Crawford et al. (2009) and Rembold & Pastoriza (2012) also find no evidence that at high redshifts is significantly different from the present day value, while Cerulo et al. (2014) find no weakening or drop-off at fainter luminosities in the red sequence for XMM 1229+0151, unlike previous claims (e.g., De Lucia et al. 2007).
3.2 Surface brightness selection effects
There may be several reasons for the discrepancy between our results and those from other studies that have claimed to see evolution in the faint-end slope of red sequence galaxies. One possibility is surface brightness selection effects, as we have discussed in De Propris et al. (2013). We plot the central surface brightness vs. total magnitude for red and blue galaxies in the cluster fields for the band data in Fig. 1. It is clear that there is a quite abrupt surface brightness cut-off at mag arcsec-2 which then generates an ever increasing magnitude incompleteness even if the detection limit of the data is much fainter. The onset of this effect lies between and 24.
In addition, we note that red galaxies are more likely to be affected by this surface brightness limit than blue galaxies. They generally have lower central surface brightnesses, probably because they lack bright star-forming regions. In particular, red galaxies seem to avoid the high concentration regions of this plot at low luminosities, suggesting that fainter red galaxies are more diffuse and therefore less likely to be detected. This is a well known characteristic of dwarfs in nearby clusters and is often used to distinguish them from background, higher surface brightness, galaxies (e.g. Sandage et al. 1985).
To at least the level the data are complete and there is no evidence for a weakening of the red sequence. To fainter limits, it is uncertain whether there is a real decline in the red sequence or whether this is due to a combination of incompleteness due to surface brightness and insufficient sensitivity in the bluer bandpasses: this cannot be either proven or disproven with present data, but claims to this effect should be considered with caution (Martinet et al., 2014).
4 Morphological Evolution
Having selected a sample of galaxies representative of the red sequence population at over a wide range of luminosities, we can now explore their morphological properties and compare these to equivalent properties in a sample of zero redshift red sequence members, in this case taken from the Virgo Cluster (Ferrarese et al., 2006). As the sample of high redshift galaxies is chosen based on a simple colour cut and without spectroscopic confirmation, a fraction of this sample will be foreground or background interlopers, either with the same intrinsic colour, or scattered into the sample through photometric uncertainties. Although the contamination rate will be low (or zero) at bright magnitudes it increases at fainter levels. We assess this as part of the background subtraction procedure for producing the red sequence luminosity function. The interloper fraction at a given magnitude bin is simply the difference between the total number count and the count used in the luminosity function divided by the total number count. Brighter than contamination is negligible and does not influence subsequent results. Between the interloper fraction rises to up to 40% and therefore is taken into account when interpreting results in this magnitude range.
In order to quantify the morphology of the red sequence galaxies we use GALFIT (Peng et al., 2002, 2010) to simultaneously measure their sizes (effective radii) and intensity profile shapes (Sérsic indices) by assuming a single Sérsic profile fit. We interactively carry out fitting on all galaxies in the and band images, using bright stars in the cluster fields as a point spread function reference, inspecting the residual images as an indicator of the quality of the fit. We limit this process to galaxies brighter than . Fainter than this the radial fits become insufficiently reliable and, as shown earlier, surface brightness incompleteness selects against larger and more diffuse galaxies even though more compact galaxies are detected to significantly fainter levels.
4.1 Size and shape evolution
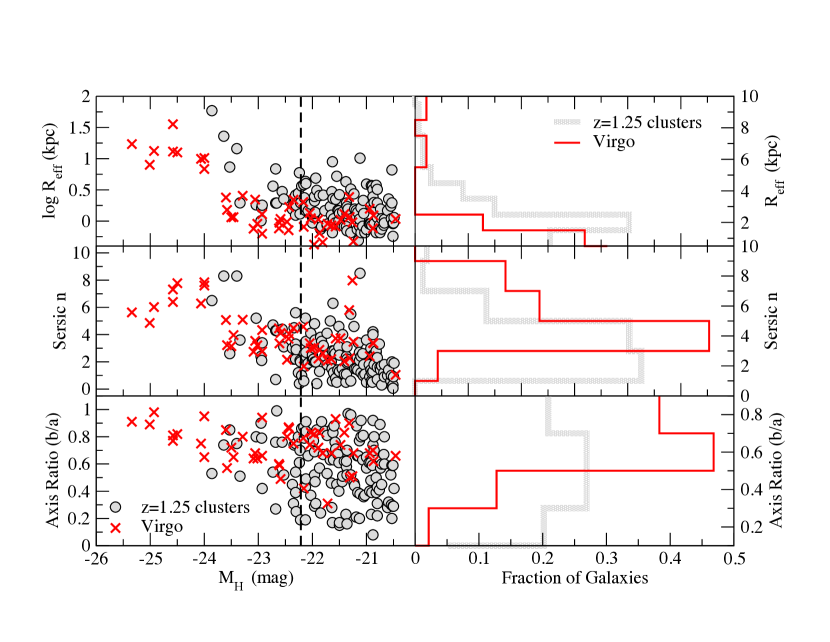
Fig. 5 (top panel) shows the effective radii of galaxies in our clusters as a function of -band absolute magnitude for each galaxy when evolved to as described earlier. The equivalent data in Ferrarese et al. (2006) from the ACS Virgo Cluster Survey (VCS) is also plotted as the zero redshift comparator. At , the observed band more closely matches the restframe band, while the VCS data are measured in the band. However, as shown by previous studies (e.g., Vader1988; Tamura & Ohta 2000) and the plotted Ferrarese et al. data itself, colour gradients for local ellipticals are small, especially in the redder bands, so we expect that there will be little difference between the effective radii in and in Virgo.
We see little evidence of size evolution in cluster galaxies across this redshift range. The high redshift galaxies at M∗ and fainter have kpc, comparable to galaxies of similar luminosity (after passive evolution) in Virgo (Ferrarese et al., 2006), Coma and Fornax (Gutierrez et al., 2004) and typical WINGS clusters (Poggianti et al., 2013) at low redshift. The more luminous galaxies are larger and again comparable in size to the corresponding luminosity/stellar mass galaxies in nearby clusters. A K-S test returns that the two distributions are drawn from the same sample at least at the 90% level. As with previous work (e.g., Delaye et al. 2014) this implies that there is significantly less size evolution in red sequence cluster galaxies over the past Gyr than that seen for field galaxies of similar mass.
Many previous studies have suggested that field early type galaxies at high are more compact than those seen locally (e.g.,Whitaker et al. 2012; Cassata et al. 2013; Williams et al. 2014 and references therein), though this work usually concentrates on the more luminous objects. Our above result on the surface brightness vs. luminosity plot (Fig. 1) already suggests that we are not seeing particularly compact luminous galaxies in our clusters.
However, in other measured parameters there are clear differences between the values for the high redshift sample and those for the low redshift comparators. Red sequence galaxies in our high redshift clusters have, on average, lower Sérsic indices, , than those in Virgo at the equivalent band magnitude (Fig. 5, middle panel) assuming passive evolution. We plot the distribution of Sersic indices for all cluster galaxies and Virgo in the histogram (middle panel) in Fig. 5. This shows than is systematically lower by about 1.5 compared to Virgo for our sample. This difference is confirmed by a K-S test that rejects the hypothesis that the two samples are drawn from the same parent distribution at more than .
Almost all the Virgo red sequence galaxies down to an equivalent band magnitude of have (typical of classical ellipticals) whereas most of the high redshift sources have (and usually ), excepting the most luminous and massive cluster galaxies. Even at an observed magnitude of () where there is increased contamination of the red sequence sample by interlopers, there are insufficient objects with high for the true red sequence galaxies to typically have the Sérsic indices as high as their Virgo counterparts. The numbers of objects in the plots can be directly compared, as there are Virgo galaxies to the luminosities we consider, and about 140 galaxies in total for the high redshift clusters.
Similarly, we find that the high redshift sample contains more objects with flattened axis ratios (i.e., more disk-like) than in Virgo (bottom panels of Fig. 5). Again the histogram shows that the high redshift clusters have a long ’tail’ at low and a K-S test also confirms that the two samples have not been drawn from the same distribution at more than the 5 level.The lack of objects in Virgo with and compared to the high redshift sample therefore appears to be significant, even accounting for some degree of contamination by interlopers. In all these figures, we plot all clusters at compared to Virgo; no cluster is responsible for the observed results on its own and they all share the above features (i.e., a more disk-like and flattened population compared to the local data).
An obvious interpretation of this result is that most of the high redshift red sequence galaxies are more disk-like or contain more significant disk components than their low redshift counterparts (in agreement with similar observations by Rembold & Pastoriza 2012). Only the brightest galaxies have Sérsic indices consistent with those of genuine ellipticals, and even then they are usually lower than those of equivalently bright and massive Virgo counterparts. Other parameters are consistent with this interpretation. Clearly, many of the high redshift galaxies show very significant elongation, the entire distribution of axial ratios (Fig, 5 bottom panel) is consistent with expectations from a sample of randomly oriented disks (e.g. Lambas et al., 1992).
Compared to the Virgo cluster, a population of more highly elongated objects is present at all luminosities, while such systems can only be seen for the fainter Virgo galaxies (and recall that even Virgo dwarf ellipticals, with to 2, are round in shape; Binggeli & Popescu 1995).The range of axial ratios seen in the Virgo sample is much smaller with typically higher values. This is consistent with an intrinsically elliptical/spheroidal population implied by their higher Sérsic indices. Indeed, Chang et al. (2013) find an increased fraction of massive quiescent galaxies with flatter axial ratios at even in the field (see also Bruce et al., 2012).
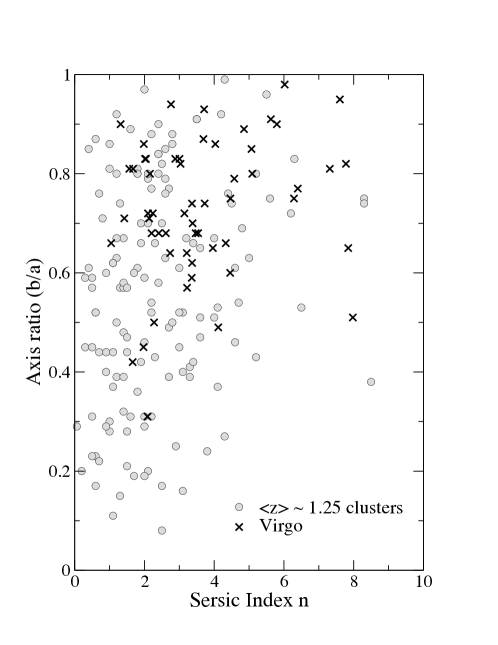
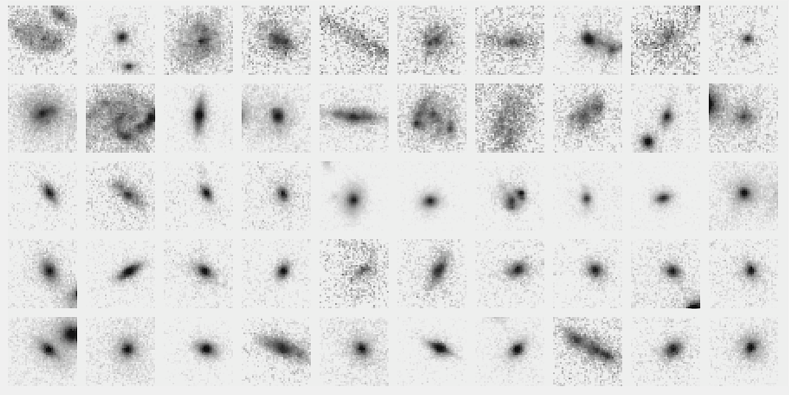
Fig. 6 shows the same information in a different fashion, plotted against Sérsic index, where we see that there are red sequence galaxies in high redshift clusters with significantly flatter axial ratios at lower than their Virgo counterparts. The more highly elliptical galaxies in Fig. 5 have lower and correspond to the red sequence objects in the lower left region of Fig. 6. All this points to a different (disky) morphology for most red sequence galaxies in our high clusters. Indeed, the range of projected suggests that these disks are more like the thin ones seen in modern day spiral galaxies, than the typically ’thicker’ ones seen in SOs (Laurikainen et al., 2010), the most common disk galaxies in low clusters. That is, cluster galaxies at this epoch have become ‘red’ without becoming ‘early type’ yet, though they already have roughly the same stellar mass as their local counterparts. The images of the red sequence galaxies bear this out: Fig 7 shows postage stamps of red sequence galaxies (in the band) within mag. of and with Sérsic indices , demonstrating the disky nature of the bulk of the population.
4.2 Colour gradients
Local red sequence galaxies show weak negative (bluer outwards) colour gradients (Tamura & Ohta, 2000); these weak gradients are observed to have the same size to , implying that they are due to metal abundance gradients (La Barbera et al., 2003). We measure the colour gradients in (approximately rest-frame ) for our galaxies following the method of La Barbera et al. (2003), i.e., we parameterise the gradients via the ratio of the effective radii as separately measured in the and bands, . The reason we do this is that, for these faint and small objects, we cannot easily derive a radial luminosity profile which is accurate enough to derive colour gradients directly as in the lower redshift studies of Vader et al. (1988) or Tamura & Ohta (2000). For these high redshift systems, sky subtraction will be uncertain, the differences in the point spread functions between ACS and WFC3 are difficult to model and any small misalignment between the blue and red image may result in spurious results for directly determined colour profiles (e.g., from ellipse). Our approach minimises these issues, as it simply compares the effective radii derived from each image and measures the colour gradient via their ratio. The centering of the profile, the effects of the PSF and sky level are modelled for each galaxy via GALFIT and are, in principle, accounted for.
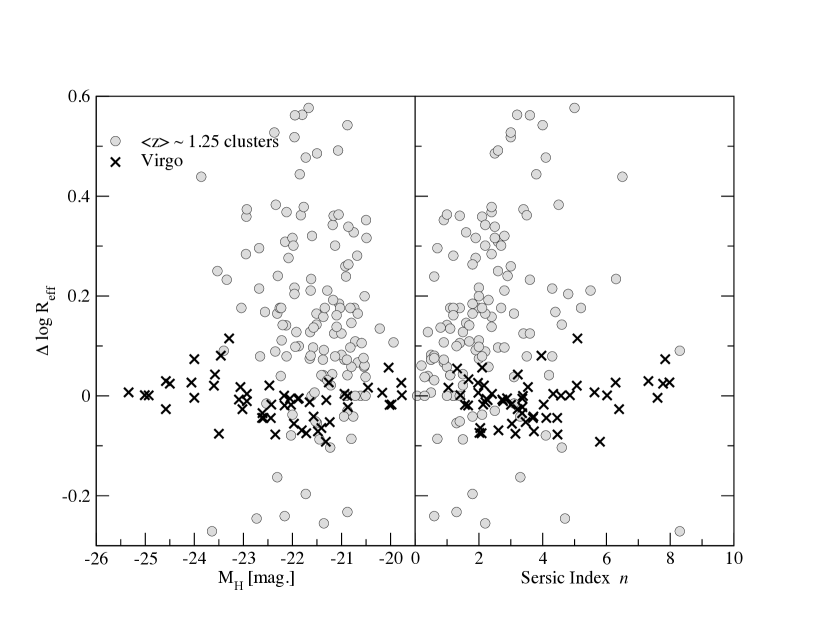
As shown in Fig. 8, the high redshift galaxies are found to have significantly positive (i.e., a larger in the bluer band), hence negative colour gradients in the usual sense in rest-frame (observed ). These are much larger than those observed for Virgo galaxies (typically consistent with little or no gradient when measured in ). Here we find that the high redshift systems typically have somewhat larger than found locally (0.1 to 0.4 as opposed to ) while the high redshift spheroids (large ) have of to . Using equation (4) from La Barbera et al. (2002), we find that a median of 0.13 corresponds to a colour gradient of mag. in per decade in radius. Local systems in La Barbera et al. (2002) have typical gradients of –0.1 to –0.3 mag., for comparison. Similarly significant negative colour gradients in a substantial fraction of early type galaxies at , albeit among field galaxies, have been measured by Gargiulo et al. (2012).
This argues that these galaxies have significantly bluer exteriors than their local counterparts, while still being overall red in colour - star formation has likely ended throughout, but more recently in the outer parts. Colour gradients in local red sequence galaxies are commonly attributed to a gradient in mean metal abundance with radius (e.g., Foster et al. 2009). The sizes of the colour gradients we measure are more consistent with age gradients, as they are too large to be produced by metallicity alone (Saglia et al., 2000; La Barbera et al., 2003), with higher redshift galaxies being younger at larger radii. Star formation may therefore have continued for longer periods in the outer parts of these galaxies, before they were quenched on to red sequence. (Of course, their descendants will also be younger in the outer parts, but the colour differential decays rapidly with time). The large scatter in the colour gradients in Fig 8 suggests that cessation of star formation may have taken place over a range of times for each galaxy. This is similar to the findings of Jørgensen et al. (2005), where fainter cluster galaxies in a cluster were found to have had significant star formation at based on the tilt of its fundamental plane.
Considering our measurements of Sérsic indices and axis ratios above, the most straightforward interpretation of these findings is one where, apart from the brightest ones, most red sequence galaxies in clusters at these redshifts still possess significant disk components with younger mean ages for their stellar populations. The relative strength of the high redshift gradients can be explained assuming that the rate at which gradients decrease itself declines with increasing time since cessation of star formation in the disks (e.g., see Fig. 9 in La Barbera et al. 2003 for the evolution in colour with time of an age-induced gradient). Given that there is Gyr between and and a similar time between and (the earliest that star formation is likely to end in any disk), it is unsurprising that gradients of the observed strength are only seen at the higher redshifts studied in this work.
Given that the galaxies we are studying are red and have ceased significant star formation at an earlier epoch, the clear implication is that colour (stellar population) evolution precedes morphological evolution (Skibba et al., 2009; Kovac et al., 2010) and that most of these red sequence galaxies are galaxies with significant disk components that fade or evolve secularly into bulge-dominated red (quiescent) galaxies in the present universe (e.g., Jaffe et al. 2011). This is not the first time such an evolutionary scenario has been suggested to explain the properties of high redshift populations. Bundy et al. (2010) proposed a similar scheme for the evolution of red sequence galaxies at in the COSMOS field, where morphology changes after star formation is suppressed, as disks fade and bulge components become more significant (in a relative if not absolute sense). Although it is a field sample, several red disks are also observed by Bruce et al. (2012) in the CANDELS survey, albeit at somewhat higher redshifts.
Given that only a minority of the bright galaxies even in Virgo are true ellipticals, the majority being S0s (Ferrarese et al., 2006), it is likely that most of these “red disks” will evolve into classical lenticulars rather than true ellipticals. While these high redshift galaxies could themselves be labelled as lenticulars (as we see no evidence of spiral arms), they are significantly diskier (in terms of their Sérsic indices, range of axis ratios and colour gradients) than classical zero-redshift cluster S0s. Early on, Michard (1994) proposed that all but the brightest ellipticals can be observed to host disks and should be classified as S0s. With the exception of very luminous ellipticals, most early-type galaxies are found to contain a rotating stellar disk (Emsellem et al., 2011), with several S0s found to be fast rotators (Emsellem et al., 2007), and, by implication, therefore disky. In terms of the classification used by Bundy et al. (2010), based on their Sérsic indices, our sample of cluster red sequence galaxies are mainly “early disks” with true ellipticals only dominating at the high mass end. The stellar mass at which the dominant population changes is similar in the clusters studied here and in the highest redshift subsample of Bundy et al. (2010) (e.g. see their figure 2).
While the red disky systems discussed here appear relatively extreme in their properties (Sérsic indices, range of axis ratios and colour gradients), comparable red disk galaxies have been identified at lower redshifts. Passive red disks, with little or no spiral structure, have been found to be a notable sub-population in the red sequence of the Abell 901/2 supercluster at (Wolf et al., 2009) Balogh et al. (2009) finds dust-reddened spirals with early-type morphology (S0/a) on the red sequence in groups, although these objects tend to be star-forming rather than passive. About 10% of red sequence galaxies are observed to have infrared colours indicative of active or recent star formation in the PRIMUS sample (Zhu et al., 2011). On the other hand, Masters et al. (2010) identify truly passive spirals in their sample and show that they tend to have large masses, likely similar to our targets. These red disks have similar, or slightly younger, ages than ellipticals (Robaina et al., 2012; Tojeiro et al., 2013), which is likely the case for our sample as well, given our interpretation of the observed colour gradients as age gradients.
Passive spirals are known in nearby clusters as well (van den Bergh, 1976; Koopmann & Kenney, 1998). Their frequency may even increase in the higher redshift MORPHS sample (Poggianti et al., 1999), where they are believed to gradually replace S0s. These passive red spirals also tend to occur more commonly at intermediate densities (Bamford et al., 2009; Masters et al., 2010) and although the numbers are small, many of our objects seem to lie somewhat outside of the cluster core. Similarly, Ferré-Mateu et al. (2014) show that in CL0152-13 at a small population of cluster members lying outside of the two main subclusters has younger ages than the apparently old ellipticals in the cluster core.
These red disks may originate from quenched disk galaxies, which are abundant in local groups (Feldmann et al., 2011). Carollo et al. (2013, 2014) find that quenching and fading of disks may be responsible for the apparent evolution of the typical size of the early type galaxy population as a function of time. At higher redshift, Fontana et al. (2004) and Abraham et al. (2007) claim that at many ’red’ galaxies in the field are disk-dominated. Intermediate mass disks are present at in the COSMOS field, but vanish by and it is likely that they form bulges by secular evolution (Oesch et al., 2010) as the merger rate is too low to account for the observed decrease in their space densities. The velocity dispersion in the cluster environments of the high redshift red sequence galaxies also significantly limits the significance of mergers in their evolution, while our observations also show that mergers must not have been important in these objects. This implies that whatever the mechanism for any disk fading/bulge growth that causes the population to evolve morphologically with time, it does not have to involve significant merger activity across a wide range of environments (Vulcani et al., 2013). Cibinel et al. (2013) find that the timescale for morphological evolution, by disk removal or fading, is Gyrs in their group samples. Based on the evolution of the colour gradients, that vanish at least by (La Barbera et al., 2003), the disks we observe at appear to disappear on similar timescales. Whether this occurs by disk fading, removal or secular evolution is an issue that can be addressed with better and more data on clusters above than present in the archive currently. Such a dataset would also allow us to considerably improve our estimate for the evolution of the luminosity function parameters.
5 Conclusions
In this work we have demonstrated that while the stellar populations of typical cluster red sequence galaxies appear to have already reached a state of only passive evolution, their morphologies must clearly evolve over the subsequent Gyr. Specifically we find the following:
-
•
Red sequence cluster galaxies in four clusters appear to have formed their stars and assembled their mass completely by this redshift, at least down to 3 magnitudes below the point, evolving passively afterwards.
-
•
Unlike field galaxies, these red sequence galaxies do not show size evolution when compared to zero redshift cluster galaxies.
-
•
However, there is clear evidence that these objects must continue to evolve morphologically at these redshifts. Apart from the most massive of the high redshift galaxies, these systems appear to have lower Sérsic indices than those of a similar mass in low redshift clusters, projected axis ratios extending to lower (b/a) than local counterparts, and clear negative colour gradients much larger than those encountered locally. These colour gradients are so large that they can only really be attributed to age gradients in the stellar populations, with the galaxies being younger outwards.
-
•
Taken together all of these observations imply that the bulk of the red sequence galaxies in massive clusters are galaxies with significant disk components (diskier than present-day lenticulars) unlike those identified in the dense regions of low redshift clusters which have the characteristics of classical ellipticals and S0s.
-
•
Given the clear difference in the Sérsic indices and colour gradients in the two epochs, a clear prediction is that the disks must reduce in prominence over time through ageing of their stellar populations and/or their secular evolution into bulges. The present results do not suffice to determine whether this is due to disk fading (implied by the observation that the effective radii do not change), bulge luminosity growth (suggested by the increase in the Sérsic index) or both.
Acknowledgments
We would like to thank Inger Jørgensen and Anna Cibinel for useful discussions. This work is based on observations made with the NASA/ESA Hubble Space Telescope, and obtained from the Hubble Legacy Archive, which is a collaboration between the Space Telescope Science Institute (STScI/NASA), the Space Telescope European Coordinating Facility (ST-ECF/ESA) and the Canadian Astronomy Data Centre (CADC/NRC/CSA). Some of the data presented in this paper were obtained from the Mikulski Archive for Space Telescopes (MAST). STScI is operated by the Association of Universities for Research in Astronomy, Inc., under NASA contract NAS5-26555. The PIs of the original projects which produced these data are thanked for providing excellent deep archival images with diverse uses beyond the original programmes. We also thank the anonymous referee for a helpful report that helped to clarify a number of issues.
References
- Abraham et al. (2007) Abraham R. G. et al. 2007, ApJ, 669, 184
- Alberts et al. (2014) Alberts S. et al. 2014, MNRAS, 437, 437
- Andreon (2006) Andreon S. 2006, A&A, 448, 447
- Andreon (2008) Andreon S. 2008, MNRAS, 386, 1045
- Andreon et al. (2014) Andreon S., Newman A. B., Trinchieri G., Raichoor A., Ellis R. S., Treu T. 2014, A&A, 565, 120
- Armstrong & Kung (1978) Armstrong R. D., Kung M. T. 1978, Applied Statistics, 27, 363
- Balogh et al. (2009) Balogh M. et al. 2009, MNRAS, 398, 754
- Bamford et al. (2009) Bamford S. et al. 2009, MNRAS, 393, 1324
- Barkhouse et al. (2007) Barkhouse W. A., Yee H. K. C., Lopez-Cruz O. 2007, ApJ, 671, 1471
- Bertin & Arnouts (1996) Bertin E., Arnouts S. 1996, A&AS, 117, 393
- Binggeli & Popescu (1995) Binggeli B., Popescu C.C. 1995, A&A, 298, 63
- Blakeslee et al. (2003) Blakeslee J. et al. 2003, ApJ, 596, L143
- Brodwin et al. (2013) Brodwin M. et al. 2013, ApJ, 779, 138
- Bruce et al. (2012) Bruce V. A. et al. 2012, MNRAS, 427, 1666
- Bruzual & Charlot (2003) Bruzual G., Charlot S. 2003, MNRAS, 344, 1000
- Bundy et al. (2010) Bundy K. et al. 2010, ApJ, 719, 1969
- Butcher & Oemler (1978) Butcher H. & Oemler A. 1978, ApJ, 226, 559
- Butcher & Oemler (1984) Butcher H. & Oemler A. 1984, ApJ, 285, 426
- Carollo et al. (2013) Carollo C. M. et al. 2013, ApJ, 773, 112
- Carollo et al. (2014) Carollo C. M. et al. 2014, arXiv 1402.1172
- Cassata et al. (2013) Cassata P. et al. 2013, ApJ, 775, 106
- Cerulo et al. (2014) Cerulo P., Couch W. J., Lidman C., Delaye L., Demarco R., Huertas-Company M., Mei S., Sanchez-Janssen R. 2014, MNRAS, 439, 2790
- Chang et al. (2013) Chang Y.-Y., van der Wel A., Rix H.-W., Wuyts S., Zibetti S., Ramkumar B., Holden B. 2013, ApJ, 762, 83
- Cibinel et al. (2013) Cibinel A. et al. 2013, ApJ, 777, 116
- Cimatti et al. (2008) Cimatti A. et al. 2008, A&A, 482, 21
- Colless (1989) Colless M. 1989, MNRAS, 237, 799
- Crawford et al. (2009) Crawford S. M., Bershady M. A., Hoessel J. G. 2009, ApJ, 690, 1158
- Damjanov et al. (2009) Damjanov I. et al. 2009, ApJ, 695, 101
- Delaye et al. (2014) Delaye L. et al. 2014, MNRAS, 441, 203
- De Lucia et al. (2007) De Lucia G. et al. 2007, MNRAS, 374, 809
- den Brok et al. (2011) den Brok M. et al. 2011, MNRAS, 414, 3052
- De Propris et al. (1998) De Propris R., Eisenhardt P. R., Stanford S. A., Dickinson M. 1998, ApJ, 503, L45
- De Propris et al. (1999) De Propris R., Stanford S. A., Eisenhardt P. R., Dickinson M., Elston R. 1999, AJ, 118, 719
- De Propris et al. (2003a) De Propris R. et al. 2003a, MNRAS, 342, 725
- De Propris et al. (2003b) De Propris R., Stanford S. A., Eisenhardt P. R., Dickinson M. 2003b, ApJ, 598, 20
- De Propris et al. (2007) De Propris R., Stanford S. A., Eisenhardt P. R., Holden B. P., Rosati P. 2007, AJ, 133, 2209
- De Propris & Christlein (2009) De Propris R., Christlein D. 2009, Astr. Nach. 330, 943
- De Propris et al. (2013) De Propris R., Phillipps S., Bremer M. N. 2013, MNRAS, 434, 3469
- Disney (1976) Disney M. 1976, Nature, 263, 573
- Dressler (1984) Dressler A., 1984, ARA&A, 22, 185
- Driver et al. (2003) Driver S. P., Odewahn S. C., Echevarria L., Cohen S. H., Windhorst R. A., Phillipps, S., Couch W. J. 2003, AJ, 126, 2662
- Emsellem et al. (2007) Emsellem E. et al. 2007, MNRAS, 379, 401
- Emsellem et al. (2011) Emsellem E. et al. 2011, MNRAS, 414, 888
- Fasano et al. (2000) Fasano G., Poggianti B. M., Couch W. J., Bettoni D., Kjærgaard P., Moles M. 2000, ApJ, 542, 673
- Fassbender et al. (2014) Fassbender R. et al. 2014, A&A, 568, 5
- Feldmann et al. (2011) Feldmann R., Carollo C. M., Mayer L. 2011, ApJ, 736, 88
- Ferrarese et al. (2006) Ferrarese L. et al. 2006, ApJS, 164, 334
- Ferré-Mateu et al. (2014) Ferré-Mateu A., Sánchez-Blasquez P., Vazdekis A., de la Rosa I. G. 2014, ApJ, 797, 136
- Fontana et al. (2004) Fontana A. et al. 2004, A&A, 424, 23
- Gargiulo et al. (2012) Gargiulo A., Saracco P., Longhetti M., La Barbera F., Tanburri S. 2012, MNRAS, 425, 2698
- Giavalisco et al. (2004) Giavalisco M. et al. 2004, ApJ, 600, L93
- Gutierrez et al. (2004) Ǵutierrez C. M., Trujillo I., Aguerri J. A. L., Graham A. W., Caon N. 2004, ApJ, 662, 604
- Huang et al. (1997) Huang J.-S., Cowie L. L., Gardner J. P., Hu E. M., Songaila A., Wainscoat R. J. 1997, ApJ, 476, 12
- Jaffe et al. (2011) Jaffe Y. et al. 2011, MNRAS, 417, 1996
- Jørgensen et al. (2014) Jørgensen I., Chiboucas K., Toft S., Bergmann M., Zirm A., Schivon R.P., Grützbauch R. ArXiv:1408.2906
- Jørgensen & Chiboucas (2013) Jørgensen I. & Chiboucas K., 2013, AJ, 145, 77
- Jørgensen et al. (2005) Jørgensen I., Bergmann M., Davies R., Barr J., Takamiya M., Crampton D. 2005, AJ, 129, 1249
- Kodama & Arimoto (1997) Kodama T., Arimoto N. 1997, A&A, 320, 41
- Koopmann & Kenney (1998) Koopmann R. A., Kenney J. D. P. 1998, ApJ, 497, L75
- Kovac et al. (2010) Kovac K. et al. 2010, ApJ, 708, 505
- Koyama et al. (2014) Koyama Y., Kodama T., Tadaki K.-I., Hayashi M., Tanaka I., Shimakawa R. 2014, ApJ, 789, 18
- La Barbera et al. (2002) La Barbera F., Busarello G., Merluzzi P., Massarotti M., Capaccioli M.. 2002, ApJ. 571, 790
- La Barbera et al. (2003) La Barbera F., Busarello G., Massarotti M., Merluzzi P., Mercurio A. 2003, A&A, 409, 21
- Lambas et al. (1992) Lambas D. G., Maddox S. J., Loveday J. 1992, MNRAS, 258, 404
- Laurikainen et al. (2010) Laurikainen E., Salo H., Buta R., Knapen J.H., Comeron S., 2010, MNRAS, 405, 1089
- Longhetti et al. (2007) Longhetti M. et al. 2007, MNRAS, 374, 614
- Lopez-Cruz et al. (2004) Lopez-Cruz O., Barkhouse W., Yee H. K. C. 2004, ApJ, 614. 679
- Mancone et al. (2010) Mancone C. L., Gonzalez A. H., Brodwin M., Stanford S. A., Eisenhardt P. R., Stern D., Jones C. 2010, ApJ, 720, 284
- Mancone et al. (2012) Mancone C. L. et al. 2012, ApJ, 761, 141
- Martinet et al. (2014) Martinet N. et al. 2014, arXiv, 1412.5821
- Masters et al. (2010) Masters K. L. et al. 2010, MNRAS, 405, 783
- Mei et al. (2006a) Mei S. et al. 2006a, ApJ, 639, 81
- Mei et al. (2006b) Mei S. et al. 2006b, ApJ, 644, 759
- Mei et al. (2009) Mei S. et al. 2009, ApJ, 690, 42
- Mei et al. (2012) Mei S. et al. 2012, ApJ, 754, 141
- Mei et al. (2014) Mei S. et al. 2014, astro-ph, 1403.7524
- Michard (1994) Michard R. 1994, A&A, 288, 401
- Muzzin et al. (2008) Muzzin A., WIlson G., Lacy M., Yee H. K. C., Stanford S. A. 2008, ApJ, 686, 966
- Oesch et al. (2010) Oesch P. A. et al. 2010, ApJ, 714, L47
- Pipino & Matteucci (2004) Pipino A., Matteucci F. 2004, MNRAS, 347, 968
- Peng et al. (2002) Peng C. Y., Ho L. C., Impey C. D., Rix H.-W. 2002, AJ, 124, 266
- Peng et al. (2010) Peng C. Y., Ho L. C., Impey C. D., Rix H.-W. 2010, AJ, 139, 2097
- Phillipps & Driver (1995) Phillipps S., Driver S. 1995, MNRAS, 274, 832
- Pimbblet & Jensen (2012) Pimbblet K. A., Jensen P. C. 2012, MNRAS, 426, 1632
- Poggianti et al. (1999) Poggianti B. M. et al. 1999, ApJ, 518, 576
- Poggianti et al. (2013) Poggianti B. M. et al. 2013, ApJ, 762, 77
- Rembold & Pastoriza (2012) Rembold S. B., Pastoriza M. G. 2012, MNRAS, 422, 719
- Robaina et al. (2012) Robaina A. R., Hoyle B., Gallazzi A., Jimenez R., van der Wel A., Verde L. 2012, MNRAS, 427, 3006
- Rudnick et al. (2012) Rudnick G. H., Tran K.-V., Papovich C., Momcheva I., Willmer C. 2012, ApJ, 755, 14
- Saglia et al. (2000) Saglia R. P., Maraston C., Greggio L., Bender R., Ziegler B. 2000, A&A, 360, 911
- Sandage et al. (1985) Sandage A., Binggeli B., Tammann G. A. 1985, AJ, 90, 1681
- Shen et al. (2003) Shen S., Mo H. J., White S. D. M., Blanton M. R., Kauffmann G., Voges W., Brinkmann J., Csabai I. 2003, MNRAS, 343, 978
- Skibba et al. (2009) Skibba R. et al. 2009, MNRAS, 399, 966
- Snyder et al. (2012) Snyder G. F. et al. 2012, ApJ, 756, 114
- Strazzullo et al. (2010) Strazzullo V. et al. 2010, A&A, 524, 17
- Tamura & Ohta (2000) Tamura N., Ohta K. 2000, AJ, 120, 533
- Tamura & Ohta (2003) Tamura N., Ohta K. 2003, AJ, 126, 596
- Tojeiro et al. (2013) Tojeiro R. et al. 2013, MNRAS, 432, 359
- Tran et al. (2010) Tran K.-V. H. et al. 2010, ApJ, 719, L126
- Vader et al. (1988) Vader J. P., Vigroux L., Lachieze-Rey M., Souviron J. 1988, A&A, 203, 217
- van den Bergh (1976) van den Bergh S. 1976, ApJ, 206, 883
- Vulcani et al. (2013) Vulcani B. et al. 2013, A&A, 550, 58
- Vulcani et al. (2014) Vulcani B., Poggianti B. M., Fritz J., Fasano G., Moretti A., Calvi R., Paccagnella A. 2014, arXiv, 1410.6481
- Whitaker et al. (2012) Whitaker K. E. et al. 2012, ApJ, 745, 179
- Williams et al. (2014) Williams C. et al. 2014, ApJ, 780, 1
- Wolf et al. (2009) Wolf C. et al. 2009, MNRAS, 393, 1302
- Wylezalek et al. (2014) Wylezalek D. et al. 2014, ApJ, 786, 17
- Zeimann et al. (2013) Zeimann G. R. et al. 2013, ApJ, 779, 137
- Zhu et al. (2011) Zhu G. et al. 2011, ApJ, 726, 110