collapse of the magnetic moment under pressure of AFe2 (A = Y, Zr, Lu and Hf) in the cubic Laves phase
Abstract
The electronic structures of four Laves phase iron compounds (e.g. YFe2, ZrFe2, LuFe2 and HfFe2) have been calculated by the state-of-the-art full potential electronic structure code. The magnetic moments collapse under hydrostatic pressure. This feature is found to be universal in these materials. Its electronic origin is provided by the sharp peaks in the density of states near the Fermi level. It is shown that a first order quantum phase transition can be expected under pressure in Y(Zr, or Lu)Fe2, while a second order one in HfFe2. The bonding characteristics are discussed to elucidate the equilibrium lattice constant variation. The large spontaneous volume magnetostriction gives one of the most important character of these compounds. Invar anomalies in these compounds can be partly explained by the current work when the fast continuous magnetic moment decrease at the decrease of the lattice constant was properly considered. This work may remind the experimentalists of these “old” compounds and exploration of the quantum properties under high pressures are greatly encouraged.
I Introduction
Magneto-structural interaction is a fundamental phenomenon in magnetic functional materials. The martensitic transformation caused by magnetization in magnetic shape memory is a direct magnification of this effect.kiefer Because of the huge variation of the dimensions, the compounds can be used in sensors and actuators. Meanwhile, this effect can also compensate the variation of the volume due to temperatures, as shown in the so-called Invar effectwasserman . It was proposed to be connected with magnetism because the plateau of the volume expansion starts apparently almost at the Curie temperature below which ordered magnetic moments are established. The nearly zero volume expansion is because that the Invar alloy has a spontaneous volume magnetostriction large enough to compensate normal thermal expansions due to lattice vibrations as suggested in the so-called magnetostriction model of Invarkhmeloevskyi , one of the many models to explain this phenomenon.
The cubic Laves phase iron compounds show the Invar effect in stoichiometry which may serves as a simpler model system for developing theory of Invar avoiding disorder complexing. It excludes the noncollinear magnetism and antiferromagnetic moment as the mechanism of Invar anomalykhmeloevskyi . ZrX2 can be used as a hydrogen storage materials hong because of its suitable binding energy at the interstices. It was found that H-induced lattice expansion will cause an increase in the magnetic moment. They were found interesting even half century ago. As suggested in the early work of Klein et al.,klein the electron-phonon coupling in the hypothetical paramagnetic ZrFe2 is substantial and the superconductivity transition temperature can be as high as 9 K.
Early work in AFe2 found that A and Fe atomcs are in ferrimagnetic order. Asanoasano studied the phase stability by comparing the total energies of different phases (nonmagnetic, ferromagnetic, and antiferromagnetic states of C14 or C15 Laves phases). He concludes that Y, Zr and Hf compounds are ferromagnetic C15 Laves phase at the ground state, which is in agreement with the experiments. Related properties of Laves phase iron compounds (e.g. YFe2, ZrFe2, LuFe2 and HfFe2) were studied in the past. Yamadayamada has calculated the high field susceptibility of ZrFe2 being emu/mol, and YFe2 being emu/mol, which agree with the experimental values emu/mol and emu/mol reasonably well. Wortmannwortmann showed that the hyperfine field decreases to zero at about 40 GPa in LuFe2, and 50 GPa in YFe2 at room temperature by nuclear forward scattering. At low temperature, the loss of magnetism took place at about 90 GPa. Direct information of the magnetic moment under pressures was reported by Armitagearmitage . The measured ’s are and kbar-1 for YFe2 and ZrFe2, respectively. The experiments reported lattice constants, saturation magnetization and Curie temperatures are listed in Table 1.
| AFe2 | a(Å) | () | Ms() | ||||||||
|---|---|---|---|---|---|---|---|---|---|---|---|
| exp. | LDA | GGA | exp. | LDA | GGA | exp. | LDA | GGA | |||
| YFe2 | 7.363 | 7.04 | 7.28 | small | 49 | 55 | 2.90 | 2.57 | 3.21 | ||
| ZrFe2 | 7.06 | 6.84 | 7.04 | 10 | 15 | 54 | 3.14 | 2.38 | 3.10 | ||
| HfFe2 | 7.02 | 6.82 | 7.00 | 8 | 35 | 48 | 3.36 | 2.86 | 3.26 | ||
| LuFe2 | 7.217 | 6.93 | 7.15 | 25 | 47 | 2.97 | 2.53 | 3.06 | |||
Density functional theory (DFT) was a powerful tool to explain and predict the magnetic moment under pressure. For example, the HS-LS transition of transition metal monoxides (e.g. FeO, MnO, etc.) under the hydrostatic pressure as high as about 200 GPa were predicted by Cohencohen . Magnetic transition in these highly correlated insulators is the results of competition among the kinetic energy, exchange energy and Coulombic repulsionwxz . The magnetic collapse in metals on the other hand can be qualitatively understood with the help of the Stoner model: In a simplified version of this model, the magnetic state is stable if , where is the Stoner parameter, which is weakly dependent on the atomic distance, while the density of states at the Fermi level decreases as the band width increases under the pressure. At a certain critical pressure, the criterion is no longer satisfied, then the ferromagnetism cannot be sustainable.
In this work, we found that there may exist a first order quantum phase transition under pressure in these compound, which is similar to the well studied case of ZrZn2, MnSi, etc. Large volume magnetostriction, which is an Invar character of these compounds was presented. We further suggested that in order to show Invar effect, the magnetic moment decrease with the volume should scale with that with the temperature.
II calculation details
The C15 structure Laves phase (space group F) has two formula units per face centered cubic unit cell. The full-potential local orbital minimum basis band structure code (FPLO)fplo was used in our calculation. Both the local spin density approximation (LSDA)lsda and general gradient approximation (GGA)pbe of the exchange correlations functionals were used here and the resuts were compared when necessary. The number of -points in the full Brillouin zone (BZ) is , which can guarantee the convergence of the total energy to microHartree. The scalar relativistic treatment was used where all the relativistic effects were included except the spin-orbital coupling. The fixed spin moment (FSM) calculations were used to investigate the possible multiple local energy minima with respect to the magnetic moment. The spontanous volume-magnetostriction is defined in terms of the ratio of the equilibrium volumes in the ferromagnetic FM (VFM) and the paramagnetic PM state (VPM)
| (1) |
III the ground state properties
The calculated lattice constant(), the total magnetic moment at equilibrium are listed in Table 1. The agreement with the experiments is reasonably good. The lattice constant from LSDA is lower than the experimental ones, which is notorious. The GGA results show a much better agreement. However, the volume magnetostriction is largely overestimated by GGA than LSDA. The systematic tendency is that the lattice constant and magnetic moments of Y and Lu compounds are smaller than these of Zr and Hf compounds, where one more electron is added in the latter compounds.
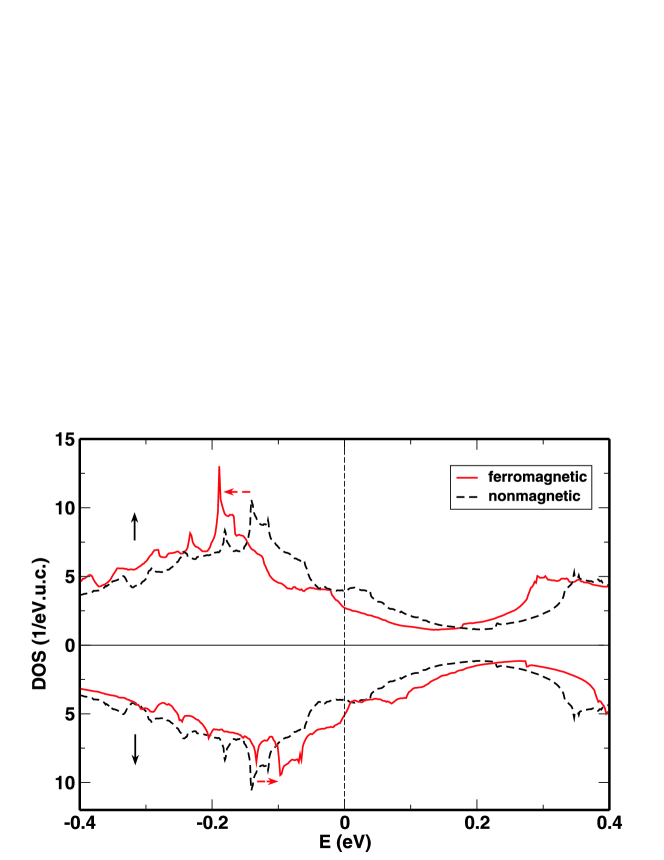
The DOS at the equilibrium lattice constant of the selected compounds are shown in Figure 1.
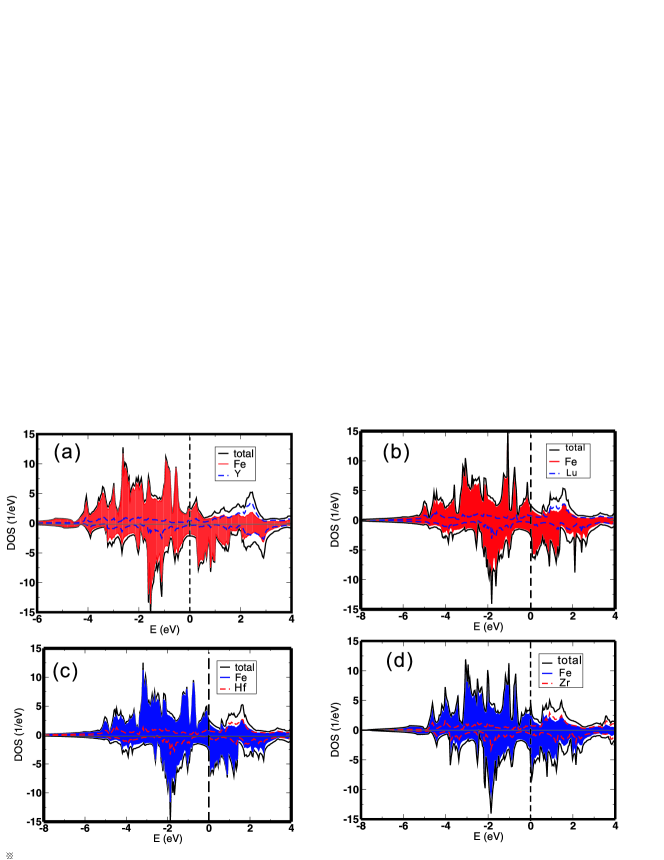
Common features of these DOS are quite obvious. The total DOS are mainly contributed by Fe’s, the other elements only show noticeable contributions at energy about 0.5 eV above the Fermi level. The bandwidth of the 3d states from Fe is about 5 eV, which is a typical value of itinerant system. These states are responsible for the properties of these compounds. Above the Fermi energy, there is relatively high DOSs in the minority spin channel. This feature is dominated by the anti-bonding 3 states of Fe. The bonding and antibonding states of the minority are separated by a deep and wide valley with width about 1 eV near the Fermi level.
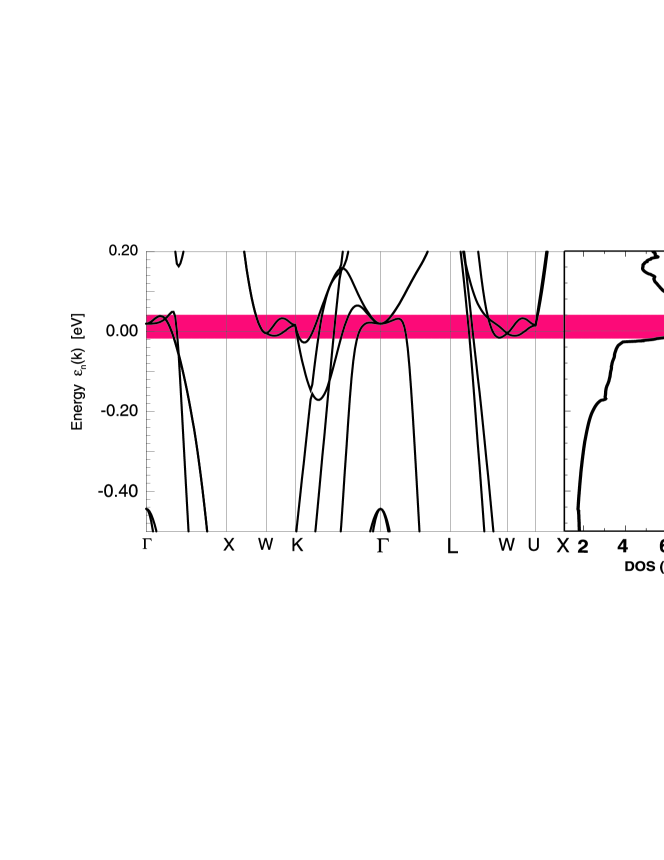
The van Hove singularity just above the Fermi level in the spin down channel is closely related to the magnetic properties which we are going to discuss, so we explore the origin of it here. Because of the similarity of the electronic structure in these four compounds only the bands and the DOS of ZrFe2 are shown here. The zoomed-in band structure and the DOS of the minority states of ZrFe2 are shown in Figure 2. The peak in the minority states just above the Fermi level comes from almost non-dispersive states. This energy range is highlighted by the rectangular block with height of 0.06 eV. The high DOS around the peak stems from the narrow bands in the directions along and . This small dispersive states are stemmed from the specific atom arrangement of the compounds. The Fe atoms in the C15 Laves phase form the so-called pyrochlore structure with corner shared tetrahedrons. If we look at the net in the {111} layer, it is the Kagomé net with alternatingly connected triangles and hexagons. As already shown by Johnston and Hoffmann johnston , the high peaks in the DOS in a Kagomé net of iron atoms come from narrow bands with character. One band tight binding calculation by Isoda isoda discovers two non-dispersive degenerated states along the line. Furthermore, there are two additional non-dispersive degenerated antibonding states along all high symmetry directions. These results indicate that the spiking DOS is originated from the special geometrical arrangement of the Fe’s.
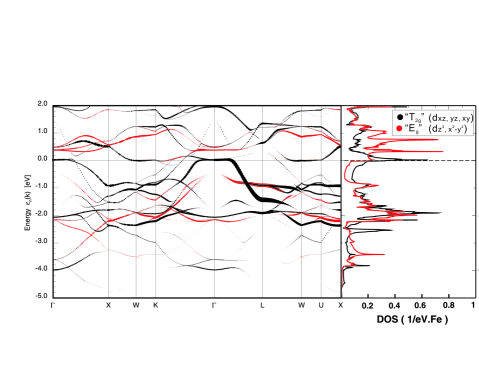
If we plot the ml-resolved “fat” band (wighted contributions of atomic orbitals) and the partial DOS (PDOS) of Fe as shown in Figure 3, it is clear that at -point the states with m (d) and 2 (d) are degenerate and m (dxy), -1 (dyz), and 1 (dxz) are also degenerate. These two groups are denoted by Eg, and T2g, respectively. It can be shown that the PDOS is divided into two catalogs: One is from the three d orbitals (m, -1, and 1) and the other is from the rest two d orbitals (ml=0, 2). It is shown that the strongest van Hove singularity in the PDOS just above the Fermi level of the minority spin state is solely from the T2g states. It is quite understandable because the T2g states form quite strong binding states along each atomic chain with nearest neighbor interactions. The antibonding state of these orbitals is the source of the quite spiking feature of the DOS in the cubic Laves phase compounds as analyzed by Johnston and Hoffman johnston . From another point of view, if we rotate the coordinates and put the z-direction to the diagonal direction of the cube, then the lattice can be described by a trigonal lattice. There is a one dimensional irreducible representation A1g with basis of d for the point group of Fe site, of which is D3d. It turns out that the d orbital comes solely from a linear combination of the original T2g orbitals. As discussed by Isoda isoda by single orbital tight binding calculations, which is naturally a one dimensional representation, the antibonding orbitals are non-dispersive in all high symmetric directions of the BZ. This implies that the one dimensional representation with d orbitals as its basis should give also quite spiking feature in the DOS.
IV The magnetic moment variations under pressure and its electronic characters
Because of the differences of the A atoms, we can naturally expect some differences among these compounds. Firstly the lattice constants of these materials are more or less determined by the atomic volume of . Taking the atomic volume, defined by (atomic weight/mass density), of the elements: Y, Zr, Lu and Hf (cm3/mol), respectively, we can see that the lattice constants in Table 1 follow the same tendency.
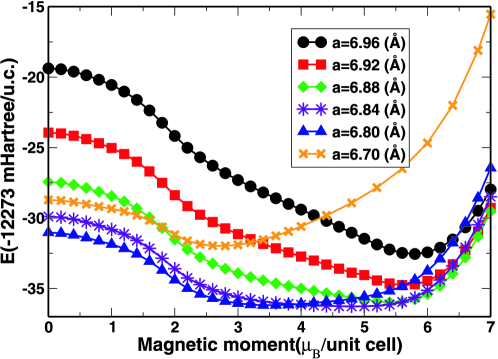
Secondly their magnetic moments have different behaviors under pressure. The dependence of the magnetic moment on the lattice constants are shown in Figure 4. The corresponding hydrostatic pressures are shown on the upper abscissas.
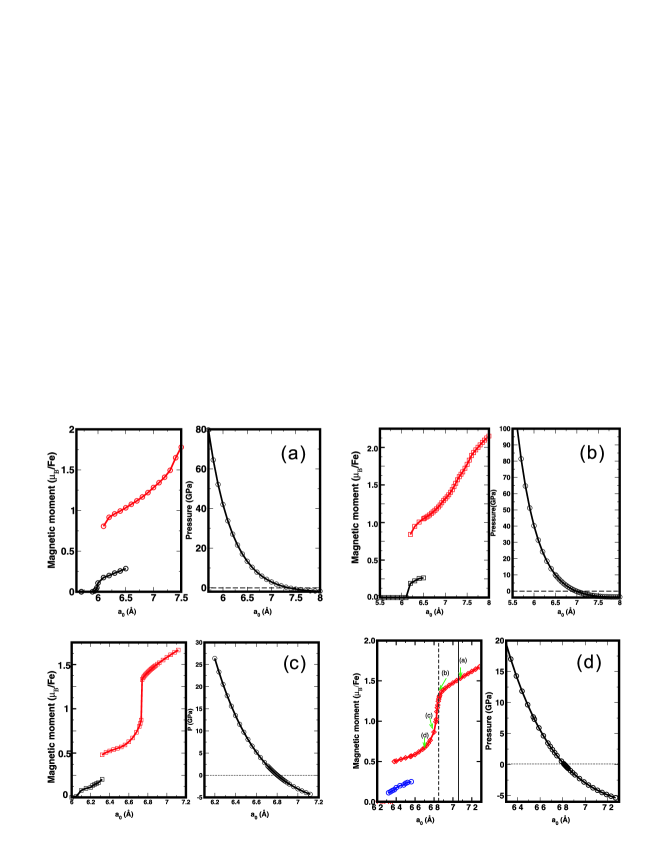
Obviously all of them show a decrease of the magnetic moment with the decrease of the lattice constant as expected from the itinerant electron magnetism, but the Hf and Zr compounds show a more rapid decrease of the moment at a lattice constant around Å (in the vicinity of the equilibrium lattice constant), while the other two show a gradual decrease at this low pressure. At high pressure, all four compounds show at least one first order transition to a lower or zero spin state. The differences are quite understandable by examining the differences of the electron numbers of the compounds under the assumption that the electronic structure is not so much influenced by the difference of the atoms. YFe2, ZrFe2, HfFe2, and LuFe2 show basically similar DOS as discussed before. The difference of the electron number shifts the Fermi level in these systems. Zr(4) and Hf(5) have one more d-electron than Y(4) and Lu(5), so the Fermi levels of the former are shifted towards higher energy, closer to the pronounced peak of the minority spin DOS as shown in Figure 1. This accounts for the low pressure instability of the moment.
The four compounds show multi-step magnetic transitions. This process can be understood by the particular DOS of these compounds. Taking ZrFe2 as an example, the DOS at different lattice constants are shown in Figure 5 (ad). The lattice constants of each figure are indicated by the arrows in Figure 4(d) with the corresponding labels of (a), (b), (c), and (d).
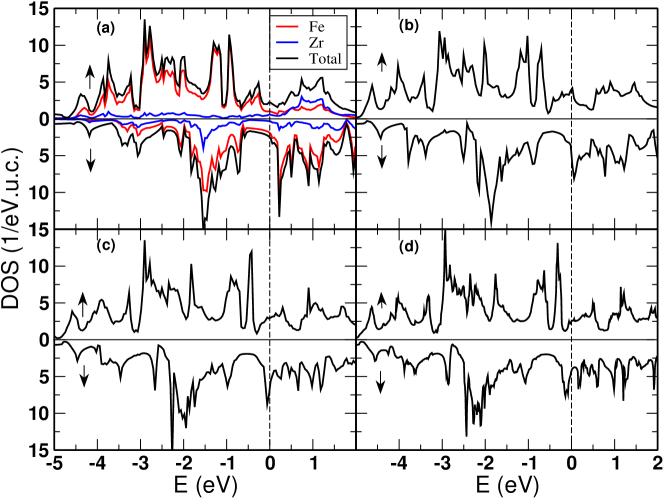
From Figure 5(a), it is obvious that at the experimental lattice constant the DOS of the up spin, contributed mainly from Fe, has a gradual increase below the Fermi level, while the DOS of the down spin has a wide ( 0.8 eV) dip below and a sharp increase just above . Applying pressure will broaden the band and reduce the width of the dip and decrease the magnetic moment. Thus the exchange splitting is reduced. The DOS of the up spin and down spin moves towards each other. This gradual decrease of the magnetic moment is shown in Figure 4(d) between the arrows (a) and (b). The gradual decrease of the magnetic moment continues until the Fermi level passes through the high DOS peak of the minority spins, seeing Figure 5(b) and (c). Then the magnetic moment is rapidly reduced, as shown in Figure 4(d) when the lattice constant is between 6.85 (arrow (b)) and 6.80 (arrow (c)) Å.
Very small magnetic moment is developed under the high pressures in all of these compounds, as can be observed in Fig. 4. This different behaviors when approaching the quantum phase transition can be of interest both experimentally and theoretically. For the second order phase transition, the effect of fluctuation was shown to lead to novel electronic ground states in magnetic metals such as magnetically mediated superconductivity, partial or quadrupolar order and non-Fermi liquid phases. For the first order phase transition, as summarized by Pfleiderer pfleiderer , it is interesting for a number of reasons: It can drive novel electronic states, novel types of low lying excitations, or signal the existence of subtle quantum correlation effects. In general, peaks of DOS (van Hove singularities) near the Fermi level in all real materials result in a ragged free energy landscape. The shape of the DOS thus has a connection with the order of the quantum phase transition. It is necessary to give some hints about the order of the transition based on our calculations of electronic structures. By the simplified Stoner model, the magnetic free energy of the system in the rigid band model is expressed by shimizu65
| (2) |
where is exchange splitting as a function of magnetic moments , and is the Stoner parameter. The can be expanded as a power series of :
| (3) |
where
| (4) | |||||
| (5) | |||||
| (6) | |||||
is defined as the -th order derivative of the density of states at the Fermi level with respect to the energy
Then the free energy is
| (7) |
The stability of the phase can be discussed in line with Landau’s theory of second order phase transitions. Magnetic instability is necessarily given by the condition that , which is equivalent to the Stoner criterion by considering Equ. (4).
The necessary condition to have a first order transition is , , and if higher order terms than are neglected in Equation (7). This means the DOS at the Fermi level should be sufficiently small (the Stoner criterion is not fully satisfied) and the curvature of the DOS at EF is positive and large, so that is positive and large enough to give negative , otherwise, if , is definitely positive. These first two conditions require that the Fermi level is at a narrow valley of the DOS.
Direct FSM calculation results and the corresponding DOS to analyze the transition were added to the above qualitative analysis. The first example is ZrFe2, which shows the first order transition to the non-magnetic state. The FSM energy curves are shown in Figure 6 at lattice constants around the transition point.
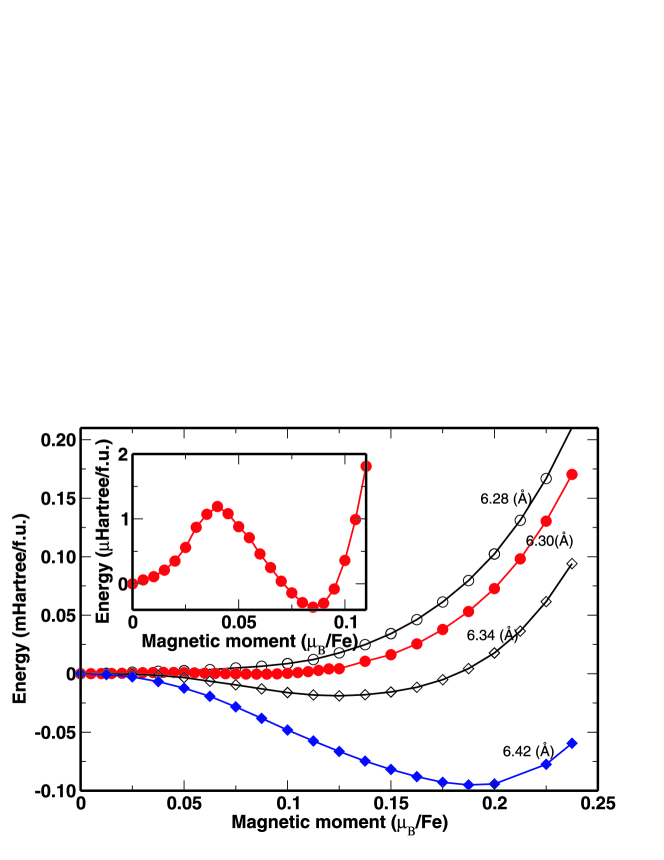
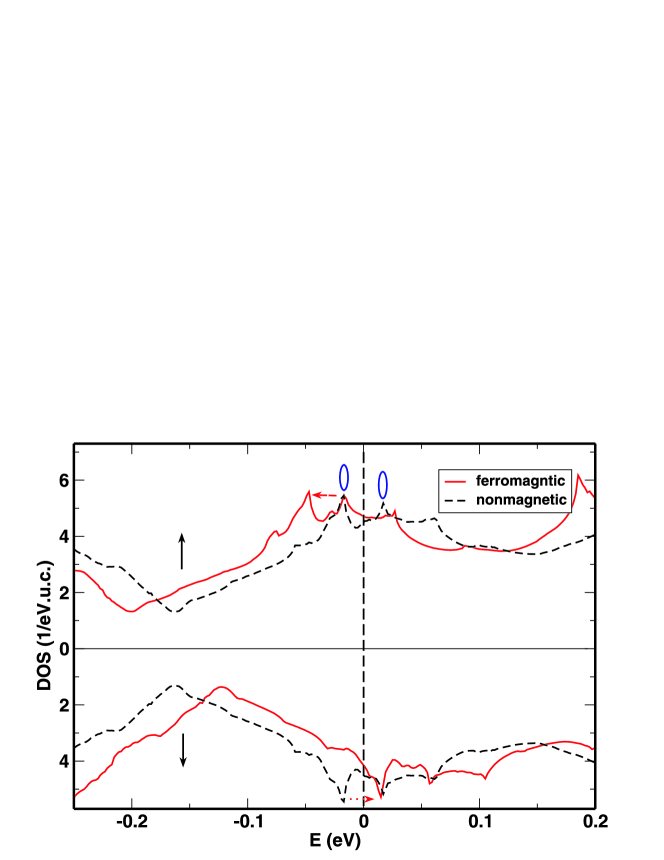
The curves at a=6.30 Å are enlarged in the inset. It clearly shows two energy minima at m=0 and m=0.085 /Fe. The DOS of the related nonmagnetic and magnetic solutions are shown in Figure 7. It is clear that the Fermi level (the dashed vertical line in the figure) is at a dip (between two peaks marked by two ellipses) of the nonmagnetic DOS. At the magnetic solution, the two subbands are shifted against each other as shown by the dashed horizontal arrows.
The other example is YFe2 where the magnetic transition is the second order. The FSM curves are shown in Figure 8.
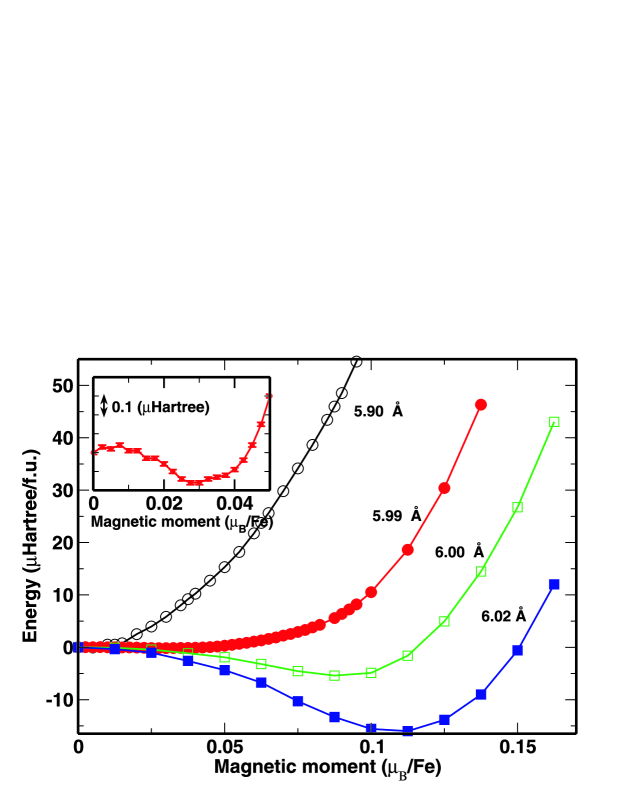
The energy minimum moves to zero when compressing the lattice as shown in the figure. The energy curve at a=5.99 Å is zoomed in and shown in the inset. The FSM energy difference of small magnetic moments reaches the accuracy limit guaranteed by the code. This is the reason that we should use the DOS in order to discuss the possible magnetic solutions. The DOS of nonmagnetic and ferromagnetic states are shown in Figure 9.
It is clear that the “valley” character around the Fermi level is missing compared with Figure 7. Rather, is situated at a plateau which cannot have more than one magnetic solutions. The other two compounds, LuFe2 and HfFe2 show similar second order transition.
V The magnetostriction Invar model
Understanding the Invar effect, however, has been a problem for half of the century. More than twenty different models have been published in the past 50 years for explanation of the Invar effect. A general review about the Invar effect can be found, for example, in handbooks edited by Buschow and Wohlfarth wasserman , and references therein. One model called 2-model weiss is based on the hypothesis of Weiss that there exist two separated energy minima with different volumes and magnetic states: High spin (HS) at high volume and low spin (LS) at low volume states. First principle calculations of Fe3Ni by Entel entel and other authors supported the 2-model. Entel argued that the special position of the Fermi level in the minority band, being at the crossover between nonbonding and antibonding states, is responsible for the tendency of most Invar systems to undergo a martensitic phase transition. Two minima binding curves should lead to some discontinuity (a first order transition) in the pressure dependence of certain physical properties, such as volume, magnetic moment etc., but this kind of discontinuity has never been observed in Invar alloys as far as we know. This gives an obstacle in applying the 2-model to explain the Invar effect.
The HS-LS transition can also be continuous and it is in the Invar alloy like ZrFe2 and HfFe2 as in Figure 4, This point can be clearly illustrated by our FSM calculations. In the FSM energy curves, the energy minimum shifts to the lower magnetic moments as the lattice constant is decreased as in Figure 10. Here the FSM energy curves of ZrFe2 is taken as an example. The quite flat FSM energy curves, which means a large spin susceptibility, near the transition region, because the average DOS at the Fermi level is large. The reciprocal susceptibility, , is given by kueblerbook
| (8) |
where is the Stoner parameter.
Thermal excitations cause loss of the magnetic moment leading to a magnetic transition from the HS state to the LS state. Therefore, increase of the temperature leads to gradual loss of the spontaneous volume expansion associated with the ferromagnetic state. This gradual process, contrary to the two states (HS and LS) in some Invar alloy (e.g. Fe3Ni), will not cause any discontinuity in the pressure dependence of physical properties. In our compounds ZrFe2 and HfFe2 the gradual decrease of the magnetic moment is the essential difference, compared with the discontinuity present in a typical Invar system as Fe3Ni.
As an important character of Invar alloy, the spontaneous volume magnetostriction is calculated by Equ.(1). The results are listed in Table 1, together with the experimental data available shiga . The theoretical values agree with the experimental ones in the sense that they are at the same order. The overshooting of the spontaneous volume magnetostriction () can partly be from the non-vanishing local magnetic moment above the transition temperature in the experiments, while in our model it is in a Pauli paramagnetic state where the spin moment is zero. The cure for this problem requires a more realistic treatment of the paramagnetic phase. It has been shown that a noncollinear Schilfgaarde or a disordered local moment (DLM) crisan ; Khmelevskyi03 model gives a better agreement with the experiments. Nevertheless, the results presented here show the major characteristics of Invar alloy: Compared with the compounds where no Invar anomaly is observed, the spontaneous volume magnetostriction is larger. In typical Invar alloy, such as Ni35Fe65 and Fe72Pt28, and shiga , respectively. At the same time, we see that the values of of YFe2 and LuFe2 are also large. Why do they not show Invar anomalies?
Take a simple ansatz of the temperature dependent volume of a magnetic solid below its Curie temperature (Tc),
| (9) |
where is the volume at , is the “non-magnetic” thermal expansion coefficient from phonon and electron contributions, and is the magnetic contribution to the volume variation, with normalized magnetic moment and at normalized temperature . is the saturation magnetization at T=0. The thermal expansion now reads,
| (10) | ||||
| (11) | ||||
| (12) |
In order to have a zero thermal expansion , we require that
| (13) |
This shows that the curve should follow the same behavior as , scaled by a factor of . As we know that the temperature dependent magnetic phase transition is of second order, so is a continuous function of . Thus should also be continuous. On the other hand, the large decrease of the moment should take place near the equilibrium volume at Tc because our reference point is Tc. In order to show the Invar anomaly, the rapid decrease of the magnetic moment should be near the equilibrium lattice constant at ambient conditions. This requirement excludes the Y, Lu compounds from Invar alloy, where the decrease of the magnetic moment begins too far away from the equilibrium volume. Doping of suitable atoms which shifts the Fermi level to the proper place can make this transition meet the requirement.
VI Conclusions
To conclude, we studied the electronic structure and the magnetic moment behaviors of four cubic Laves phase iron compounds. The magnetic moment is found to decrease when the lattice constant is decreased, and finally disappears. The way of the magnetic moment approaching zero can be continuously and discontinuously depending on the geometrical characters of the density of states. It can be understood by the Landau’s expansion of the magnetic free energy. Invar anomalies in these compounds can be partly explained by the current work when the fast continuous magnetic moment decrease at the decrease of the lattice constant was properly considered.
Acknowledgements.
Discussions with M. Richter are greatly acknowledged. One of the authors, W.X. Zhang, thanks DAAD for the financial support. Financial support from “863”-projects (2015AA03130102) and Research Grant of Chinese Central Universities (ZYGX2013Z001) are acknowledged.References
- (1) B. Kiefer and D. C. Lagoudas, Phil. Mag., 85, 4285-4329(2005).
- (2) E.F. Wasserman, in Ferromagnetic materials, A handbook on the properties of magnetically ordered substances, edited by K.H.J. Buschow and E.P. Wohlfarth, vol. 5. Elsevier Science Publishers.
- (3) S. Khmelevskyi, A.v. Ruban, Y. Kakehashi, P. Mohn and B. Johansson, Phys. Rev. B, 72, 064510(2005).
- (4) S. Hong, C.L. Fu, Phys. Rev. B 66, 094109 (2002).
- (5) B.M. Klein, W.E. Pickett, D.A. Papaconstantopoulos and L.L. Boyer, Phys. Rev. B, 27, 6721(1983).
- (6) S. Asano and S. Ishida,J. Phys.: Cond. Matt. 1,8501-8508(1989).
- (7) H. Yamada and M Shimizu, Physica B, 149,390(1988).
- (8) G. Wortmann, K. Rupprecht and H. Giefers, Hyperfine interactions, 114/115, 103-117 (2002).
- (9) J.G.M. Armitage, T. Dumelow, R.H. Mitchell, P.C. Riedi, J.S. Abell, P. Mohn and K. Schwarz, J. Phys. F: Met. Phys. 16,L141 (1986)
- (10) R.E. Cohen, I.I. Mazin, D.G. Isaak, Science275, 654(1997).
- (11) W.X. Zhang, K. Koepernik, M. Richter, H. Eschrig, Phys. Rev. B, 79,155123(2009).
- (12) K. Koepernik and H. Eschrig, Phys. Rev. B, 59, 1743(1999).
- (13) J. P. Perdew and Y. Wang, Phys. Rev. B, 45, 13244 (1992).
- (14) J.P. Perdew, K. Burker, and M. Ernzerhof, Phys. Rev. Lett.,77,3865 (1996).
- (15) R. L. Johnston and R. Hoffmann,Z. Anorg. Allg. Chem.,616, 105-120,(1992).
- (16) M. Isoda and S. Mori, J. Phys. Soc. Jpn. 69, 1509(2000).
- (17) C. Pfleiderer, J. Phys.: Cond. Matt.,17, S987-S997(2005).
- (18) M. Shimizu, Proc. Phys. Soc., 86,147(1965).
- (19) R. J. Weiss, Proc. Phys. Soc., 82, 281-288(1963).
- (20) P. Entel, E. Hoffmann, P. Mohn, K. Schwarz, V.L. Moruzzi,Phys. Rev. B, 47, 8706(1993).
- (21) J. Kübler, Theory of Itinerant Electron Magnetism, Oxford science publications, 2000.
- (22) M. Shiga, Y. Muraoka and Y. Nakamura,J. Magn. Magn. Mater., 10,280(1979).
- (23) M. van Schilfgaarde, I.A. Abrikosov, B. Johansson, Nature, 400, 46(1999).
- (24) V. Crisan, P. Entel, H. Ebert, H. Akai, D. D. Johnson, and J.B. Staunton,Phys. Rev. B,66,14416 (2002).
- (25) S. Khmelevskyi, I. Turek and P. Mohn, Phys. Rev. Lett., 91, 037201(2003).