Perplexing correlations between Gamma-ray emission and parsec-scale jet orientation variations in the BL Lac object S5 0716+714
Abstract:
The analysis of -ray flux variability along with the parsec-scale jet kinematics suggests that the high-energy radiation in the BL Lac object S5 0716+714 has a significant correlation with the mm-VLBI core flux density and with the local orientation of the inner jet flow. For the first time in any blazar, we report a significant correlation between the -ray flux variations and the variations in the local orientation of the jet outflow (position angle). We find that the -ray flux variations lead the 7 mm VLBI core flux variations by 8232 days, which suggests that the high-energy emission in S5 0716+714 is coming from a region located 3.81.9 parsecs closer to the central black hole than the “core” seen on the mm-VLBI images. The results imply a strong physical and casual connection between -ray emission and the inner jet morphology in the source.
1 Introduction
The tendency for the parsec-scale jets to change their orientation with time has been well established via long term VLBI studies on several AGN. Jet orientation variations – non-radial motion, helical paths of the jet features, curved jet structures, and variations in the direction of the inner jet flow, i.e. position angle or jet wobbling – on sub-parsec to parsec scales are frequently observed in blazars [1; 2; 3]. The exact origin of these variations is not yet clear, although accretion disk precession, orbital motion of the accretion system, or instabilities (Magnetohydrodynamic (MHD), and/or Kelvin-Helmholtz (KH)) in the jet flow have all been suggested. In some cases the inner jet position angle (PA) variations were found to correlate with the flux density variations at radio frequencies [1; 4]. However, a correlation between -ray flux and PA variations has not been reported so far. Here we report the observed correlation of -ray flux variations with the VLBI core flux density and the direction of the inner jet outflow in S5 0716+714.
2 Results
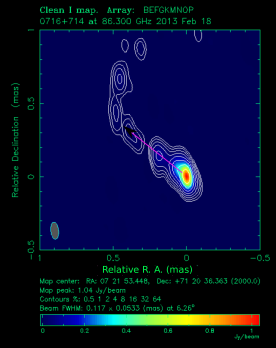
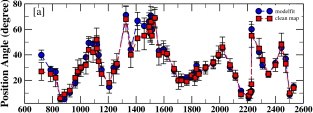
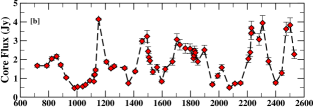
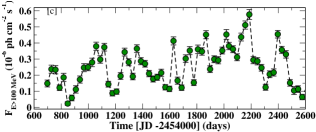
For the study presented here, we used the 7 mm and 3 mm VLBI data of the source observed between August 2008 and September 2013. The inner jet orientation variations were determined taking a flux density-weighted average of the clean delta components at 3 times above the image noise level. In an alternative approach, we measured the position angle of the innermost Gaussian model-fitting. As an example a 3 mm VLBI map of the source is shown Fig. 1 (left). In right panel, we plot the position angle (PA) variations in the central region of the jet (a), and the 7 mm VLBI core flux density variations (b). The -ray (0.1-300 GeV) data obtained by the Fermi-LAT (Large Area Telescope) were used to investigate the high-energy flux variations over the same time period. The details of observations and data reduction can be found in [3]. The monthly averaged -ray photon flux light curve is shown in Fig. 1 (c).
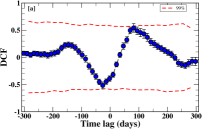
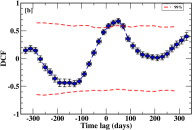
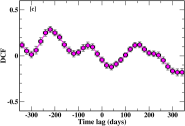
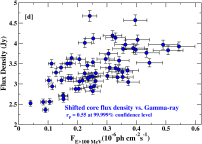
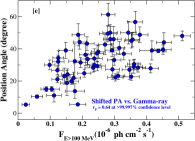
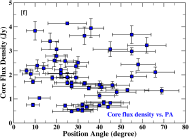
We used the discrete cross-correlation function (DCF)[5; 6] analysis method to investigate a possible correlation of -ray flux with core flux density and jet orientation variations; the results are presented in Fig. 2 (top). We found a significant correlation between -ray and core flux density variations with the former leading the latter by a time lag of 8239 days (Fig. 2 a). The observed time lag places the -ray emission region upstream of the mm-VLBI core by (3.81.9) parsec (deprojected using a viewing angle, and apparent jet speed =10) [3]. In Fig. 2 (d), we show the time shifted (by the observed time lag) 7 mm VLBI core flux density plotted vs. the -ray photon flux. A clear correlation among the two can be seen, which is confirmed by a linear correlation analysis, yielding = 0.55 and 99.999 confidence level, where is the linear Pearson correlation coefficient. The DCF analysis also suggests that the -ray flux variations correlate significantly with the PA variations (Fig. 2 b), which is also confirmed by a linear correlation analysis with = 0.64 at 99.997 confidence level. The shifted PA vs. -ray photon flux plot is shown in Fig. 2 (e). Since the -ray flux variations correlate with both the core flux density and PA variations, we would also expect a correlation between core flux density and PA variations. The formal DCF analysis however does not reveal a significant correlation between core flux density and the PA variations (see Fig. 2 c). We note that the absence of a significant correlation between the two does not rule out a weak correlation or much more complex behavior. A ring like pattern in the core flux density vs. PA plot (Fig. 2 f) could be a hint of such a more complex behavior.
3 Summary and Conclusions
The observed correlations of the -ray photon flux variations with the inner jet orientation and the 7 mm core flux density variations can be interpreted as a moving shock propagating down a relativistic jet with non-axisymmetric pressure or density gradients/patterns, or a shock moving in a bent jet. Alternatively, instability patterns moving downstream and passing the two emission regions at different viewing angles, or even a rotation of the helical jet around its own z-axis, would cause very similar variations [3]. Correlated variations can be expected if the two emission regions share same boosting cone. A correlated variation between the core flux density and the inner jet orientation is expected in a simple geometrical interpretation. The absence of such a correlation suggests that there are some unknown factors (e.g. opacity) in addition to geometry which suppress the core flux density and jet orientation correlation. High-frequency VLBI monitoring with denser time sampling would be required to better understand the jet morphology and it’s relation to the -ray emission.
Acknowledgments. The -LAT Collaboration acknowledges support from a number of agencies and institutes for both development and the operation of the LAT as well as scientific data analysis. These include NASA and DOE in the United States, CEA/Irfu and IN2P3/CNRS in France, ASI and INFN in Italy, MEXT, KEK, and JAXA in Japan, and the K. A. Wallenberg Foundation, the Swedish Research Council and the National Space Board in Sweden. Additional support from INAF in Italy and CNES in France for science analysis during the operations phase is also gratefully acknowledged. This study makes use of 43 GHz VLBA data from the VLBA-BU Blazar Monitoring Program (VLBA-BU-BLAZAR; http://www.bu.edu/blazars/VLBAproject.html). This research has made use of data obtained with the Global Millimeter VLBI Array (GMVA), which consists of telescopes operated by the MPIfR, IRAM, Onsala, Metsähovi, Yebes and the VLBA. The data were correlated at the correlator of the MPIfR in Bonn, Germany. The VLBA is an instrument of the National Radio Astronomy Observatory, a facility of the National Science Foundation operated under cooperative agreement by Associated Universities, Inc.
References
- (1) S. Britzen, V. A. Kam, A. Witzel, et al., Non-radial motion in the TeV blazar S5 0716+714. The pc-scale kinematics of a BL Lacertae object, A&A 508 (Dec., 2009) 1205–1215, [arXiv:1001.2126].
- (2) M. L. Lister, M. F. Aller, H. D. Aller, et al., MOJAVE. X. Parsec-scale Jet Orientation Variations and Superluminal Motion in Active Galactic Nuclei, AJ 146 (Nov., 2013) 120, [arXiv:1308.2713].
- (3) B. Rani, T. P. Krichbaum, A. P. Marscher, et al., Jet outflow and gamma-ray emission correlations in S5 0716+714, A&A Letter 571 (Nov., 2014) L2, [arXiv:1410.0196].
- (4) X. Liu, L. Mi, B. Liu, and Q. Li, Correlations between the peak flux density and the position angle of inner-jet in three blazars, AP&SS 342 (Dec., 2012) 465–473, [arXiv:1208.0896].
- (5) B. Rani, T. P. Krichbaum, L. Fuhrmann, et al., Radio to gamma-ray variability study of blazar S5 0716+714, A&A 552 (Apr., 2013) A11, [arXiv:1301.7087].
- (6) R. A. Edelson and J. H. Krolik, The discrete correlation function - A new method for analyzing unevenly sampled variability data, ApJ 333 (Oct., 1988) 646–659.