On the generation of triaxiality in the collapse of cold spherical self-gravitating systems
Abstract
Initially cold and spherically symmetric self-gravitating systems may give rise to a virial equilibrium state which is far from spherically symmetric, and typically triaxial. We focus here on how the degree of symmetry breaking in the final state depends on the initial density profile. We note that the most asymmetric structures result when, during the collapse phase, there is a strong injection of energy preferentially into the particles which are localized initially in the outer shells. These particles are still collapsing when the others, initially located in the inner part, are already re-expanding; the motion of particles in a time varying potential allow them to gain kinetic energy — in some cases enough to be ejected from the system. We show that this mechanism of energy gain amplifies the initial small deviations from perfect spherical symmetry due to finite fluctuations. This amplification is more efficient when the initial density profile depends on radius, because particles have a greater spread of fall times compared to a uniform density profile, for which very close to symmetric final states are obtained. These effects lead to a distinctive correlation of the orientation of the final structure with the distribution of ejected mass, and also with the initial (very small) angular fluctuations.
keywords:
Cosmological structure formation, gravitational clustering, -body simulation1 Introduction
That self-gravitating systems initially in highly spherically symmetric configurations can relax to virial equilibria which break this symmetry strongly has been known for several decades (Polyachenko & Shukhman, 1981; Merritt & Aguilar, 1985) and documented since then by many numerical studies (see e.g. Aguilar & Merritt (1990); Theis & Spurzem (1999); Boily & Athanassoula (2006); Barnes, Lanzel & Williams (2009); Worrakitpoonpon (2014)). This phenomenon, of formation, and argued to play a crucial role in cosmological structure formation (see e.g. Huss, Jain & Steinmetz (1999); MacMillan, Widrow & Henriksen (2006)) has come to be referred to as “radial orbit instability” (ROI). This name has been adopted since such an instability has been shown (Antonov, 1961; Fridman et al., 1984) to characterize spherically symmetric stationary solutions of the collisionless Boltzmann equation with purely radial orbits. Further it is plausible, as argued originally by Merritt & Aguilar (1985), that a similar mechanism is responsible for the formation of triaxial structures observed starting from very cold initial conditions, as in this case collapse tends to produce strongly radial orbits. Different authors (see references above) have discussed how the symmetry breaking develops during the evolution from both simple power law density profiles (e.g. Boily & Athanassoula (2006)) and from cosmological initial conditions (e.g. MacMillan, Widrow & Henriksen (2006).
In this paper we consider how the degree of the final symmetry breaking is related to the initial condition — specifically to the exponent of the initial density profile — for the case of completely cold initial conditions. Our focus on this aspect of the problem allows us to elucidate the mechanism by which the symmetry breaking actually occurs in the process of collapse from cold initial conditions. More specifically, we show in detail how fluctuations breaking spherical symmetry may be amplified by the very large energy changes characteristic of the very violent relaxation from cold initial conditions. This amplification is most effective when the energy change a particle undergoes is both large and strongly correlated with its initial radial position, leading to a maximal effect from density profiles with intermediate exponents. We underline that the mechanism we identify bringing about the amplification of the symmetry breaking operates far from equilibrium and has no apparent link to the ROI of equilibrium systems.
2 Numerical simulations
For our study we have simulated numerically, using the N-body code Gadget (Springel, 2005), the evolution from initial conditions in which particles are distributed randomly inside a sphere following a radial density profile , with in the range (the reasons for the choice of this range will be discussed below) The family of initial conditions are thus characterized by the two parameters and . We will focus here on the dependence on of the degree of symmetry breaking of the relaxed state. We have also varied systematically (for each ) in a range from a few thousand to one hundred thousand particles, and in this range of our essential results and analysis are weakly sensitive to this parameter. We will report in future work a more detailed investigation of the subtle (and numerically challenging) issue of the asymptotic large dependence of spherical symmetry breaking (Boily & Athanassoula, 2006; Worrakitpoonpon, 2014).
All results presented here are for simulations in which energy was conserved to within a tenth of a percent. For simulations with in the range this level of energy conservation has been attained using typical values of the essential numerical parameters in the GADGET code [ for the parameter controlling the time-step, and a force accuracy of ]. The cases in which is outside this range are numerically more challenging because of singularities — discussed further below — both for and in the limit . For these cases we have subjected our results to additional tests of their robustness, checking their stability in particular to smaller time-steps (see also the discussion in Joyce, Marcos & Sylos Labini (2009); Benhaiem & Sylos Labini (2015)). We have also studied carefully the effects of varying the force smoothing parameter (corresponding to its small scale at small distances), and we have found our results to be stable provided it is significantly smaller than the minimal characteristic size (see below) attained by the structure during its collapse For the simulations reported below the smoothing parameter is always in this latter range.
3 Results
3.1 Collapse and Virialization
Before turning to the central issue in this article — the dependence of the asymmetry of the final virialized state on the exponent — we consider first how various spherically averaged indicators of the global evolution of the system vary with , and how these dependencies can be understood. The results in this section are in line with numerous previous studies of cold systems with initial conditions in the class we consider, or similar ones (e.g. van Albada (1982); Aarseth, Lin & Papaloizou (1988); Joyce, Marcos & Sylos Labini (2009)). We simply focus on the quantities and behaviors which will be most relevant for our analysis of the symmetry breaking in the next section.
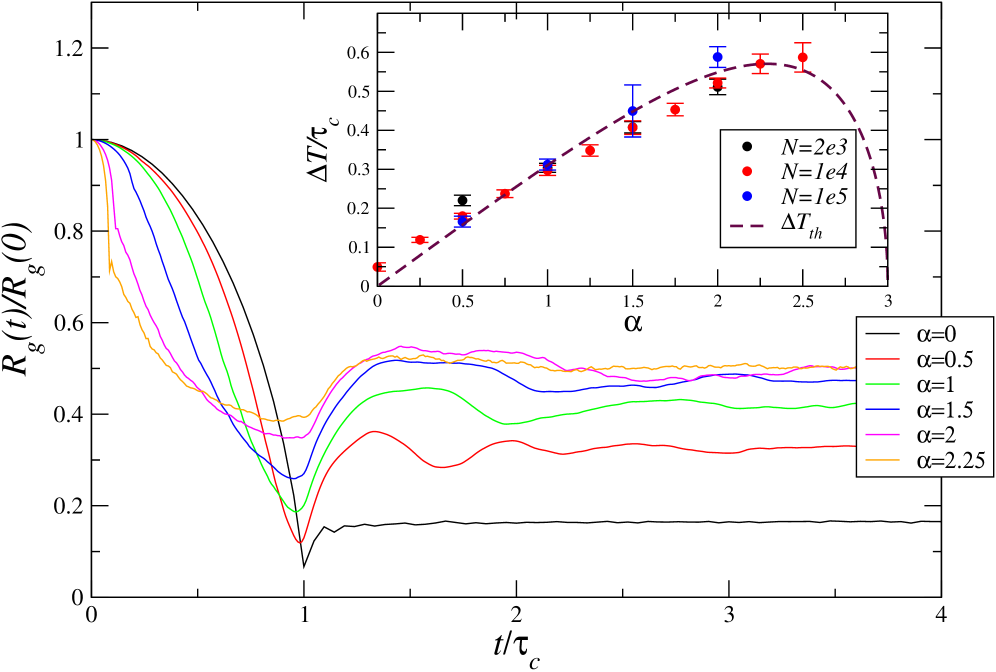
In line with previous studies of such initial conditions, we observe that the system evolves through a strong collapse followed by a re-expansion which very rapidly leads to a virial equilibrium in which most of the initial mass is bound. Fig.1 shows, for different indicated values of , the temporal evolution of the gravitational radius defined as
| (1) |
where and are respectively the mass which is bound (i.e. particles with negative energy) and the potential energy of this mass. The unit of time here is , where is the average mass density inside the radius of the initial spherical configuration, of radius . It corresponds to the time for a particle initially at the outer periphery (i.e. at ) to fall to the center, in the continuum approximation (i.e. taking keeping the initial mass density profile fixed) and without shell crossing. The scale is a measure of the characteristic size of the system, and we observe in all cases, to a first approximation, the same qualitative behavior — a collapse to a minimal size attained around followed by a re-expansion and stabilization. In all cases the bound particles form a virialized structure, with the virial ratio (which we do not display here) showing a very similar qualitative behaviour to that of but with a final value close to in all cases. There is, however, also a clear trend with : the smaller is , i.e. the closer to flat the density, the more violent is the collapse, with the system reaching a deeper minimum in a shorter time 111 We do not show data for in Fig.1 because the potential energy diverges for in the limit . As a measure of the characteristic size of the system we have used in this case the radius containing of the mass. . Further, we note that the larger is the denser are the inner shells of the cloud and the sooner the collapse starts.
The variation of the characteristic time for the collapse and re-expansion with is quantified in the inset in the figure. It shows, as a function of , the measured time estimated as the difference between the two times at which defined as where is the estimated asymptotic value of at . The continuous curve, which has been extended to , is obtained from the following simple considerations. We work in the approximation that departure from spherical symmetry, and also the effects of shell crossing, can be neglected. For an initial mass density with radial profile for , and zero for , mass at an initial radial distance from the center will then fall to the center in a time , where is the initial mass density of the sphere of radius . The distribution of these fall times to the origin can then be calculated using (where is the total mass). One finds
| (2) |
for (and otherwise). The spread in the fall times can be characterized by the variance of ,
| (3) |
This expression, plotted in the inset of Fig. 1, reaches a maximum at , and goes to zero for both and . For , all particles fall to the origin at (the well-known singularity of the canonical “spherical collapse model”), while as steepens towards almost all of the mass is initially at small radii with fall times which are very small compared to . In the inset of Fig. 1, we see that Eq. (3) traces well the behavior of the measured up to . Thus, up to this value, the characteristic time of the variation of the total potential indeed just reflects the spread in the particles’ fall times. Further for larger the behavior of and indeed reflect the qualitative change in behavior of the collapse we observe in our simulations: while the collapse is completed only at when the outermost mass falls, most of the mass falls at very much shorter times. It is for this same reason that accurate numerical integration becomes more costly as increases and we report results only up to .
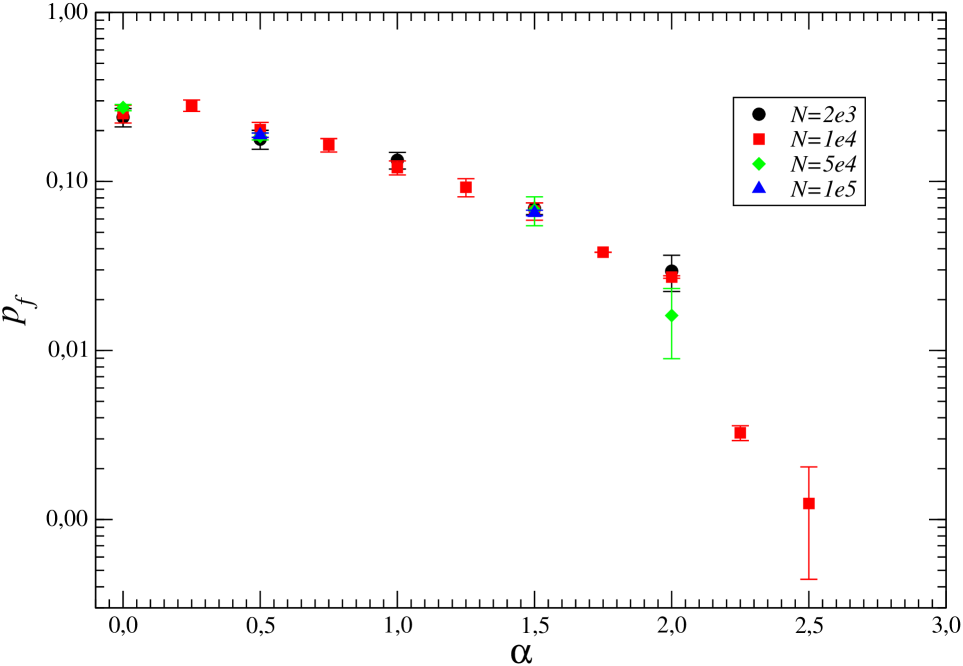
One other macroscopic feature of relaxation from cold initial conditions of this kind, which will be relevant in our discussion below, is that they often lead to mass ejection i.e. some particles gain enough energy so that their total energy is positive and they can escape to infinity. We show (see also Sylos Labini (2013)) in Fig. 2 the fraction of the particles with positive energy after relaxation (at ), for different (and ). The observed behavior as a function of — maximal ejection at , followed by a monotonic decrease (approximately exponential) with in a range until , beyond which there is a much sharper drop — is clearly related to the qualitative behavior of the fall times discussed above. This will be seen more explicitly in our analysis below.
3.2 Symmetry breaking of relaxed state
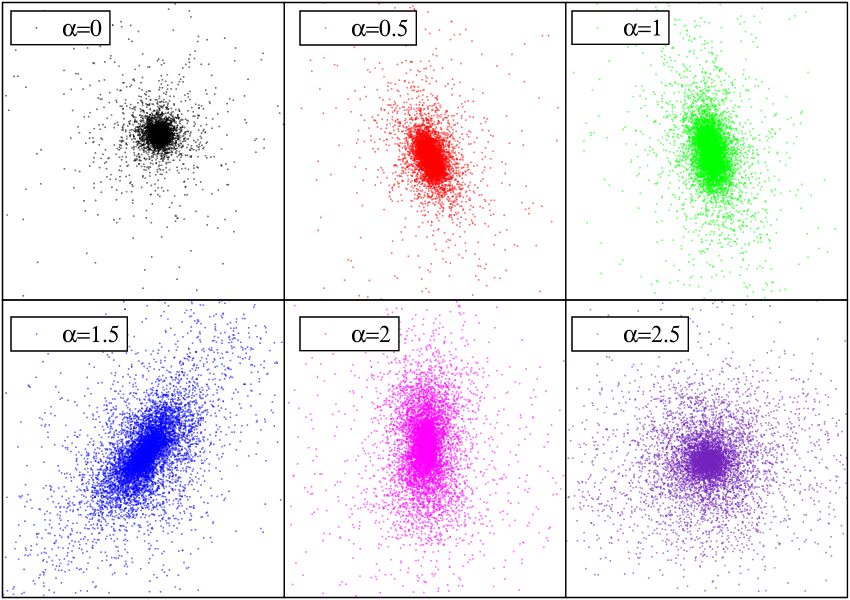
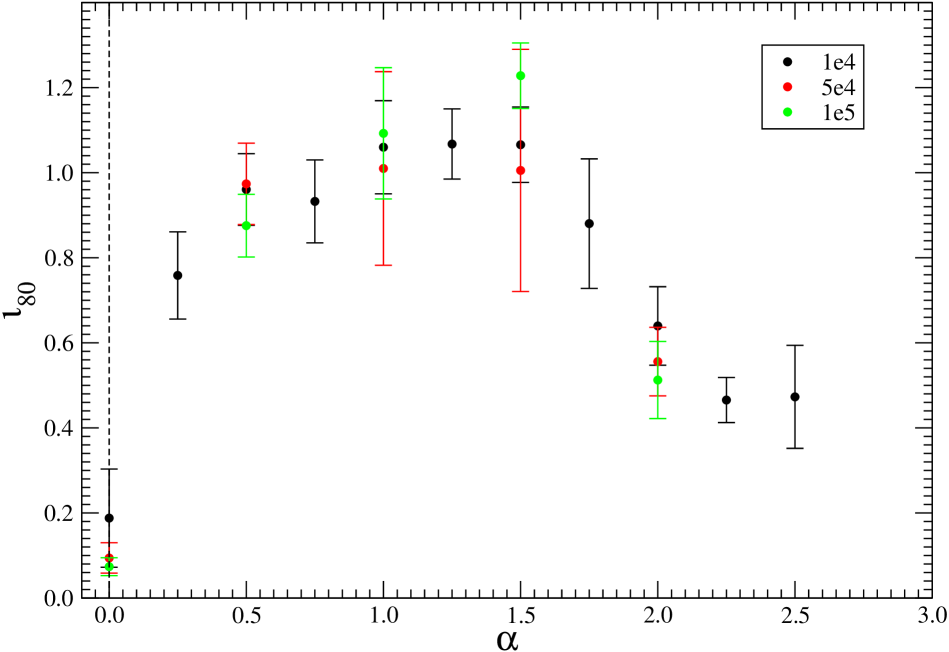
We focus now on the question of how the symmetry breaking in the final state depends on the exponent characterizing the density profile of the initial condition. Shown in the upper plots of Fig. 3 are a projection in a chosen plane of the resulting virialized configurations for the various indicated values of , for simulations with . Visual inspection suggests that the breaking of spherical symmetry is apparently strongest in the intermediate values of , and weakest for the case . This is confirmed by Fig. 3 (lower panel) which shows, as a function of , the parameter (the “flattening ratio”) of the relaxed state defined as
| (4) |
where and are, respectively, the largest and smallest of the three eigenvalues of the moment of inertia, and the subscript indicates that the estimate is made on the % of particles which are most bound (we take here following common practice in the literature). We do not show here any information about the intermediate eigenvalue , but analysis of it shows that it is typically not close to the value of either of or , i.e. the relaxed structures are quite triaxial. For each the different points in the lower panel in Fig. 3 correspond to the indicated values of , and the error bars to the standard deviation measured over the indicated number of realizations in each case. The plot shows clearly — in agreement with previous studies of these initial conditions (e.g. Aarseth, Lin & Papaloizou (1988); Joyce, Marcos & Sylos Labini (2009); Barnes, Lanzel & Williams (2009); Worrakitpoonpon (2014)) — that the final state in the case is in fact very close to spherically symmetric. Further we note that above there is a clear trend towards progressively weaker symmetry breaking, albeit with a lesser suppression than in the case . We have checked and confirmed that these trends of with are also observed with different values of P in the calculation of .
In the light of the discussion in the previous section, these lots suggest a possible correlation between the observed asymmetry and the qualitative behavior of the spread in the fall times. Further the (relative) suppression at larger suggests that there may be some connection between the ejection of matter and the degree of symmetry breaking.
How are particles’ fall times related to the final state, and in particular its asymmetry? In the relaxation process from such cold initial conditions, particles energies change greatly as they move in the time dependent mean field. Indeed this is the essence of “violent relaxation” as originally described by Lynden-Bell (1967). It can be verified directly, by tracking the energy of individual particles, that the energy change of any given particle occurs essentially as it passes through the center of the collapsing/re-expanding structure. This is the case simply because the mean field is most intense and most rapidly varying at this time. As a consequence this energy change depends essentially on the time window in which the particle passes through this central region. The correlation between initial radial position and fall time — which is strong except in the limit where all particles have the same fall time (modulo finite fluctuations) — might thus be expected to lead to a correlation between the energy change of a particle and its initial radial position.
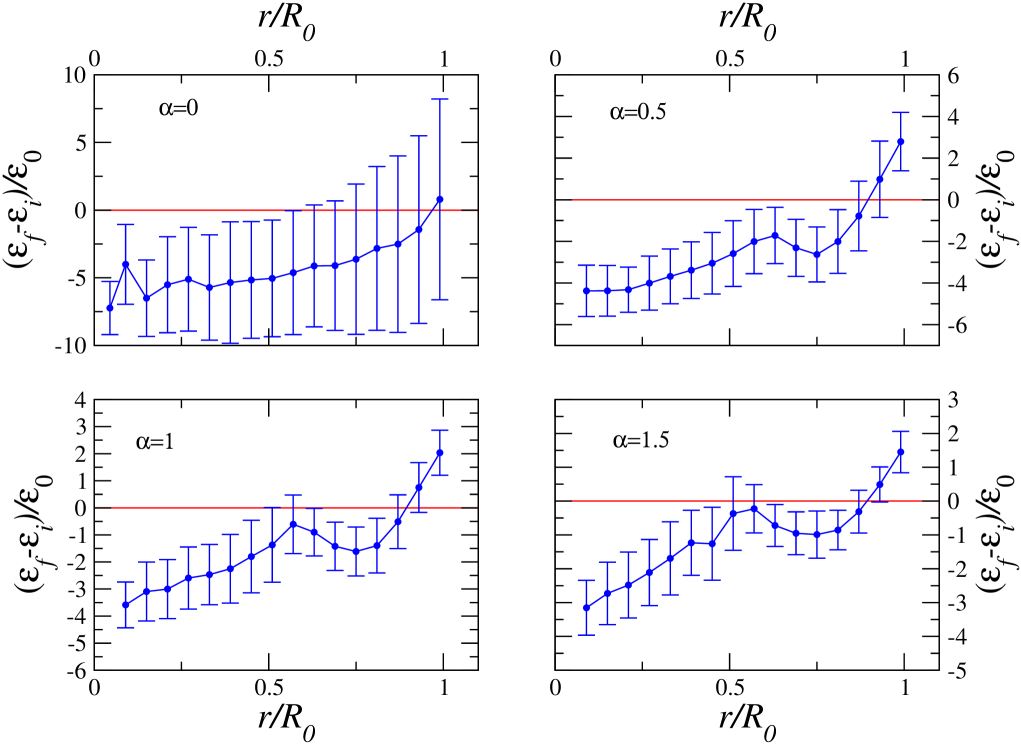
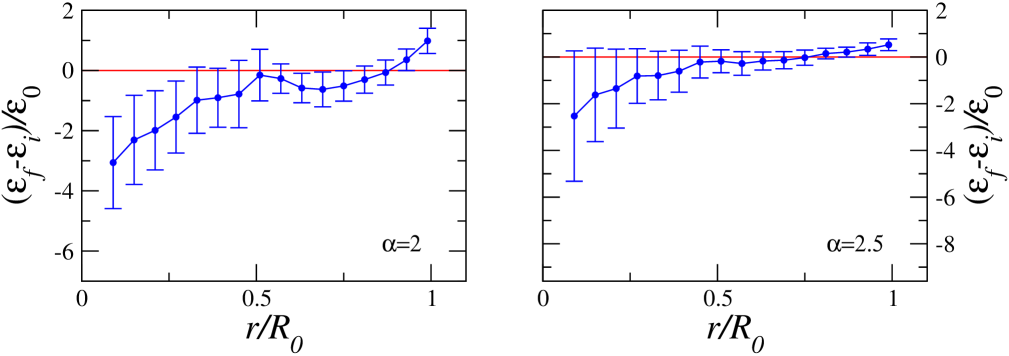
To see whether this is indeed the case we plot in Fig.4 the total energy change, i.e. the difference between initial energy and the energy measured at a time well after the collapse, when the stationary state has been reached, averaged in bins, as a function of their initial radial position, for simulations with . As anticipated we see that, except for the case , there is indeed a very clearly identifiable correlation between energy change and initial position: up to a large positive energy boost is obtained by a large fraction of the particles in the outer shells, while at the larger values of large energy decreases are experienced by the particles in the inner shells. The explanation for these features, and for the behavior in the case , is closely related to our discussion of the previous section. As noted, particles’ energies change essentially as they pass through the center of the structure, and what determines the energy change is the temporal variation of the mean field they move in at this time.
The behavior of the mean-field potential at any point in the center of the structure reflect approximately that of the total potential shown in Fig.1. Particles which pass through the center in the phase before the minimum is reached, at , will tend to lose energy because they climb out of a deeper potential than they fall into, while the converse will be true for particles which pass through the center as the system is re-expanding. These latter receive an energy boost, which has been noted to be at the origin of the mass ejection in both the case of cold collapse (Joyce, Marcos & Sylos Labini, 2009; Sylos Labini, 2012, 2013) and in merging structures (Carucci et al., 2014). Thus the trend we observe with is clearly linked to that we discussed of the distribution of fall times : for small , a significant amount of the mass “falls later” and acquires an energy boost, while at larger most of the mass “falls early” and loses energy. For , on the other hand, the correlation between the energy change of a particle and its initial position is very markedly weaker, because in this case the time of fall of a particle may become correlated with its initial radial position only through the finite fluctuations (which regulate the singularity of the collapse characteristic of this case).
Let us consider now how the large energy injection into the outer shells can lead to the very strong symmetry breaking of the relaxed states observed in these cases. In the limit of exact spherical symmetry, the dispersion of the energy change at any given initial radius in Fig. 4 should vanish, and the observed finite dispersion is a consequence of the spherical symmetry breaking. Indeed what this dispersion implies is that the energy injection at these large radii still depends sensibly on the direction of arrival, and not just the initial radial position.
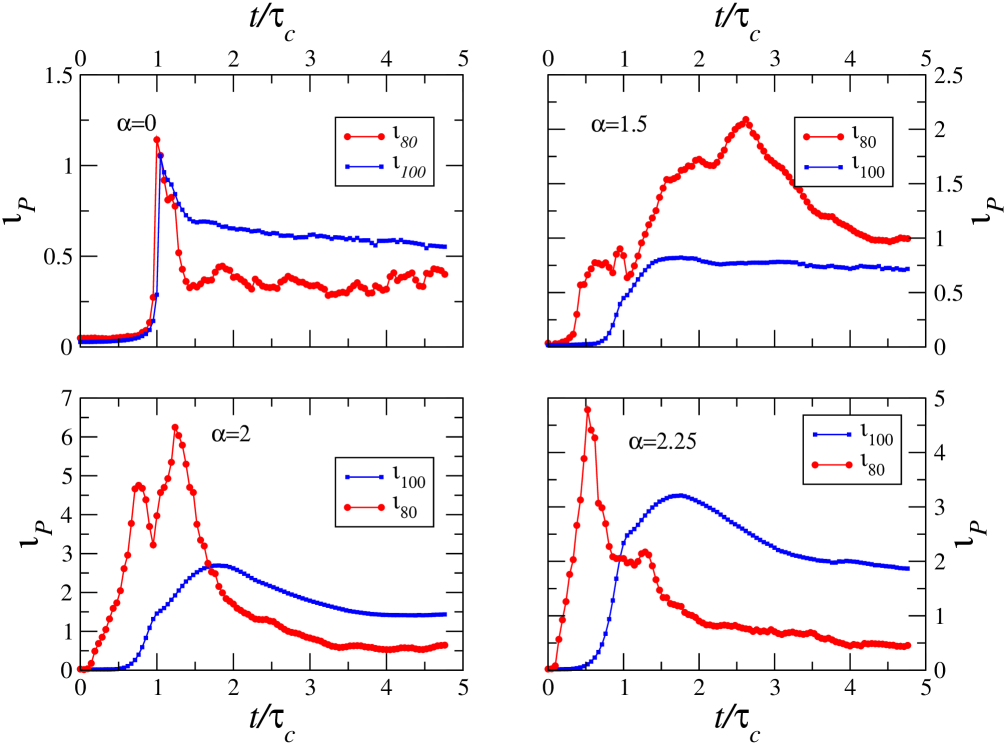
The initial system is not perfectly spherical due to Poisson fluctuations, and to a first approximation it can be described as an ellipsoid with . Therefore particles experience, during the collapse, a force of which the tangential component depends on the angle with the ellipsoid initial major semi-axis. Consequently, as can be seen in Fig.5, grows rapidly as the particles coming from the direction orthogonal to the initial major semi-axis collapse to the center in a shorter time than those along this axis: this is the Lin, Mestel & Shu (1965) instability whose effect is to amplify the initial small eccentricity. The particles initially in the outermost shells which arrive latest then travel through the rapidly decreasing potential created by the other mass which is already re-expanding, and gain energy. Note that, while for the amplification and subsequent decrease of the asymmetry to its final value occurs in a very short time around the collapse, for the system shows a few oscillations before the complete relaxation. This behavior reflects that of the gravitational radius in Fig.1. In addition, we note that for the amplification of the initial is much less marked compared to the cases with , in which the spread in fall times of the particles is much greater. For , most of mass now collapses at very short times and accordingly shows a very fast growth for followed by a decrease when the external particles pass through the center.
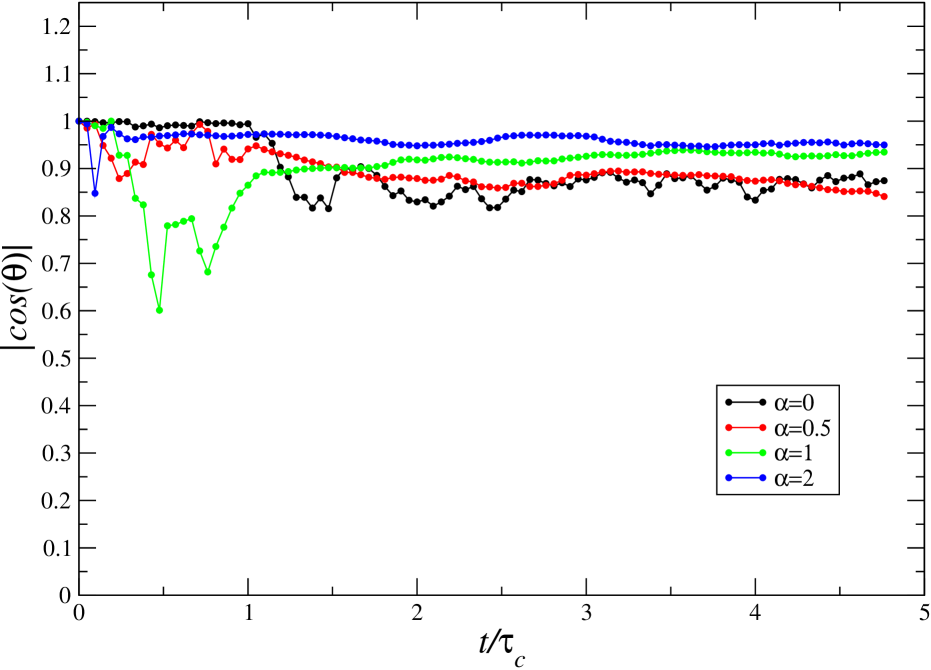
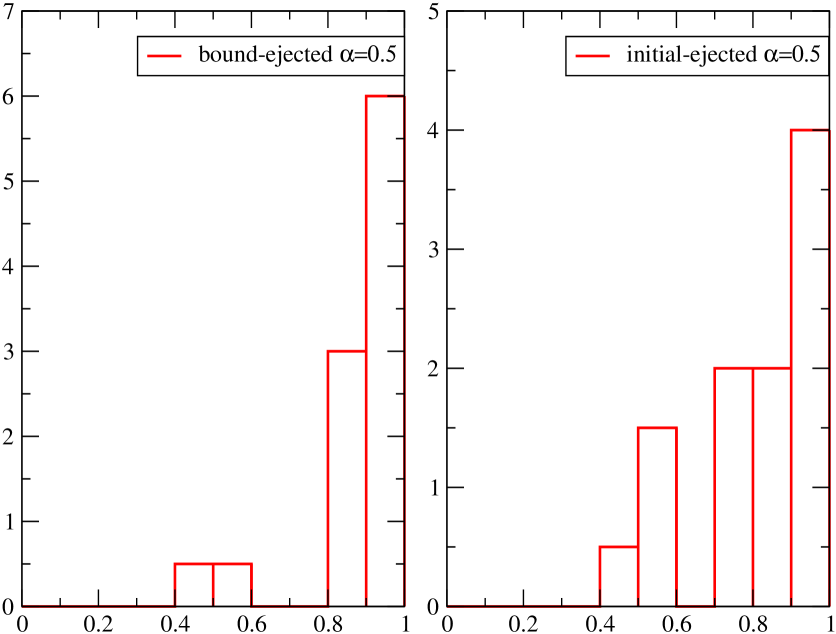
The hypothesis that the amplification of the initial triaxiality is due to finite effects via the instability described by Lin, Mestel & Shu (1965), and the subsequent role of energy gain in amplifying the triaxiality, can be tested for straightforwardly. Firstly, we would expect that the major semi-axis at any time should be correlated to its value at . Secondly, when there is a significant mass ejection, we would expect there to be a correlation between the angular distribution of the ejected particles and the orientation of the final triaxial structure, and more specifically between the preferred direction for ejection and the elongated axis of the final structure. As a measure of these spatial distributions we use simply the inertia tensor, determining its eigenvalues and eigenvectors. Fig.6 (upper panel) shows that the orientation of the major semi-axis indeed remains almost the same throughout the collapse and virialization. The left panel of Fig. 7 shows, for the case , which has both a strongly triaxial final state and significant mass ejection, a histogram of realizations of the modulus of the cosine of the angle between the eigenvectors corresponding to the smallest eigenvalues for the ejected mass and the most bound mass. There is again a very clear positive signal for the correlation of the orientation of the axes.
The right panel of Fig. 7 shows the correlation, measured in the same way, for a number of realizations, between the initial distribution and the ejected mass. We observe again a very clear correlation, and a similar result is found considering the initial and final bound mass. The reason for this strong correlation of the orientation of the longest axes is simple: the moment of inertia of the initial mass gives a measure of the small effective anisotropic due to the finite fluctuations, and more specifically the axis of the smallest eigenvalue is the axis along which the mass is “stretched” furthest away from the plane orthogonal to it passing through the center. It is precisely along such a “stretched” direction that one expects the particles to arrive slightly later than the others — just as the mass along the longest axes of an ellipsoidal distribution — and thus to receive a slightly larger energy kick. This provides further convincing evidence that the elongation of the final structure indeed has its origin in the (relative) delay in particles’ fall along these directions.
This mechanism of symmetry breaking is more efficient for in the range (see Fig. 4). There is indeed greatest symmetry breaking in the final state for intermediate values of where the energetically boosted particles are well localized in the outer radii, and where these same particles represent a significant fraction of the mass. The strong suppression of asymmetry in the case is, conversely, due to the fact that, although there are many particles which pick up large energy boosts, they come from many different parts of the initial structure. This leads to an effective averaging over the angular fluctuations and a much more spherical structure.
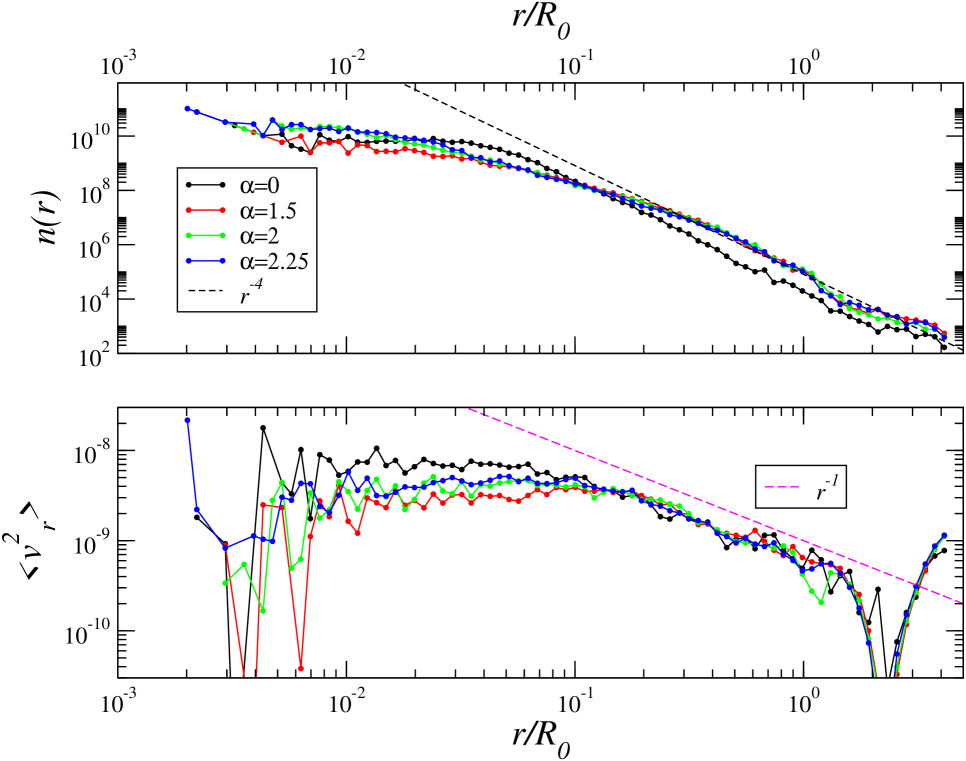
We note that for there is a markedly different behavior of and . This is a result of the fact, as seen in Fig.2, that there is no mass ejection in these cases: late-arriving particles do not gain enough kinetic energy to escape from the system. In this case there are however a significant fraction of high energy (but bound) particles which reach large distances, giving rise to a configuration that is more asymmetric than that of the most bound particles. Despite these differences the density and radial velocity profiles are very similar for all values of (see Fig.8), showing respectively a decay and as noticed by Sylos Labini (2013). However the case leads to a more compact configuration than as a consequence of the larger spread of the energy distribution.
We remark finally that a very similar dynamical process was observed by Benhaiem & Sylos Labini (2015) for the case of initial conditions given by uniform ellipsoids. In addition, we note that Theis & Spurzem (1999) considered a Plummer density profile with a very small initial virial ratio, finding that a fast dynamical collapse generates at its end the maximal triaxiality of the system: the dynamical mechanism that generates such a triaxial structure is the same at work in the power-law density profile.
4 Discussion and conclusions
In summary, the mechanism for the generation of the very strong spherical symmetry breaking observed for certain density profiles during violent relaxation from cold spherical initial conditions is essentially the existence of a preferential axis for the large “energy injection” to particles in the outer parts of the initial structure, which leads to an elongation of the final structure along the same axis. This axis is itself defined by the finite fluctuations breaking spherical symmetry in the initial conditions, corresponding to an axis along which the matter is on average further from the origin. Particles initially at larger radii along this axis fall through the collapsing region later than particles along the other axes, and as a consequence pick up a larger energy injection. After this time particle energies change negligibly, and the strong variation with energy as a function of angle along the (predominantly radial) orbits leads, after further phase mixing, to a virialized structure with a spatial structure reflecting the energy injection. In particular the major semi-axis of the final structure is correlated both with the (very slightly) long axis of the initial condition, and with that along which the energy kick obtained by particles during violent relaxation is greatest. This mechanism has no apparent relation to the instability of equilibrium systems with radial orbits. More specifically, the energy injection which is its essential ingredient occurs in a very short time during violent relaxation when the system is very far from equilibrium. The system never approaches close to an equilibrium configuration which is spherically symmetric with purely radial orbits.
The analysis presented here is of completely cold initial conditions only. We can anticipate that both how the asymmetry of the final state, and the qualitative features of the collapse leading to it, will show the same behavior as a function of for simple distributions of non-zero initial velocities, provided the initial virial ratio associated is sufficiently small (see e.g. Sylos Labini (2012), which studies in particular the energy injection and mass ejection as a function of ). Given (Polyachenko & Shukhman, 1981; Merritt & Aguilar, 1985) that warm (and, in particular, equilibrium) initial conditions are observed in many cases to give rise to triaxial structures, by a mechanism which clearly is intimately related to the ROI of equilibrium systems, we are led to the conclusion that there are (at least) two distinct mechanisms subsumed under what is usually called ROI. We note that this conclusion is not only consistent with previous studies, but gives an explanation of one of their striking (and puzzling) results, namely that when the initial virial ratio is varied, there is a critical value at which there is a qualitative change in behavior: above this value symmetry breaking occurs only if the velocity distribution is sufficiently radial, while below this value symmetry breaking occurs irrespective of whether the velocity distribution is isotropic or not (see e.g. Figure 4 of Barnes, Lanzel & Williams (2009), which locates the value at depending on the profile).
While the dependence on the velocity anisotropic is a “smoking gun” for “real” ROI operating for the warmer initial conditions, the presence of a threshold below which the details of the velocity distribution has no relevance is explained very naturally as the dominance in this region of a distinct mechanism operating far from equilibrium, during the collapse, as we have described here. A recent study (Pakter, Marcos & Levin, 2013) performs an analysis of the stability to elliptical perturbations of a uniform sphere (i.e. here) with an isotropic velocity distribution and oscillating under its mean field, and finds that there is a critical value of the initial virial ratio below which there is such an instability. Whether or not this is in fact the essential instability leading to deviation from spherical symmetry at early times during the collapses we have studied, the analysis of Pakter, Marcos & Levin (2013) illustrates that, far from equilibrium, there are indeed such instabilities even when the velocity distribution is isotropic, and which are thus physically distinct from the ROI mechanism for equilibrium systems.
We note finally that our analysis here has been for isolated systems with initial power law initial conditions in a non-expanding universe. A very similar phenomenology of symmetry breaking starting from cosmological type initial conditions in an expanding background has been described in MacMillan, Widrow & Henriksen (2006), and the ROI in this case has been linked (see also Huss, Jain & Steinmetz (1999)) to the generation of a “universal” NFW-type density profile in this context. We do not observe the ROI in our study to be associated with such a final density profile: our profiles are well characterised by a quite flat inner core and power law decay . To determine whether the specific mechanism of amplification of symmetry breaking we have described here — associated with the energy injection to material initially in the outer shells — is at play, or not, in the formation of triaxial dark matter halos in cosmological models would require further extensive study, incorporating a careful comparison between the dynamics of isolated structures and halos in the cosmological setting.
Numerical simulations have been run on the Cineca PLX cluster (project ISCRA QSS-SSG). In addition, this work was granted access to the HPC resources of The Institute for scientific Computing and Simulation financed by Region Île de France and the project Equip@Meso (reference ANR-10-EQPX- 29-01) overseen by the French National Research Agency (ANR) as part of the “Investissements d’Avenir” program.
References
- Aarseth, Lin & Papaloizou (1988) Aarseth S., Lin D., Papaloizou J., 1988, Astrophys. J., 324, 288
- Aguilar & Merritt (1990) Aguilar L., Merritt D., 1990, Astrophys. J., 354, 73
- Antonov (1961) Antonov V. A., 1961, Soviet Ast., 4, 859
- Barnes, Lanzel & Williams (2009) Barnes E. I., Lanzel P. A., Williams L. L. R., 2009, Astrophys. J., 704, 372
- Benhaiem & Sylos Labini (2015) Benhaiem D., Sylos Labini F., 2015, Mon. Not. R. Astr. Soc., 448, 2634
- Boily & Athanassoula (2006) Boily C. M., Athanassoula E., 2006, Mon. Not. R. Astr. Soc., 369, 608
- Carucci et al. (2014) Carucci I. P., Sparre M., Hansen S. H., Joyce M., 2014, JCAP, 6, 57
- Fridman et al. (1984) Fridman A. M., Polyachenko V. L., Aries A. B., Poliakoff I. N., 1984, Physics of gravitating systems. I. Equilibrium and stability.
- Huss, Jain & Steinmetz (1999) Huss A., Jain B., Steinmetz M., 1999, Astrophys. J., 517, 64
- Joyce, Marcos & Sylos Labini (2009) Joyce M., Marcos B., Sylos Labini F., 2009, Mon. Not. R. Astron. Soc., 397, 775
- Lin, Mestel & Shu (1965) Lin C. C., Mestel L., Shu F. H., 1965, Astrophys. J., 142, 1431
- Lynden-Bell (1967) Lynden-Bell D., 1967, Mon. Not. R. Astr. Soc., 167, 101
- MacMillan, Widrow & Henriksen (2006) MacMillan J. D., Widrow L. M., Henriksen R. N., 2006, The Astrophysical Journal, 653, 43
- Merritt & Aguilar (1985) Merritt D., Aguilar L. A., 1985, Mon. Not. R. Ast. Soc, 217, 787
- Pakter, Marcos & Levin (2013) Pakter R., Marcos B., Levin Y., 2013, Physical Review Letters, 111, 230603
- Polyachenko & Shukhman (1981) Polyachenko V. L., Shukhman I. G., 1981, Soviet Ast., 25, 533
- Springel (2005) Springel V., 2005, Mon. Not. R. Ast. Soc., 364, 1105
- Sylos Labini (2012) Sylos Labini F., 2012, Mon. Not. R. Astron. Soc., 423, 1610
- Sylos Labini (2013) Sylos Labini F., 2013, Mon. Not. R. Astron. Soc., 429, 679
- Theis & Spurzem (1999) Theis C., Spurzem R., 1999, Astron. Astrophys., 341, 361
- van Albada (1982) van Albada T., 1982, Mon. Not. R. Astr. Soc., 201, 939
- Worrakitpoonpon (2014) Worrakitpoonpon T., 2014, ArXiv e-prints