Role of solvation in pressure-induced helix stabilization
Abstract
In contrast to the well-known destabilization of globular proteins by high pressure, recent work has shown that pressure stabilizes the formation of isolated -helices. However all simulations to date have obtained a qualitatively opposite result within the experimental pressure range. We show that using a protein force field (Amber03w) parametrized in conjunction with an accurate water model (TIP4P/2005) recovers the correct pressure-dependence and an overall stability diagram for helix formation similar to that from experiment; on the other hand, we confirm that using TIP3P water results in a very weak pressure destabilization of helices. By carefully analyzing the contributing factors, we show that this is not merely a consequence of different peptide conformations sampled using TIP3P. Rather, there is a critical role for the solvent itself in determining the dependence of total system volume (peptide and solvent) on helix content. Helical peptide structures exclude a smaller volume to water, relative to non-helical structures with both the water models, but the total system volume for helical conformations is higher than non-helical conformations with TIP3P water at low to intermediate pressures, in contrast to TIP4P/2005 water. Our results further emphasize the importance of using an accurate water model to study protein folding under conditions away from standard temperature and pressure.
I Introduction
The dependence of protein folding equilibria on thermodynamic control variables can provide important insights into the fundamental forces which stabilize folded structures dill1990dominant . Variation of temperature is the most commonly used approach due to the ease with which this can be achieved. A detailed comparison of the temperature-dependence of protein stability with that of the hydrophobic effect, for example, strongly supports the role of hydrophobic interactions in stabilizing protein structure baldwin-1986 ; robertson-1997 .
A variable which is less exploited is pressure, due to the greater demands of the experiments required dumont2009reaching ; larios-2010 . However, it is well-known that high pressure tends to destabilize protein native structures mozhaev1996high ; silva1993pressure , indicative of a positive change of reaction volume for folding. A possible resolution of this initially counterintuitive effect kauzmann-1987 was proposed to be the existence of cavities within the folded protein hummer-1998-3 ; frye-1998 , with substantial support for this hypothesis coming from experiments on cavity-forming mutants frye-1998 ; roche-2012 . It was also proposed that high pressures can lead to water penetration of protein’s hydrophobic core due to reduced solvent-solute interfacial free energy cheung2006heteropolymer .
However, the pressure-dependence of the folding equilibria for small, independently folding elements of secondary structure such as hairpins and helices clearly cannot fit the same picture. Since they contain no evident internal cavities or well-defined hydrophobic core, any pressure dependence would have to come from other effects, which might be obscured when studying the overall folding of a globular protein. Recent experimental work on the pressure dependence of the helix-coil equilibrium, using either FTIR spectroscopytakekiyo-2005 ; imamura-2008 or triplet state quenching experimentsneumaier-2013 has in fact found the opposite trend to that for protein folding: namely a negative reaction volume for helix formation, resulting in pressure stabilization of helices for all positive pressures. The origin of this effect is not clear, especially considering the small magnitude of the volume change ( 0.2–1.0 cm3.mol-1 per residue). Molecular simulation could potentially help to explain the origin of this result; however, simulation studies of the pressure dependence of helix formation have qualitatively contradicted experimental results, finding instead helix destabilization at low to intermediate pressures, only turning over to stabilization at very high pressure paschek-2005 ; hatch-2014 ; mori-2014 .
Here, we investigate the pressure dependence of helix formation for a model 15-residue helix-forming peptide using two different force field combinations: the Amber ff03* protein force fieldbest-2009-2 together with explicit TIP3P water jorgensen-1983 and the Amber ff03w protein force field best-2010-3 with the TIP4P/2005 water model abascal-2005 . In agreement with earlier studies with TIP3P water on the effect of pressure on helix formation, we find a positive reaction volume for helix formation at low to intermediate pressures. In contrast, a qualitatively correct result is obtained with TIP4P/2005, i.e., a negative reaction volume for helix formation. This difference, obtained for the same sequence with almost identical protein force fields, suggests a key role for water. There are essentially two ways in which water can be envisaged to influence the reaction volume: (i) it may alter the conformations sampled for a given total number of helical residues, particularly for the non-helical states and (ii) different water models may be more or less closely coordinated with helical than with non-helical structures. While there is no doubt that water influences the conformational sampling, we show that in fact the different solvation of helical and non-helical states plays a key role in determining the volume changes, and for both water models opposes the much larger decrease in volume excluded to water associated with helix formation. The result obtained with TIP3P water at low to intermediate pressures is qualitatively inconsistent with experiment, as the total system volume is higher for helical structures than for non-helical structures. Our results highlight the importance of using an accurate water model for capturing biomolecular equilibria at state points away from standard conditions.
II Methods
II.1 Simulation methods
Replica exchange molecular dynamics (REMD) simulations with gromacs 4.0.7 or 4.5.3 hess-2008 were used to sample the folding of the blocked peptide Ac-(AAQAA)3-NH2 with either (i) the Amber ff03* force fieldbest-2009-2 and TIP3P water modeljorgensen-1983 or (ii) the Amber ff03w force field best-2010-3 and the TIP4P/2005 water model abascal-2005 . For ff03*, 42 replicas spanning a temperature range from 275 to 496 K were used, and for ff03w, 40 replicas spanning 250 to 452 K. Periodic boundary conditions with a truncated octadron minimum image cell of initial edge 4.5 nm were used. Simulations were maintained at a constant pressure with a Parrinello-Rahman barostatparrinello-1981 and temperature was controlled via Langevin dynamics with a friction coefficient of 0.2 ps-1 (ff03*) or 1.0 ps-1 (ff03w). Note that the difference in friction coefficients will not alter the equilibrium properties considered here, and both values are sufficient to maintain constant temperature. Simulations were run for 100-200 ns per replica. A seperate set of REMD runs was performed for each pressure, using 1 bar, 2 kbar, 4 kbar, 8 kbar and 12 kbar for Amber ff03* and 1 bar , 1 kbar, 4 kbar, 8 kbar for Amber ff03w.
To determine the change of volume associated with helix formation, initial configurations were obtained by random selection from the 298 K replica of the ff03* simulations. For each number of helical residues (), 20 configurations were chosen with that helix content. From each of these configurations, 10 ns simulations were performed using position restraints to keep the peptide close to its initial structure, with force constants of 1000 kJ.mol-1.nm-2 on each cartesian coordinate, and using both the ff03* and ff03w force fields. Average total system volumes were computed from each of these runs.
II.2 Helix formation
We define helical states using the backbone Ramachandran angles, in the spirit of the Lifson-Roig theory. We define the helical region of the Ramachandran map as and . A helical segment is defined as three consecutive residues with their backbone torsion angles lying in this range. Therefore the total number of helical residues in the blocked 15-residue peptide considered can take on values in . This method gives results which are consistent with other definitions of helix best-2009-2 .
II.3 Helix-coil models
Simulation data on helix formation were initially described by a Lifson-Roig model lifson-1961 , with nucleation parameter and elongation parameter . These parameters were fitted by maximizing the likelihood of the observed conformations, given the equilibrium probabilities generated from the Lifson-Roig partition function, using a previously described procedure best-2009-2 . Since the experimental data had been fitted to the Zimm-Bragg model for helix formation zimm-1959 , we also converted the fit parameters to the Zimm-Bragg nucleation and elongation parameters and respectively, using the approximate relations qian-1992 :
| (1) |
II.4 Thermodynamic Model
The dependence of the helix elongation free energy, on pressure and temperature was fitted to a thermodynamic model:
| (2) | |||||
In this expression, , , and are the change of enthalpy, entropy and volume as a result of helix elongation at reference conditions, taken to be K and bar pressure. In addition, a constant change of heat capacity, , change of linear expansion coefficient and change of compressibility, were assumed. The data were fitted by non-linear least squares, and errors were estimated by Monte Carlo bootstrapping.
III Results
In order to determine the effects controlling helix stability under pressure, we carefully selected two protein force fields, Amber ff03* and Amber ff03w. These models are almost identical, being originally based on the standard Amber ff03 force fieldduan-2003 . They only differ in that an additional empirically determined Fourier term has been added to the backbone torsion angle in each case, in order to approximately match experimental helix propensities near 300 K best-2009-2 ; best-2010-3 . In the case of ff03*, the calibration was done in conjunction with the TIP3P water model, while for ff03w it was done with TIP4P/2005 water (below, it will be assumed when discussing Amber ff03* and ff03w that the TIP3P and TIP4P/2005 water models were used, respectively). This allows us to test specifically the effects of the water model using closely related protein force fields that have very similar helical populations under standard conditions of temperature and pressure. We study the 15-residue peptide Ac-(AAQAA)3-NH2, as a model system which is known to form helix at low temperature shalongo-1994 , and which has been extensively characterized in previous simulations best-2009-2 ; best-2010-3 ; best-2012-2 .
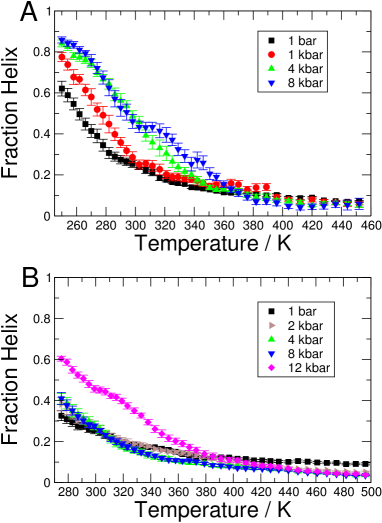
Replica exchange molecular dynamics (REMD) simulations were performed in order to sample the temperature-dependent helix-coil equilibrium. The average fraction helix at each temperature is shown in Figure 1, as determined using backbone dihedral angles. Very similar results are obtained using the standard DSSP kabsch-1983 algorithm, which instead uses backbone hydrogen bonds (See Fig. S1 suppinfo ). As expected both Amber ff03* and ff03w populate % helix at 300 K and 1 bar pressure, where they were parametrized against experimentally determined helix populations. For Amber ff03w, all pressures used resulted in a stabilization of the peptide, even at 1 kbar. On the other hand, over a wide range, from 1 bar to 8 kbar, pressure had very little effect on the overall helix propensity for Amber ff03*: a slight decrease in helix fraction at temperatures greater than is observed. Only for a pressure of 12 kbar is a significant stabilization obtained. Qualitatively, these results suggest a negative reaction volume for helix formation using Amber ff03w, but a very small or positive reaction volume at low to intermediate pressure using Amber ff03*.
We quantify the effect of pressure on the helix-coil equilibrium using a thermodynamic model. However, helix-formation is not a simple two-state process, and involves a broad spectrum of populated intermediates. Therefore, we first fit a simple Ising-like statistical mechanics model which can capture the helix-coil transition. The two classic partition functions for helix-coil formation are those by Zimm and Bragg zimm-1959 and by Lifson and Roig lifson-1961 , which are approximately equivalent qian-1992 . We have determined parameters for both models here. The data were initially fitted to the Lifson-Roig model, using a previously described maximum likelihood method best-2009-2 , yielding a nucleation parameter and an elongation parameter . These parameters were then converted into the corresponding parameters for the Zimm-Bragg model, and . Overall, all these parameters show essentially similar trends to the global fraction of helix, but can be more justifiably fitted to a thermodynamic two-state model since they describe the microscopic transitions involving the flipping of individual residues between helical and extended conformations. Below we focus on the Zimm-Bragg model, as this has been used to characterize the experimental data imamura-2008 ; neumaier-2013 . In particular, the elongation parameter corresponds to the equilibrium constant for adding a single helical hydrogen bond.
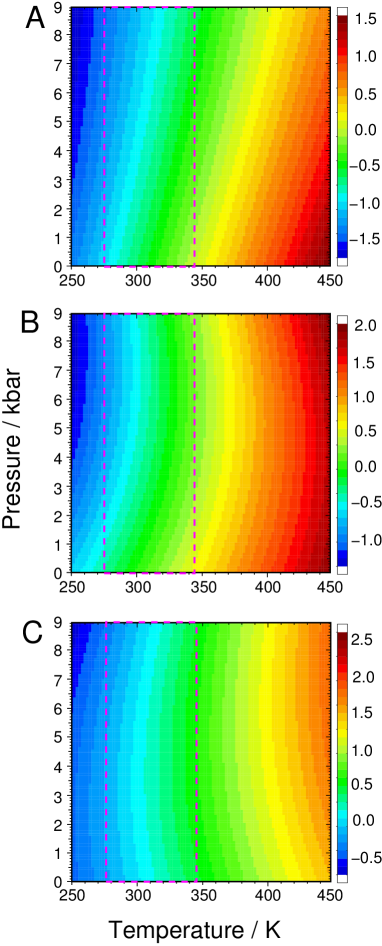
We fitted a thermodynamic model to the elongation free energy, here defined as . The model includes changes of enthalpy , entropy and reaction volume under standard conditions, as well as constant differences in heat capacity , isothermal compressibility and linear thermal expansion coefficient to describe the temperature- and pressure-dependence. The same model was fitted to the data for reported by Imamura et al., based on FTIR measurements imamura-2008 . The fits to the raw data are shown in Fig. S2 suppinfo . In Fig. 2 we show the stability diagram for each force field and for experiment; the fitted parameters are listed in Table 1.
Overall, the stability diagram obtained with the Amber ff03w force field is very similar to experiment, bearing in mind that the experiments were done on a different alanine-based peptide (AK20) – we note that the stability diagrams for the AK16 peptide obtained by Hatch et alhatch-2014 with Amber ff03* and TIP3P are qualitatively very similar to those we obtain for Ac-(AAQAA)3-NH2 with the same force field and water model. This is particularly true in the range of temperature and pressure probed by the experiments, indicated by the broken lines in Fig. 2. In both cases, increasing pressure clearly stabilizes helical states, as also reflected in the negative reaction volume of cm3.mol-1 for experiment and cm3.mol-1 for Amber ff03w (Table 1). It also captures quite well the overall enthalpy and entropy changes for adding a helical residue, as previously noted best-2010-3 . In contrast, the stability diagram for the ff03* force field differs in some important respects. Application of low pressures will have little effect on, or slightly destabilize helical, reflected in the small positive cm3.mol-1 (Table 1) for helix formation. Additionally, the changes in enthalpy and entropy are almost half the experimental estimates, indicative of too low a cooperativity of helix meltingbest-2009-2 . For experiment and both force fields, the changes in heat capacity are small. This is in contrast to protein folding robertson-1997 , and may indicate a limited role for the hydrophobic effect in stabilizing helices. For both force fields, the difference in thermal linear expansion coefficients, , is small and positive, . This implies a change of reaction volume with temperature which will slightly increase the positive reaction volume for Amber ff03*, but is insufficient to change the sign of the negative reaction volume using Amber ff03w. Over the the range of temperature where liquid water is stable the effect is too small to qualitatively change the pressure-dependence of the two models.
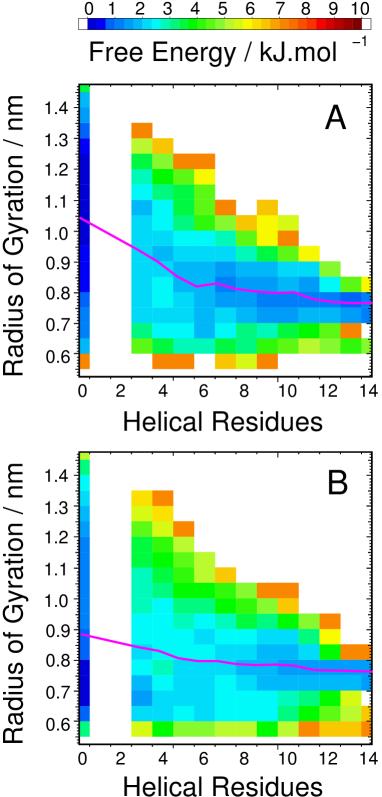
The differences in enthalpy and entropy between the two solvent models have been explained in terms of the strength of solvent interactions with the peptide chain best-2010-3 . These differences also result in a more expanded unfolded state for ff03w relative to ff03*. How can the differences in reaction volume be understood? The first explanation would be in terms of changes in the peptide free energy surface – i.e. different conformations are preferred by each force field, particularly for non-helical states. This is undoubtedly a contribution, since these free energy surfaces are evidently different. In Fig. 3, we show representative two-dimensional free energy surfaces as a function of the radius of gyration and the number of helical residues. As anticipated, the radius of gyration of the helical states is similar, but the non-helical states are much more collapsed in the case of ff03* compared to ff03w. If one supposes that a more collapsed unfolded state is associated with a smaller volume, then this would be consistent with the observed differences in reaction volume for helix formation for the two force fields.
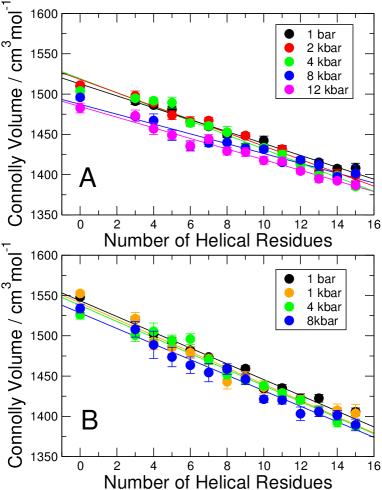
In order to investigate the above hypothesis, we determined the approximate volume excluded to water by each peptide conformation by using the Connolly volume: this is the volume which is inaccessible to a sphere of radius 0.14 nm. This is the simplest way in which the volume of a configuration can be estimated. The average Connolly volumes for configurations with the same number of helical residues are shown in Fig. 4, for the replica at 298 K. The results clearly show that more helical states have a smaller total volume for both ff03* and ff03w, which is qualitatively consistent with the negative change of volume for helix formation observed experimentally. However, it does not explain why under low pressure conditions the reaction volume for TIP3P may be positive, and the overall changes of 10-15 cm3.mol-1 per helical residue are about an order of magnitude larger than the volume changes estimated from the thermodynamic fits in Table 1. It also does not explain the reduction of reaction volume for ff03* with pressure, such that it becomes negative at sufficiently high pressures. Although we find that helical states do have smaller Connolly volume above 4 kbar, in agreement with earlier findings based on the radius of gyration mori-2014 , we also find an even greater reduction in volume for non-helical states so that the difference in volume between non-helical and helical states would become more positive with increasing pressure, the opposite trend to that observed for the total reaction volume of the system. Therefore, a simple picture based only on properties of the peptide configurations does not tell the whole story.
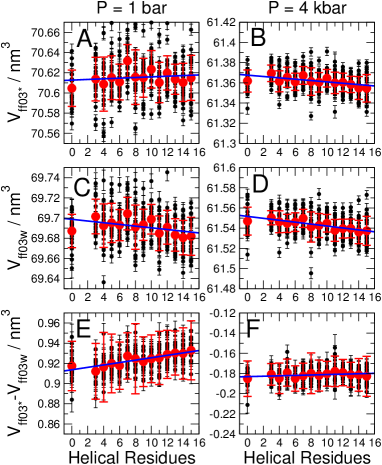
Naturally, the surrounding solvent may also play a role in determining the dependence of system volume on peptide conformation, and previous studies have suggested that peptide solvation changes with increasing pressure paschek-2005 ; paschek-2008 , and changes in water structure with increasing pressure are known to alter the hydrophobic effect hummer-1998-3 . We probed for this by randomly drawing configurations from the 298 K replica from the 1 bar Amber ff03* REMD simulation, and then determining for each of these the average system volume using different force fields and system pressures (1 bar and 4 bar). That is, we effectively remove the influence of different free energy surfaces with different force fields by always considering the same set of peptide configurations. By running sufficiently long constant pressure simulations with each of these configurations, restrained to their initial position, we can accurately determine the average system volume, as a function of the number of helical residues. The results of these simulations for the Amber ff03* and ff03w force fields are summarized in Fig. 5. We find that this simple analysis captures the reaction volume effects inferred from the thermodynamic fits. Namely, at 1 bar pressure, the reaction volume for helix formation is positive with ff03* and negative with ff03w (Fig. 5A,C), while at 4 bar pressure the change of volume upon helix formation becomes negative even for TIP3P (Fig. 5B,D). The large scatter in the individual system volumes (black data points) indicates that other factors besides helicity are important for determining system volume. Nonetheless, when the volume of a given configuration with ff03w is subtracted from that with ff03*, these effects are largely eliminated, leaving helicity as the main determinant of the difference between the two water models (Figure 5E-F). This result highlights the importance of solvation in determining the difference in apparent volume between the helical and less helical states.
Although Amber ff03* with the TIP3P water model may fail to describe the correct qualitative pressure-dependence of helix stability, it should be noted that the differences in reaction volume under consideration are extremely tiny: a change of volume per residue, or nm3 per molecule per residue can be related to a change of apparent helix radius using a helix pitch of nm and helix radius nm via , yielding a change of apparent radius nm. While this is a simplified model calculation, it serves to illustrate the subtlety of the effect that must be captured.
IV Conclusion
The dependence of globular protein stability on pressure has been found to be mainly determined by cavities in the folded structure, masking other possible effects of interest. In the case of helix formation, in fact the opposite trend is found to that for protein folding, namely pressure stabilization of helices. We have shown here that simulations with an accurate water model, TIP4P/2005, are capable of capturing the pressure dependence of helix formation. Further, in agreement with earlier work, we find that using the TIP3P water model leads to pressure-induced destabilization of helices, a qualitatively incorrect result. We further show here that this difference is not merely due to the different peptide conformations sampled with that water model. Instead there is a critical role for solvent structure in determining the reaction volume changes. Taken together, our results emphasize the importance of using an accurate water model for capturing the folding of peptides and proteins under different thermodynamic conditions.
The experimental results obtained for helix formation have proved to be a stringent test for simulation models. In future, it would be very interesting to compare simulation results with experimental data for other model peptides such as -hairpins, should such data become available. Experimental kinetics results for the pressure-dependence of helix neumaier-2013 and protein folding roche-2013 ; liu-2014 kinetics are also a rich source of information for future detailed comparison with molecular simulation.
Acknowledgements.
RB is supported by the Intramural Research Program of the National Insitute of Diabetes and Digestive and Kidney Diseases of the National Institutes of Health. JM is supported by Alfred P. Sloan Foundation Research Fellowship. This study utilized the high-performance computational capabilities of the Biowulf Linux cluster at the National Institutes of Health, Bethesda, Md. (http://biowulf.nih.gov) and the high-performance computing capabilities of the Extreme Science and Engineering Discovery Environment (XSEDE), which is supported by the National Science Foundation grant no. TG-MCB-120014.References
- (1) Ken A Dill, “Dominant forces in protein folding,” Biochemistry 29, 7133–7155 (1990).
- (2) Robert L. Baldwin, “Temperature dependence of the hydrophobic interaction in protein folding,” Proc. Natl. Acad. Sci. U. S. A. 83, 8069–8072 (1986).
- (3) Andrew D. Robertson and Kenneth P. Murphy, “Protein structure and the energetics of protein stability,” Chem. Rev. 97, 1251–1267 (1997).
- (4) Charles Dumont, Tryggvi Emilsson, and Martin Gruebele, “Reaching the protein folding speed limit with large, sub-microsecond pressure jumps,” Nature Methods 6, 515–519 (2009).
- (5) Edgar Larios and Martin Gruebele, “Protein stability at negative pressure,” Methods 52, 51–56 (2100).
- (6) Vadim V Mozhaev, Karel Heremans, Johannes Frank, Patrick Masson, and Claude Balny, “High pressure effects on protein structure and function,” Proteins-Structure Function and Genetics 24, 81–91 (1996).
- (7) JL Silva and G Weber, “Pressure stability of proteins,” Annual Review of Physical Chemistry 44, 89–113 (1993).
- (8) Walter Kauzmann, “Thermodynamics of unfolding,” Nature 325, 763–764 (1987).
- (9) Gerhard Hummer, Shekhar Garde, Angel E. García, Michael E. Paulaitis, and Lawrence R. Pratt, “The pressure dependence of hydrophobic interactions is consistent with the observed pressure denaturation of proteins,” Proc. Natl. Acad. Sci. U. S. A. 95, 1552–1555 (1998).
- (10) Kelly J. Frye and Catherine A. Royer, “Probing the contribution of internal cavities to the volume change of protein unfolding under pressure,” Protein Sci. 7, 2217–2222 (1998).
- (11) Julien Roche, Jose A. Caro, Douglas R. Norberto, Philippe Barthe, Christian Roumestand, Jamie L. Schlessman, Angel E. Garcia, Bertrand E. Garcia-Moreno, and Catherine A. Royer, “Cavities determine the pressure unfolding of proteins,” Proc. Natl. Acad. Sci. U. S. A. 109, 6945–6950 (2012).
- (12) Jason K Cheung, Pooja Shah, and Thomas M Truskett, “Heteropolymer collapse theory for protein folding in the pressure-temperature plane,” Biophysical journal 91, 2427–2435 (2006).
- (13) Takahiro Takekiyo, Akio Shimizu, Minoru Kato, and Yoshihiro Taniguchi, “Pressure tuning FT-IR spectroscopic study on the helix-coil transition of Ala-rich oligopeptide in aqueous solution,” Biochim. Biophys. Acta 1750, 1–4 (2005).
- (14) Hiroshi Imamura and Minoru Kato, “Effect of pressure on helix-coil transition of an alanine-based peptide: An FTIR study,” Proteins 75, 911–918 (2008).
- (15) Sabine Neumaier, Maren Büttner, Annett Bachmann, and Thomas Kiefhaber, “Transition state and ground state properties of the helix–coil transition in peptides deduced from high-pressure studies,” Proc. Natl. Acad. Sci. U. S. A. 110, 20988–20993 (2013).
- (16) Dietmar Paschek, S. Gnanakaran, and Angel E. Garcia, “Simulations of the pressure and temperature unfolding of an -helical peptide,” Proc. Natl. Acad. Sci. U. S. A. 102, 6765–6770 (2005).
- (17) Harold W. Hatch, Frank H. Stillinger, and Pablo G. Debenedetti, “Computational study of the stability of the miniprotein Trp-cage, the GB1 -hairpin, and the AK16 peptide, under negative pressure,” J. Phys. Chem. B 118, 7761–7769 (2014).
- (18) Yoshiharu Mori and Hisashi Okumura, “Molecular dynamics of the structural changes of helical peptides induced by pressure, dx.doi.org/10.1002/prot.24654,” Proteins 0, 0–0 (2014).
- (19) Robert B. Best and Gerhard Hummer, “Optimized molecular dynamics force fields applied to the helix-coil transition of polypeptides,” J. Phys. Chem. B 113, 9004–9015 (2009).
- (20) William L. Jorgensen, Jayaraman Chandrasekhar, and Jeffry D. Madura, “Comparison of simple potential functions for simulating liquid water,” J. Chem. Phys. 79, 926–935 (15 July 1983).
- (21) Robert B. Best and Jeetain Mittal, “Protein simulations with an optimized water model: cooperative helix formation and temperature-induced unfolded state collapse,” J. Phys. Chem. B 114, 14916–14923 (2010).
- (22) J. L. F. Abascal and C. Vega, “A general purpose model for the condensed phases of water: Tip4p/2005,” J. Chem. Phys. 123, 234505 (2005).
- (23) Berk Hess, Carsten Kutzner, David van der Spoel, and Erik Lindahl, “GROMACS 4: algorithms for highly efficient, load-balanced, and scalable molecular simulation,” J. Chem. Theory Comput. 4, 435–447 (2008).
- (24) Michele Parrinello and Aneesur Rahman, “Polymorphic transitions in single crystals: a new molecular dynamics method,” J. Appl. Phys. 52, 7182–7190 (1981).
- (25) Schneior Lifson and A. Roig, “On the theory of helix-coil transition in polypeptides,” J. Chem. Phys. 34, 1963–1974 (1961).
- (26) B. H. Zimm and J. K. Bragg, “Theory of phase transition between helix and random coil in polypeptide chains,” J. Chem. Phys. 11, 526–535 (1959).
- (27) Hong Qian and John A. Schellman, “Helix-coil theories: a comparative study for finite length polypeptides,” J. Phys. Chem. 96, 3987–3994 (1992).
- (28) Yong Duan, Chun Wu, Shibasish Chowdhury, Matthew C. Lee, Guoming Xiong, Wei Zhang, Rong Yang, Piotr Cieplak, Ray Luo, Taisung Lee, James Caldwell, Junmei Wang, and Peter A. Kollman, “A point-charge force field for molecular mechanics simulations of proteins based on condensed-phase quantum chemical calculations,” J. Comp. Chem. 24, 1999–2012 (2003).
- (29) William Shalongo, Laxmichand Dugad, and Earle Stellwagen, “Distribution of helicity within the model peptide Acetyl(AAQAA)3amide,” J. Am. Chem. Soc. 116, 8288–8293 (1994).
- (30) Robert B. Best, David de Sancho, and Jeetain Mittal, “Residue-specific -helix propensities from molecular simulation,” Biophys. J. 102, 1897–1906 (2012).
- (31) Wolfgang Kabsch and Christian Sander, “Dictionary of protein secondary structure: pattern recognition of hydrogen-bonded and geometrical features,” Biopolymers 22, 2577–2637 (1983).
- (32) “See Supplementary Material Document No. XXX for a figure showing the quality of the thermodynamic model fit to the primary data. For information on Supplementary Material, see http://www.aip.org/pubservs/epaps.html,” .
- (33) Dietmar Paschek, Sascha Hempel, and Angel E. Garcia, “Computing the stability diagram of the Trp-cage miniprotein,” Proc. Natl. Acad. Sci. U. S. A. 105, 17754–17759 (2008).
- (34) Julien Roche, Mariana Dellarole, Jose A. Caro, Douglas R. Norberto, Angel E. Garcia, Bertrand E. Garcia-Moreno, Christian Roumestand, and Catherine A. Royer, “Effect of internal cavities on folding rates and routes revealed by real-time pressure-jump NMR spectroscopy,” J. Am. Chem. Soc. 135, 14610–14618 (2013).
- (35) Yanxin Liu, Maxim B. Prigozhin, Klaus Schulten, and Martin Gruebele, “Observation of complete pressure-jump protein refolding in molecular dynamics simulation and experiment,” J. Am. Chem. Soc. 136, 4265–4272 (2014).
V Tables
| Parameter | Units | Experiment | ff03w | ff03* |
|---|---|---|---|---|
| kJ.mol-1 | ||||
| J.mol-1.K-1 | ||||
| J.mol-1.K-1 | ||||
| cm3.mol-1 | ||||
| cm3.mol-1.bar-1 | ||||
| cm3.mol-1.K-1 |
VI Figures
 |
 |
 |
 |
 |