Recent results on Bose-Einstein correlations by the PHENIX Experiment
Abstract:
Bose-Einstein momentum correlation functions of identical bosons reveal the shape and size of the (soft) particle emitting source of the given particle. The widths of these correlation functions are called HBT radii, named after Brown and Twiss who studied the angular diameter of stars via intensity correlations in their radio telescopes. Today, high energy physics experiments measure the HBT radii as a function of many parameters: particle type, transverse momentum, azimuthal angle, collision energy, collision geometry. In this paper we present results from the RHIC PHENIX experiment. These include the observation of strong azimuthal-angle dependence of the extracted Gaussian HBT radii, the similarities and differences between kaon and pion HBT radii. The key point of this paper is the application of Bose-Einstein correlations to the search for the critical point: how HBT radii would show the appearance of a first order phase transition, and what the non-monotonic collision energy dependence of the pion source tells us about the critical point; and how the non-Gaussian shape of correlation functions is related to one of the critical exponents.
1 Introduction
Ultra-relativistic collisions of nuclei, so called “Little Bangs” are observed at the Relativistic Heavy Ion Collider (RHIC) of the Brookhaven National Laboratory, New York. The PHENIX Experiment at RHIC detects and identifies a large variety of the outcoming particles over a broad energy range. PHENIX has been participating in the Beam Energy Scan program of RHIC, and collision data of many nuclei (d, He, Cu, Au, U) were taken at several center of mass energies (per nucleon), from 7.7 GeV to 200 GeV. The goal behind this variety of energies is to investigate the phase structure of QCD matter and the nature of the quark-hadron transition. This transition is a cross-over at low baryochemical potential [1], corresponding to top RHIC energy. It is however believed to be a first order phase transition at higher baryochemical potential (i.e. lower collision energies), while there may be a critical endpoint (CEP) somewhere in between. Correlation and fluctuation measurements [2, 3] are a powerful tool to be utilized in the search for direct evidence of the phase transition and the location of the critical point. In the present paper we focus on the soft pion production in these collisions, in particular the measurement of Bose-Einstein correlations between these low momentum pions. We discuss general features of Bose-Einstein correlations below, and then show results of various Bose-Einstein correlation measurements.
2 Basics of Bose-Einstein correlations and HBT radii
R. H. Brown and R. Q. Twiss, radio astronomers, used two radio antennas pointed at a distant star and chose to detect each signal separately to take away its high frequency component. They saw an interference term present in the product of these two detected signals, and it turned out, that this interference enabled them to measure the angular radius of the observed star [4]. This technique was then translated to high energy physics by Goldhaber et al. [5], and it turned out, that Bose-Einstein correlations of pion pairs coming out of high energy nuclear collisions can be used to study the space- time extent and shape of the particle emitting source.
The basic idea can be described in a simple quantum-mechanical picture: the detected two- particle momentum distribution depends on the two-particle probability amplitude, i.e. the absolute square of the two-particle wave function. This wave function has to be symmetric for the exchange of the two particles, and in the end this results in a simple connection between the normalized particle emitting source and the momentum-correlation function :
| (1) |
where is the Fourier transform of , and is the four- momentum difference of the two identical bosons. In case of usual sources, the for , and (as for normalized sources).
There are however many complications that distort the above simple picture. One of these is the Coulomb-interaction (and other final-state interactions, which however can be neglected in case of pions) between the two particles. This can be handled by using the solution of the two-particle Schr dinger-equation with a Coulomb-potential, as discussed in Ref. [6] for details. Another complication is, that a significant fraction of the produced pions comes from the decays of long lived resonances. These pions are produced very far from the hot, hydrodynamically expanding core, and give a very narrow contribution to . This narrow component cannot be resolved experimentally, thus the correlation function seems to have an intercept smaller than 2. Such a two-component source can be described in the core-halo picture (introduced in Refs. [7, 8]), where the experimentally resolvable correlation function is
| (2) |
where is the normalized source function of primordial pions, , and for the experimentally resolvable region.
Usually, the 1D correlation function is measured as a function of , but 3D information on the source can also be extracted from measurements, if statistics permits it. The or longitudinal (long) direction is that of the beam. The plane perpendicular to it is parametrized with a pair-coordinate system introduced in Refs. [9, 10]. In this system the out direction is that of the average transverse momentum of the pair, while the side direction is perpendicular to both out and long. Also, instead of the center of mass or the lab system, the longitudinally comoving system (LCMS) is used usually (introduced in Ref. [11]). In a Bertsch-Pratt LCMS system, the average momentum is , while from the mass-shell condition one obtains
| (3) |
i.e. the time component of the momentum difference is related to the difference in the outward direction.
The main physics information is to be extracted from the shape of the measured correlation functions in one dimension (as a function of ) or in three dimensions (as a function of , and ). The simplest case is to measure the width’ of the correlation function (the so-called HBT radii named after H. Brown and Twiss), with a Gaussian assumption. This is not always valid however, and in an ideal case, model independent shape analysis has to be pursued [12]. Others restore the source image from the correlation function, via the method of imaging [13]. In this paper we report about results of ordinary Gaussian analyses, and the measurement of Gaussian HBT radii.
And how are HBT radii connected to the the critical point or phase transitions? It turns out, that in a simple hydrodynamic picture, the out and side directed HBT radii are [14]
| (4) |
which implies two things: radii scale as with the average transverse mass of the pair, and out minus side difference is related to the emission duration . This is particularly interesting, since a strong first order phase transition would cause a long emission and thus a large difference of these radii – which was not the case experimentally [15]. Readers shall however be reminded, that there is rich physics hidden in this story, and are encouraged to read Ref. [16] for an in-depth analysis.
3 PHENIX HBT results
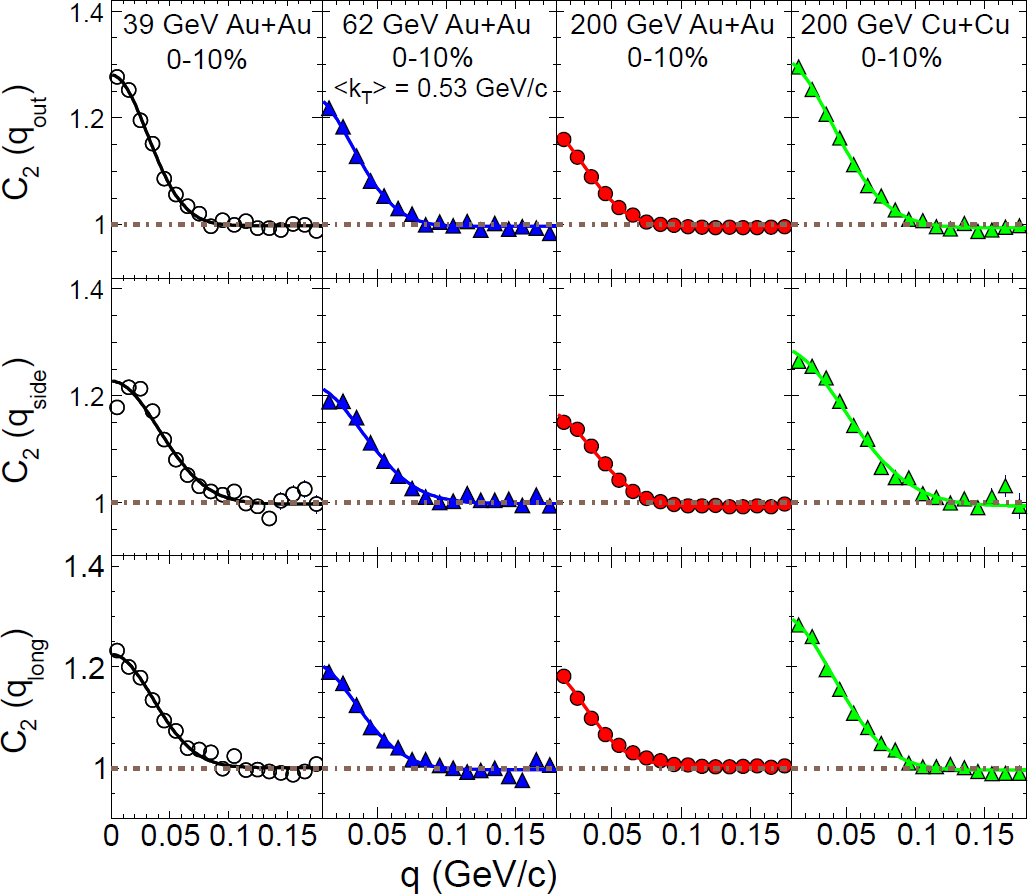
In this section, we present recent PHENIX results on Bose-Einstein correlations. We show a few example correlation functions in Fig. 1, from Ref. [17]. These (and others) were then analyzed by extracting their Gaussian width, i.e. the HBT radii. In the following subsections, we present such results on HBT radii.
3.1 Transverse momentum scaling
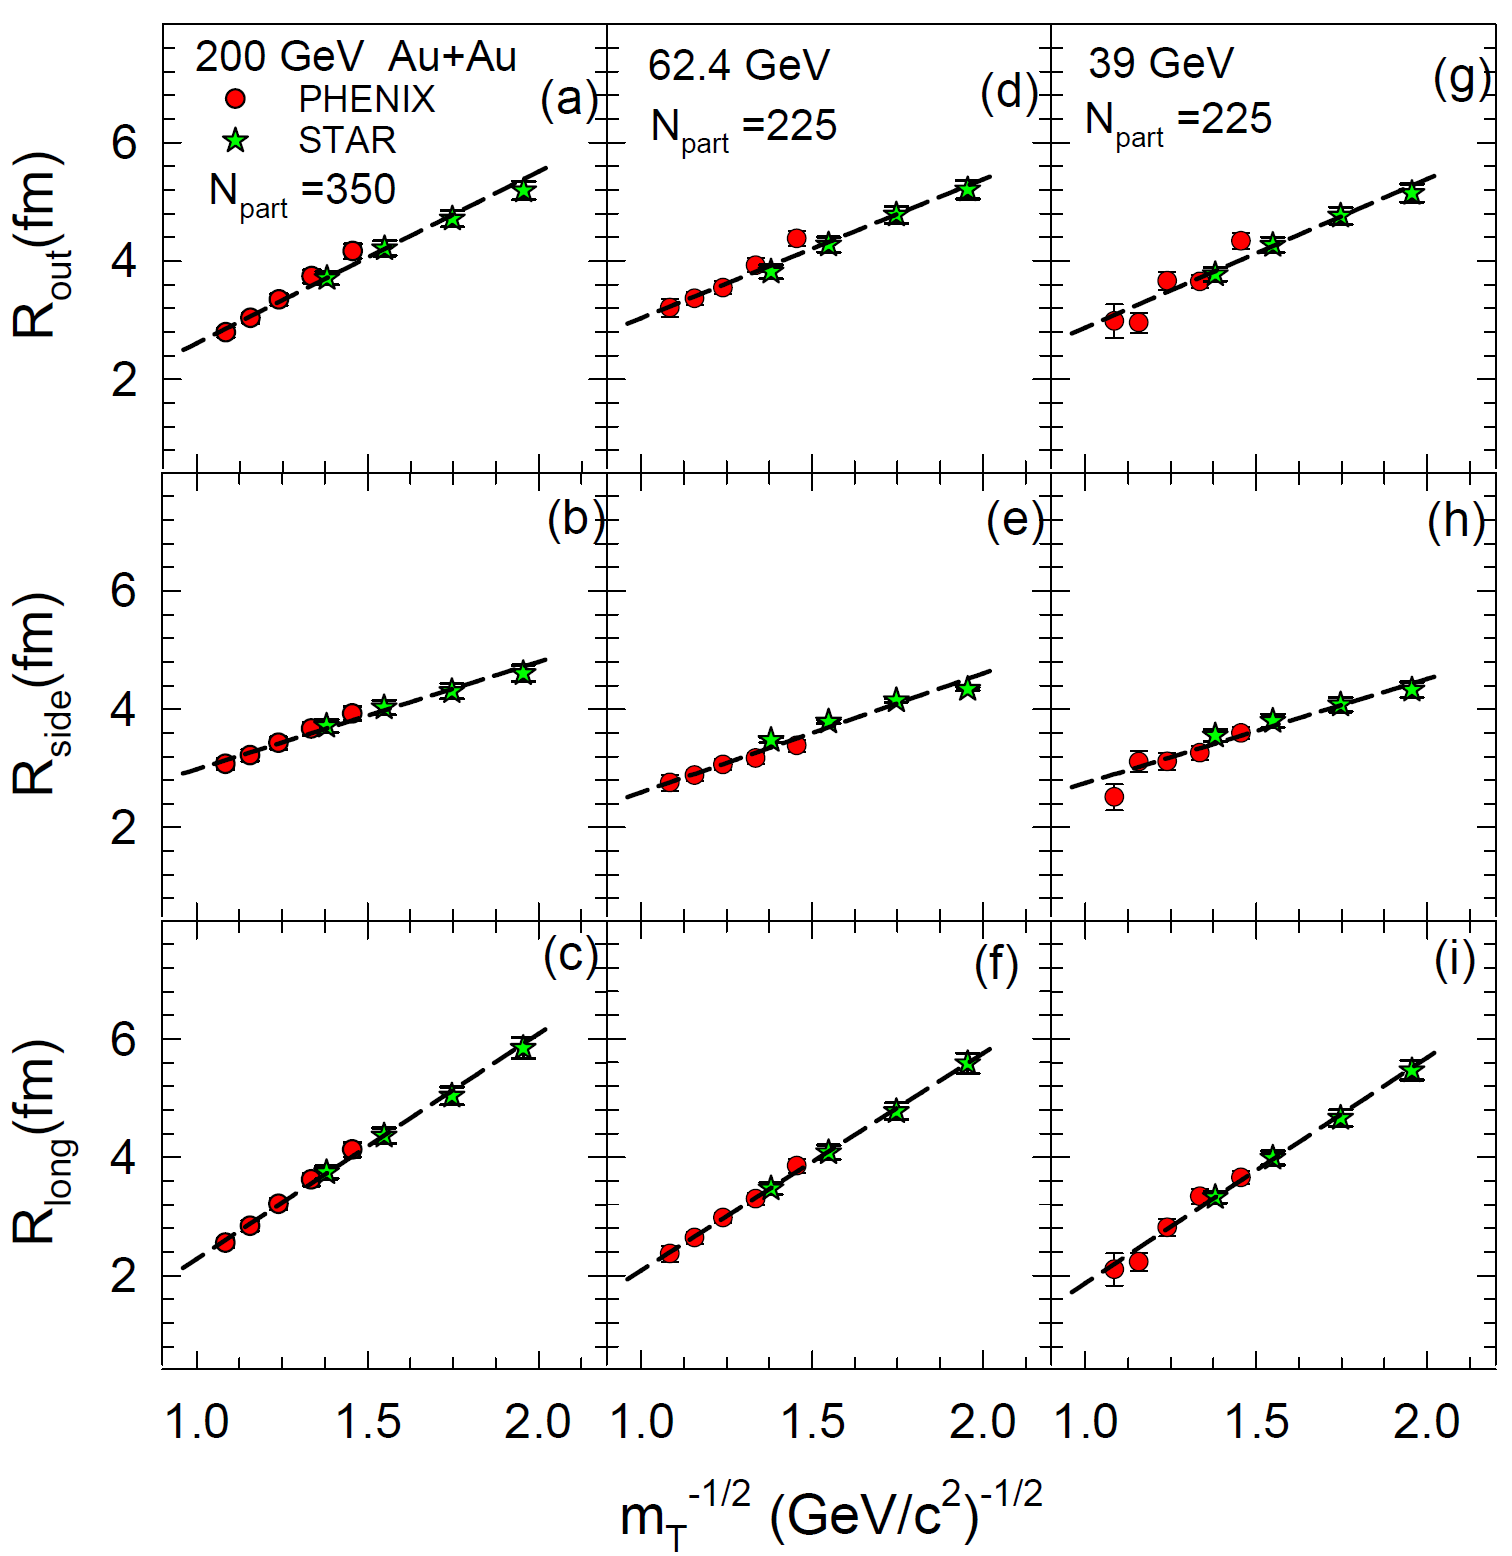
Correlation functions of pion pairs of several average transverse mass bins were measured in 39 to 200 GeV Au+Au collisions [17]. The dependence of the resulting Gaussian radii , , and , compared to recent STAR data [18] are shown in Fig. 2. The data of different centrality selections show characteristic scaling patterns as a function of the transverse mass of the emitted pion pairs, consistent with hydrodynamic expansion. A good level of agreement is seen between the PHENIX and STAR data sets, while the PHENIX data extends the covered range of RHIC HBT radii. It is important to note that the scaling also holds in 200 GeV d+Au collisions [23].
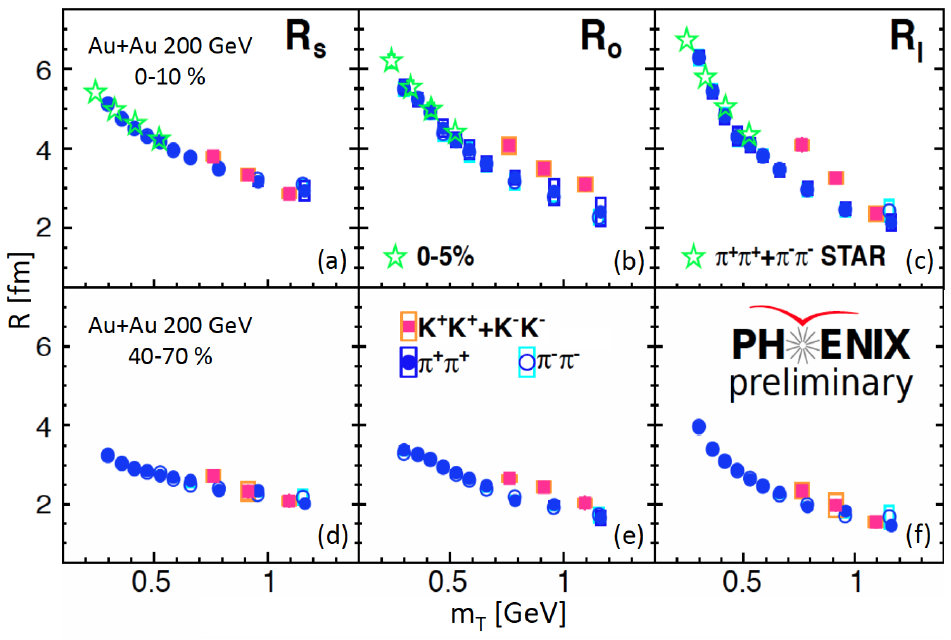
Correlation functions of kaon pairs were also recently measured at PHENIX. Since the pion sample is more affected by hadronic rescattering and the decays of long lived resonances, kaons represent a more clean proble of the particle emitting source. PHENIX recently measured kaon HBT radii at several centralities of 200 GeV Au+Au collisions [19]. Fig. 3 shows a comparison of the dependence of HBT radii between charged pions and kaons. There is no significant difference in the side direction (i.e. scaling of different particle species holds), while the kaon radii in the out and longitudinal directions are slightly larger than the pions (at the same ). The difference is more pronounced in central collisions. These results may point to different dynamics and duration of kaon production as compared to pion production.
3.2 Azimuthally dependent HBT
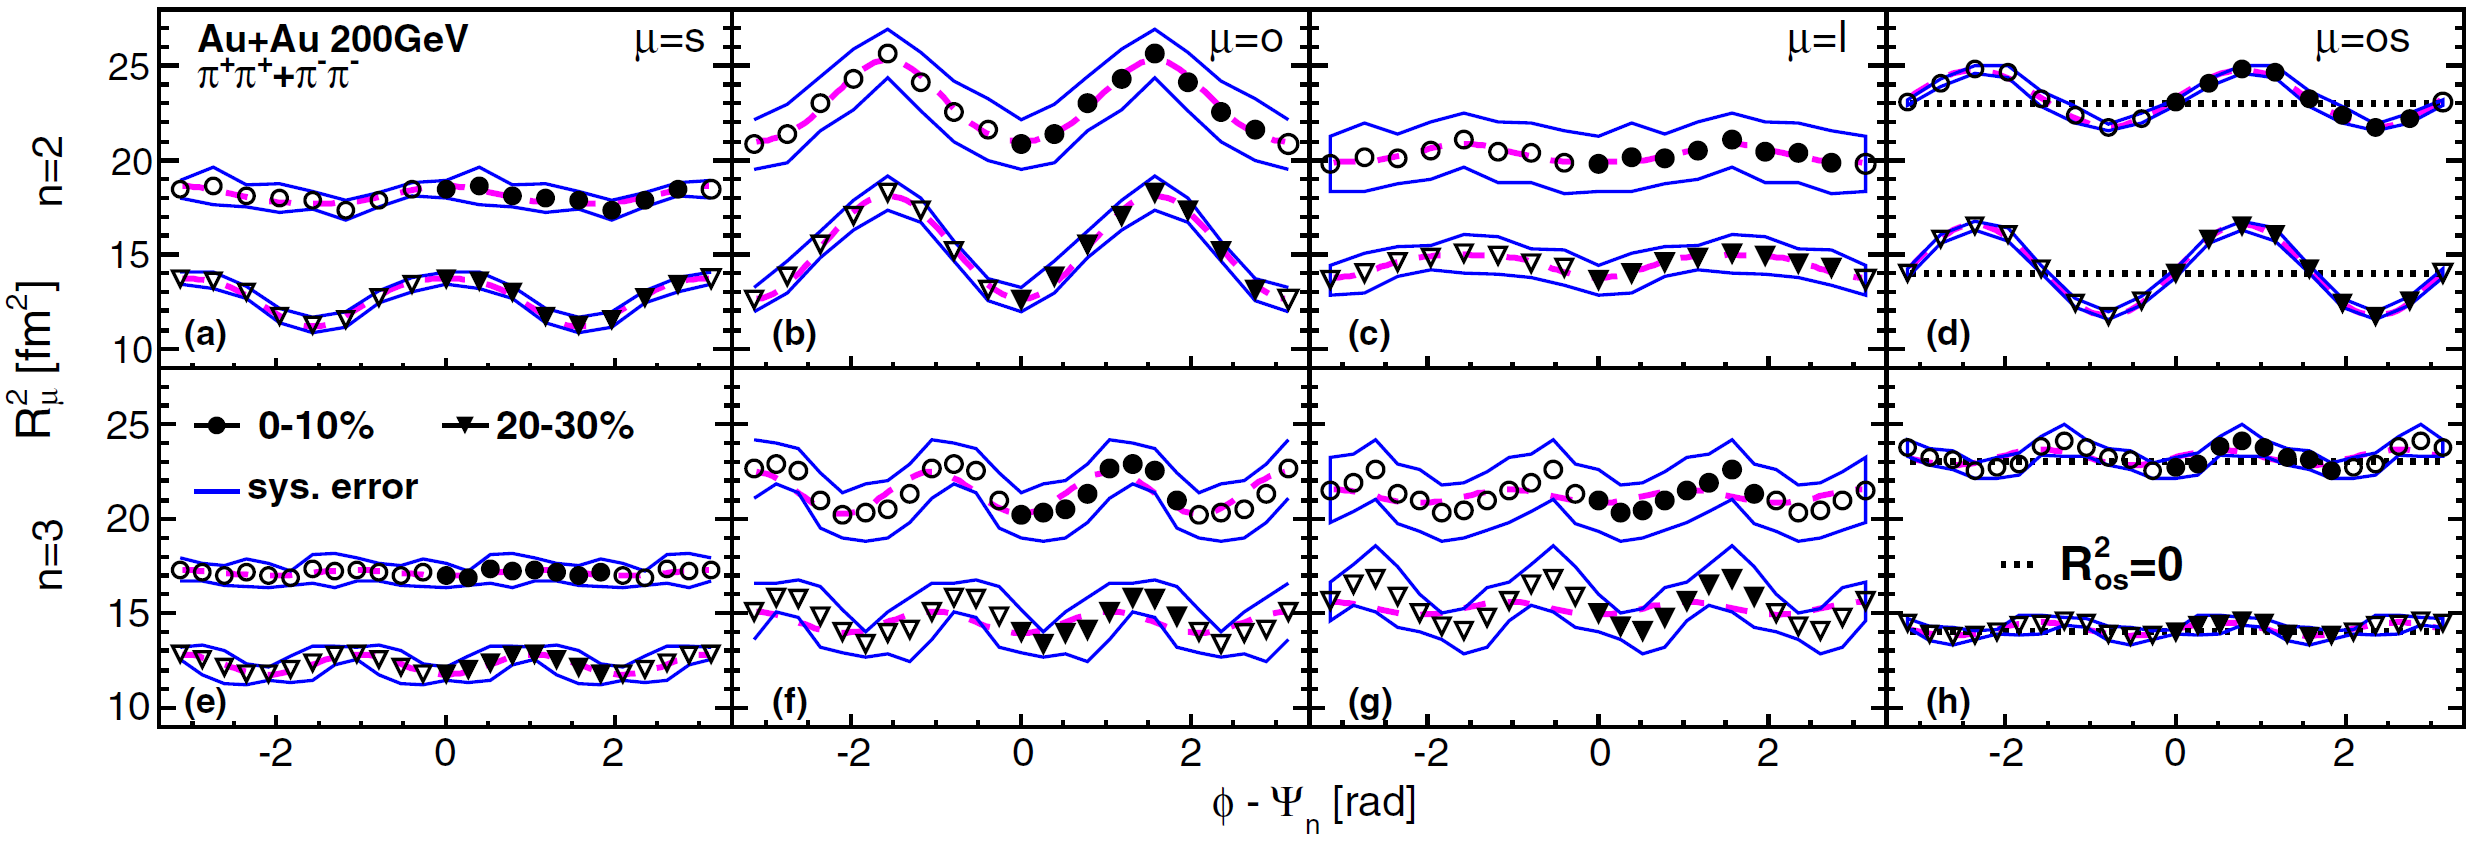
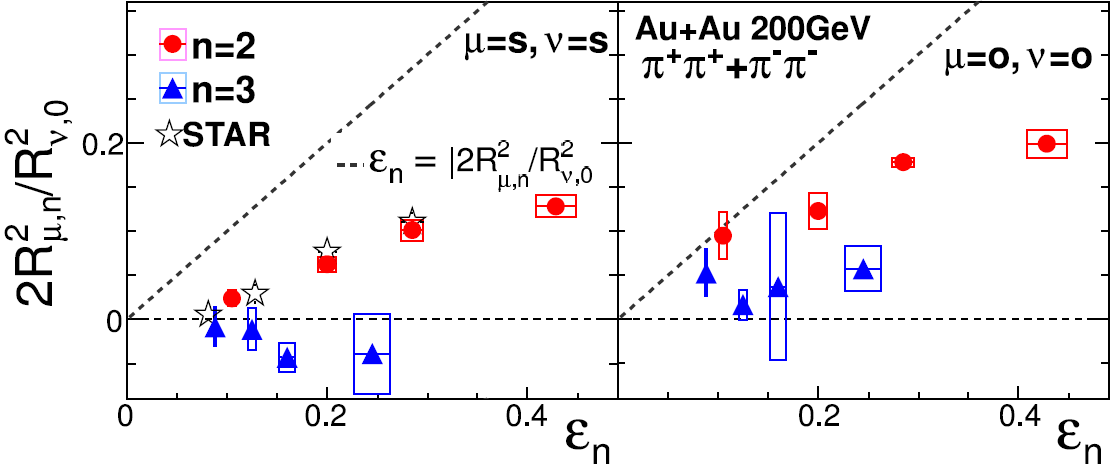
HBT radii were recently measured at PHENIX with respect to the 2nd- and 3rd-order event plane in 200 GeV Au+Au collisions [20]. A strong azimuthal-angle dependence of the Gaussian HBT radii was observed with respect to both the 2nd- and 3rd-order event planes, as shown in Fig. 4 (top panel). The oscillation amplitudes were extracted by fitting type of functional forms. The amplitude ratios versus initial spatial anisotropies (from Monte-Carlo Glauber simulations) are shown also in Fig. 4 (bottom panel). Since these ratios are sensitive to the final eccentricity, the results for indicate that the initial eccentricity is reduced during the medium evolution, but is not reversed. Results for however indicate, that the initial triangular shape may be reversed by the end of the medium evolution, and that the 3rd-order oscillations are largely dominated by the dynamical effects from triangular flow, as detailed in Ref. [20]
A new technique in measuring azimutally sensitive HBT radii is the application of event shape selection. In this method one controls not just the direction of the event plane in each event, but also the magnitude of the second order flow vector , measured by the Reaction Plane Detector (RxNP). is defined as with being the multiplicity in the -th segment of RxNP. The measured eccentricity (defined as ) was found to be enhanced for events with higher magnitude of the flow vector , as detailed in e.g. Ref. [21].
3.3 Geometric scaling
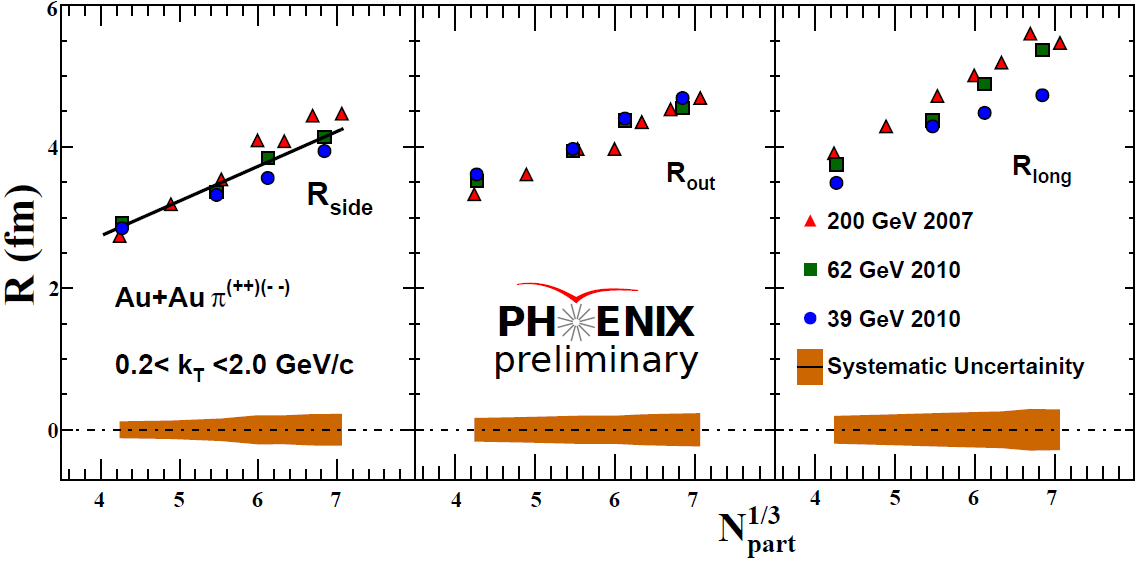
As the initial system volume scales with , the dependence of the HBT radii is often analyzed. Recently, HBT radii measurements in 39, 62 and 200 GeV Au+Au collisions were compared [22], as shown in Fig. 5 (top panel). All energies show a linear dependence, approximately independently of the beam energy. This indicates that at these RHIC energies, the dynamics of the system does not change dramatically, similar means similar initial system size, which in turn leads to a similar homogeneity length.
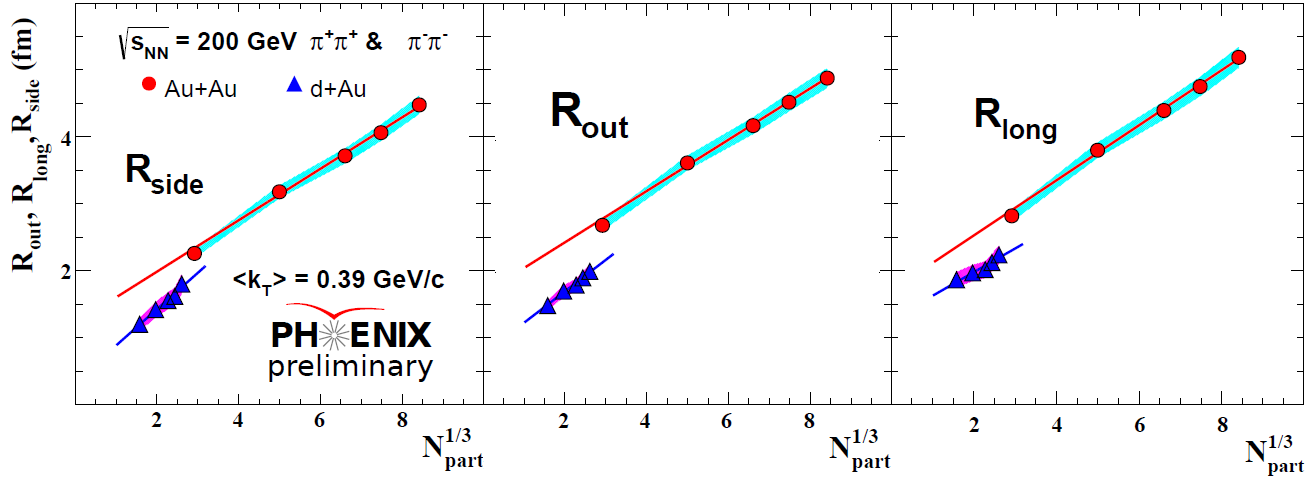
PHENIX also measured three dimensional HBT radii in d+Au collisions as a function of centrality [23]. The linear dependence shows a similar slope in Au+Au and d+Au collisions (at the same average transverse momentum). The similarity of the slope is stronger in case of and (hinting at similar transverse dynamics of the two systems), while the slope is slightly different, maybe due to different longitudinal dynamics in d+Au and Au+Au collisions. Results are shown in Fig. 5 (bottom panel).
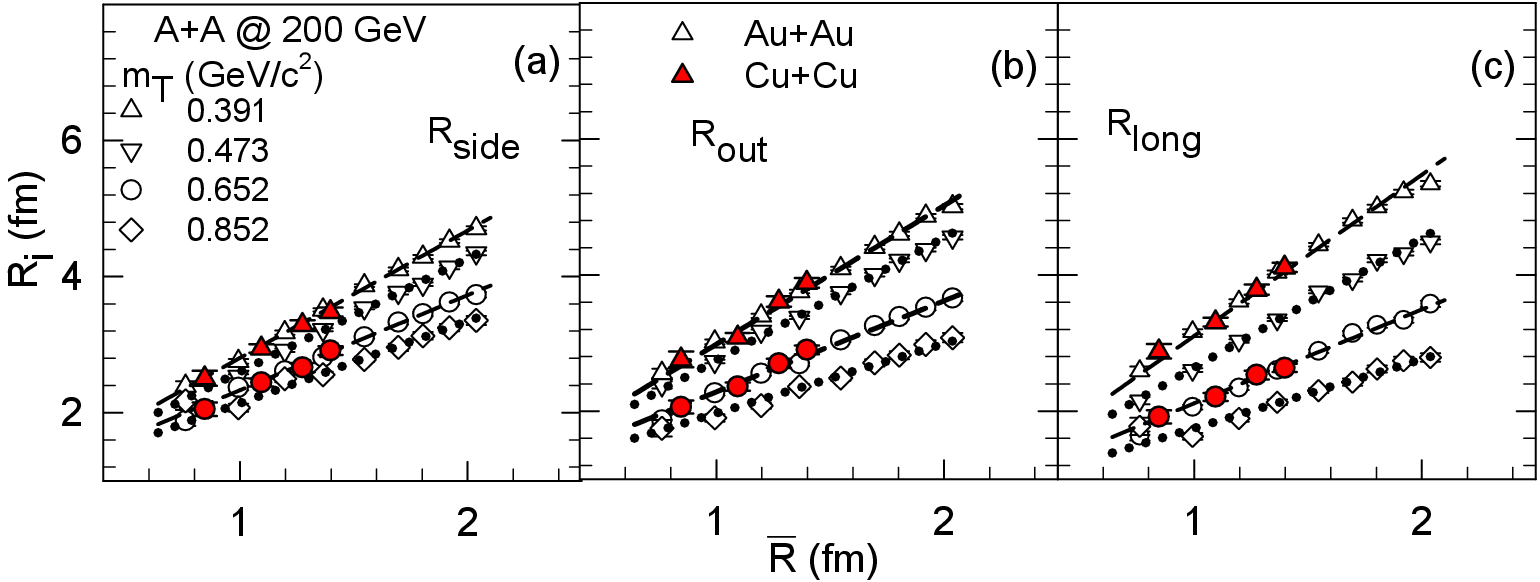
Besides the above system size scaling, more detailed geometrical scalings were discovered. These are based on the characteristic initial transverse size, defined as with being the RMS widths of participant nucleon distributions in the and directions (estimated via Glauber Monte Carlo calculations). The space-time extent of the emission source at freeze-out, as measured by the HBT radii, reflects the initial size of the system, the expansion time or lifetime , as well as transverse expansion rate (visible via the dependence of the HBT radii, as discussed in Section. 2). Since the expansion time is expected to scale with , the HBT radii are also expected to scale with in a given range. This scaling was indeed observed at PHENIX [17] as shown in Fig. 6. Note furthermore, that it also holds in case of d+Au collisions [23]. The detailed scaling laws indicate that is a better predictor of final state homogeneity length, than , which is consistent with observations that HBT is sensitive to the expansion dynamics.
3.4 Excitation function
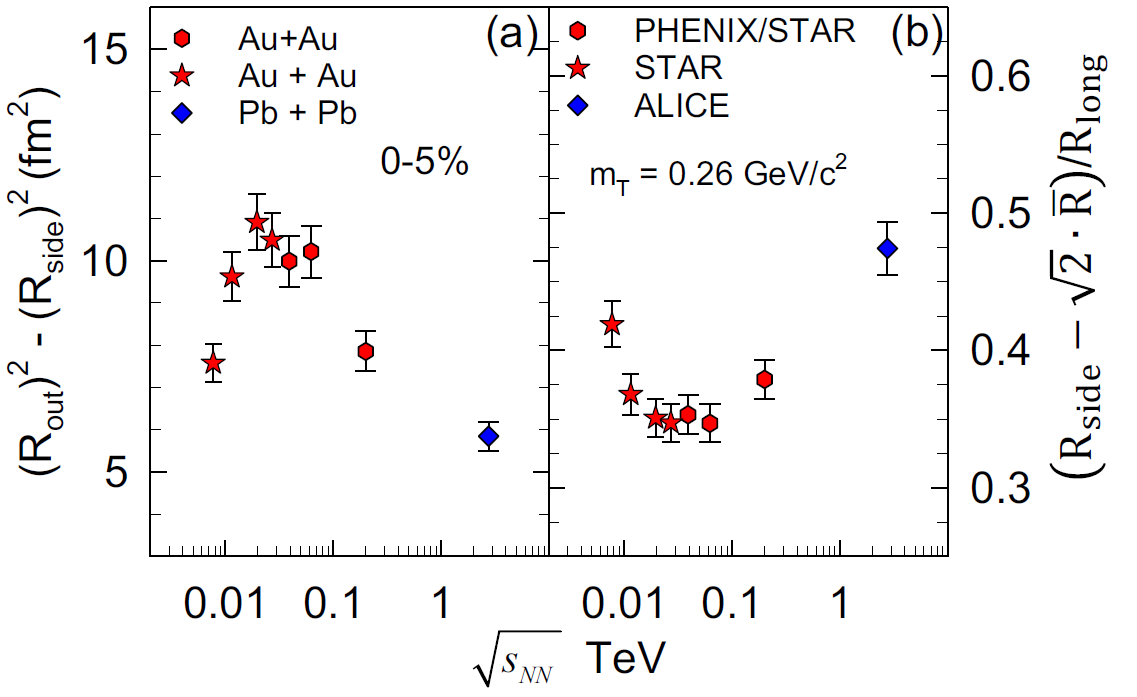
In order to access physical descriptors of the expanding medium like emission duration and expansion velocity, quantities and were measured, as discussed in Ref. [17]. These were investigated as a function of collision energy, and results at GeV, for 0-5% centrality are shown in Fig. 7. The observed non-monotonic pattern near 40 GeV could be an indication of the vicinity of the softest point of the QCD EoS. It is however important to note that the measured HBT radii are smaller than the actual sizes of the system, and are linked to expansion dynamics. Due to the amount and depth of physics involved in these measurements, further experimental studies and full hybrid models are required to confirm if the observed non-monotonic patterns are linked to the critical end point in the QCD phase diagram.
3.5 Levy exponents
At the critical point universal power law behavior of several observables can be seen as a function of the temperature of the system, characterized by critical exponents, one being that of the spatial correlation function. Levy distributions are present in the experimental momentum correlation functions and the spatial correlation functions restored from it. The Levy-exponent of these correlation functions is equivalent to the spatial correlation exponent, conjectured to be near 0.5 in case of the critical end point [24]. PHENIX performed measurement of the Levy-exponent in 200 GeV Au+Au collisions [25]. At this energy, the exponent is far from both the Gaussian case () and the critical case (). A detailed measurement of the excitation function of the correlation exponent is expected to substantially refine results on the QCD critical end point.
4 Beyond HBT
As present conference volume is about the search for and characterization of the QCD critical end point, this paper cannot be complete without mentioning some more related PHENIX results, beyond HBT.
One set of important results is that of neutral pion spectra, which were measured in 39 GeV to 200 GeV Au+Au collisions. Midrapidity nuclear modification factors measured in the GeV range were compared to each other in Ref. [26]. For central collisions, suppression is significant at 39, 62 and 200 GeV as well. On the other hand, in mid-peripheral 39 GeV collisions, the nuclear modification factor is consistent with unity above GeV.
PHENIX recently measured the anisotropic flow coefficients for identified pions, kaons and protons, relative to the -th order event planes, in 200 GeV Au+Au collisions [27]. These flow coefficients show characteristic patterns consistent with hydrodynamical expansion of the matter produced in the collisions. They all fall on modified quark number scaling curves, if is plotted versus . This may indicate a hydrodynamic expansion, a quark coalescence process, and/or an acoustic nature of the QGP. Interestingly, these scalings with the number of constituent quarks hold for also in 39 and 62 GeV Au+Au collisions [28].
5 Summary
A wide variety of HBT data is now available. Geometric and hydrodynamic scalings are observed for a broad range: HBT radii versus , versus and versus follow simple linear curves. Excitation function of HBT radii however show a non-monotonic behavior near GeV. This may be attributed to non-monotonicity in the emission duration; more detailed analysis and measurements have however to be performed to understand and confirm the relation of this behavior to the QCD critical end point. Measurements of the correlation exponent could for example substantially refine our understanding. There are however other probes measured in the vicinity of this point. Non-monotonic behavior is seen in neutral pion nuclear modifications, while quark number scaling is preserved from 200 GeV to 39 GeV. All of these observables and their excitation functions shuld be understood in a global complex picture, in order to acquire detailed knowledge of the QCD critical end point.
References
- [1] Y. Aoki, G. Endrődi, Z. Fodor, S. D. Katz, and K. K. Szabó Nature 443 (2006) 675–678, hep-lat/0611014.
- [2] J. Mitchell Acta Phys.Polon. B40 (2009) 1087–1092.
- [3] R. A. Lacey Nucl.Phys. A931 (2014) 904–909, arXiv:1408.1343 [nucl-ex].
- [4] R. Hanbury Brown and R. Q. Twiss Nature 178 (1956) 1046–1048.
- [5] G. Goldhaber, S. Goldhaber, W.-Y. Lee, and A. Pais Phys. Rev. 120 (1960) 300–312.
- [6] E. Alt, T. Csörgő, B. Lorstad, and J. Schmidt-Sorensen Phys.Lett. B458 (1999) 407–414, arXiv:hep-ph/9812474 [hep-ph].
- [7] T. Csörgő, B. Lörstad, and J. Zimányi Z. Phys. C71 (1996) 491–497, hep-ph/9411307.
- [8] J. Bolz, U. Ornik, M. Plumer, B. Schlei, and R. Weiner Phys.Rev. D47 (1993) 3860–3870.
- [9] G. Bertsch Nucl.Phys. A498 (1989) 173C–180C.
- [10] S. Pratt Phys.Rev. D33 (1986) 1314–1327.
- [11] S. Pratt, T. Csörgő, and J. Zimányi Phys.Rev. C42 (1990) 2646–2652.
- [12] T. Csörgő and S. Hegyi Phys.Lett. B489 (2000) 15–23, arXiv:hep-ph/9912220 [hep-ph].
- [13] D. Brown, A. Enokizono, M. Heffner, R. Soltz, P. Danielewicz, et al. Phys.Rev. C72 (2005) 054902, arXiv:nucl-th/0507015 [nucl-th].
- [14] T. Csörgő and B. Lörstad Phys. Rev. C54 (1996) 1390–1403, hep-ph/9509213.
- [15] S. S. Adler et al. Phys. Rev. Lett. 93 (2004) 152302, nucl-ex/0401003.
- [16] S. Pratt Phys.Rev.Lett. 102 (2009) 232301, arXiv:0811.3363 [nucl-th].
- [17] A. Adare et al. arXiv:1410.2559 [nucl-ex].
- [18] L. Adamczyk et al. arXiv:1403.4972 [nucl-ex].
- [19] T. Niida, Measurements of Quantum Interference of Two Identical Particles with respect to the Event Plane in Au+Au Collisions at GeV at RHIC-PHENIX. PhD thesis, University of Tsukuba, 2013.
- [20] A. Adare et al. Phys.Rev.Lett. 112 no.~22, (2014) 222301, arXiv:1401.7680 [nucl-ex].
- [21] T. Niida arXiv:1501.06782 [nucl-ex].
- [22] A. Mwai, Beam Energy and System-size Dependence of the Space-time Extent of the Pion Emission Source Produced in Heavy-Ion Collisions. PhD thesis, Stony Brook University, 2014.
- [23] A. Mwai J.Phys.Conf.Ser. 535 (2014) 012025.
- [24] T. Csörgő, S. Hegyi, and W. A. Zajc Eur. Phys. J. C36 (2004) 67–78, nucl-th/0310042.
- [25] M. Csanád Nucl. Phys. A774 (2006) 611–614, nucl-ex/0509042.
- [26] A. Adare et al. Phys.Rev.Lett. 109 (2012) 152301, arXiv:1204.1526 [nucl-ex].
- [27] A. Adare et al. arXiv:1412.1038 [nucl-ex].
- [28] Y. Gu Nucl.Phys. A904-905 (2013) 353c–356c, arXiv:1211.4009 [nucl-ex].