Simultaneous Detection of Water, Methane and Carbon Monoxide in the Atmosphere of Exoplanet HR8799b
Abstract
Absorption lines from water, methane and carbon monoxide are detected in the atmosphere of exoplanet HR8799 b. A medium-resolution spectrum presented here shows well-resolved and easily identified spectral features from all three molecules across the band. The majority of the lines are produced by CO and H2O, but several lines clearly belong to CH4. Comparisons between these data and atmosphere models covering a range of temperatures and gravities yield mole fractions of H2O between -3.09 and -3.91, CO between -3.30 and -3.72 and CH4 between -5.06 and -5.85. More precise mole fractions are obtained for each temperature and gravity studied. A reanalysis of -band data, previously obtained at similar spectral resolution, results in a nearly identical water abundance as determined from the -band spectrum. The methane abundance is shown to be sensitive to vertical mixing and indicates an eddy diffusion coefficient in the range of to cm2 s-1, comparable to mixing in the deep troposphere of Jupiter. The model comparisons also indicate a C/O between 0.58 and 0.7, encompassing previous estimates for a second planet in the same system, HR8799 c. Super-stellar C/O could indicate planet formation by core-accretion, however, the range of possible C/O for these planets (and the star) is currently too large to comment strongly on planet formation. More precise values of the bulk properties (e.g., effective temperature and surface gravity) are needed for improved abundance estimates.
Subject headings:
planetary systems - stars: atmospheres - stars: low-mass, brown dwarfs1. Introduction
The HR8799 planetary system remains unique as the only system to have multiple, directly imaged, planets Marois et al. (2008, 2010). Four planets orbiting HR8799 have been monitored regularly since their discovery, providing the astrometric data needed to estimate their orbital properties and masses. The current astrometric data indicate that all four planets are less than 13 Marois et al. (2010); Fabrycky & Murray-Clay (2010); Currie et al. (2011); Pueyo et al. (2014).
The planets are frequently observed for the purposes of characterizing their atmospheric properties and, in particular, their chemical compositions. The two outer most planets, b and c, have the most comprehensive wavelength coverage including near-infrared (near-IR) spectroscopy at low, Bowler et al. (2010); Barman et al. (2011a); Oppenheimer et al. (2013) and medium, Konopacky et al. (2013) resolutions. The Gemini Planet Imager (GPI) has measured low resolution spectra of planets c and d Macintosh et al. (2014); Ingraham et al. (2014). Spectroscopy of multiple planets orbiting HR8799 allows direct comparisons of atmospheric compositions for a coeval set of planets formed from the same protoplanetary disk. The only other planetary system for which such a comparison is currently feasible is our own Solar System.
The giant planets in our Solar System were likely born with bulk compositions determined by their initial location in the planetary disk and the specific solid-to-gas (Msolid/Mgas) accretion history they experienced. As these initially hot planets cooled with time, their atmospheres experienced various levels of vertical mixing and condensation. The atmospheric composition may have been further altered by continued accretion of solid bodies or mixing with a deep metal rich core. Consequently, the present-day mole fractions for important trace molecules (H2O, CH4, CO2, CO, NH3, N2) of giant planets in our Solar System are the result of numerous chemical and physical processes. Inferring elemental abundances from molecular abundances requires a clear understanding of the atmospheric chemical and dynamical history. Even for Jupiter and Saturn only upper limits on carbon-to-oxygen ratio (C/O) have been measured, a poignant reminder of how challenging such measurements can be Wong et al. (2004); Visscher & Fegley (2005). Despite this complex connection between present-day composition and the composition at birth, it remains plausible that the present-day molecular abundances hold clues pertaining to the formation history of our giant planets. By observing young giant planets, like those orbiting HR8799, billions of years of atmospheric evolution that blurs the connection between atmospheric properties and the formation process is avoided.
Presented below are new observations of HR8799 b that provide comparable wavelength coverage, spectral resolution and signal-to-noise (SNR) as similar observations of HR8799 c that revealed individual resolved water and carbon monoxide absorption features (Konopacky et al., 2013, hereafter K13). For HR8799 b, the mole fractions of these two molecules as well as methane are determined using well-resolved spectral features. From these mole fractions, the coefficient of eddy diffusion () and C/O are estimated.
2. Observations and Spectrum Extraction
HR8799 b was observed in 2013 on July 25, 26 and 27 (UT) with the OSIRIS instrument Larkin et al. (2006) in the band using an identical instrument configuration as previous work by this group (Barman et al., 2011a, hereafter B11) resulting in 5.2 hrs of on-target integration time under good observing conditions. The data were calibrated and rectified to produce three-dimensional basic calibrated data cubes Krabbe et al. (2004). The data were initially binned to and speckles suppressed following B11. As in B11, at low-, the spectrum SNR is limited by residual correlated speckle noise. Despite the increase in signal from combining the 2009 to 2013 observations, the updated low- spectrum has mostly unchanged uncertainties and matches the earlier B11 spectrum. The -band spectrum was absolute flux calibrated using the magnitude () reported in B11.
At the full resolution and sampling provided by OSIRIS, errors in flux are correlated across several wavelength channels and may alter the relative depth of narrow absorption features. Subtracting the continuum, modeled as a smoothed version of the observed spectrum, removes many residual speckle artifacts that vary smoothly with wavelength (K13). Inevitably, however, speckle artifacts that depend more strongly on wavelength (e.g., produced by optics near the focal plane) likely remain even in a continuum-subtracted spectrum. Despite potential lingering artifacts, this strategy worked well in K13 and is adopted here using the ensemble of data from 2009 through 2013, median-combined into a single spectrum. Given the wide angular separation of HR8799 b, residual speckle artifacts should be less severe than they were for HR8799 c. The RMS uncertainties in the continuum-subtracted spectrum closely matches the photon-noise limit. The low- spectra from various observing runs show no significant differences across this four year time frame and intrinsic variability would likely occur over timescales of days rather than years and impact broader wavelength ranges than the spectral lines of interest.
3. Model Spectra
For this study, the grid of exoplanet atmospheres models described in B11 was updated to include the methane linelist from Yurchenko & Tennyson (2014) supplemented with optical opacities from Karkoschka & Tomasko (2010). The former update added approximately 10 billion transitions to the overall molecular opacities and improves the accuracy of line strengths at high temperatures – across the -band alone there are roughly a billion transitions. The methane abundance is low in non-equilibrium chemistry models appropriate for HR8799 b (B11) and, consequently, there were only minor changes to the model atmosphere structures after this opacity update. Nevertheless, the ExoMol methane list is currently the most accurate and complete list available and the observations analyzed here have a resolution where accurate line data are important when studying atmospheric abundances.
The opacity of solid and liquid particles suspended in the atmosphere (clouds) are included using the parameterized intermediate cloud model described in B11. Briefly, the lower boundary of the clouds are determined by chemical equilibrium while the upper boundary is described by an exponential decay that begins at a specified pressure. This outer pressure is a free parameter that establishes the cloud thickness, allowing for a range of models with cloud opacity between the high (DUSTY) and cloud-free (COND) cases often used to bracket the importance of clouds Allard et al. (2001). The particle size distribution is a log-normal with mean size set to 5 m. Cloud thickness plays an important role in determining the overall spectral shape and is included as a free parameter in the model fits discussed below (following B11).
Synthetic spectra were calculated with a wavelength sampling of 0.05Å from 1.4 to 2.5 m. Each of these synthetic spectra was convolved with a Gaussian kernel with FWHM matching the OSIRIS spectral resolution before interpolating onto the observed wavelength grid. These medium-resolution spectra were continuum-subtracted following the steps in K13.
4. Results
4.1. HR8799 b versus c
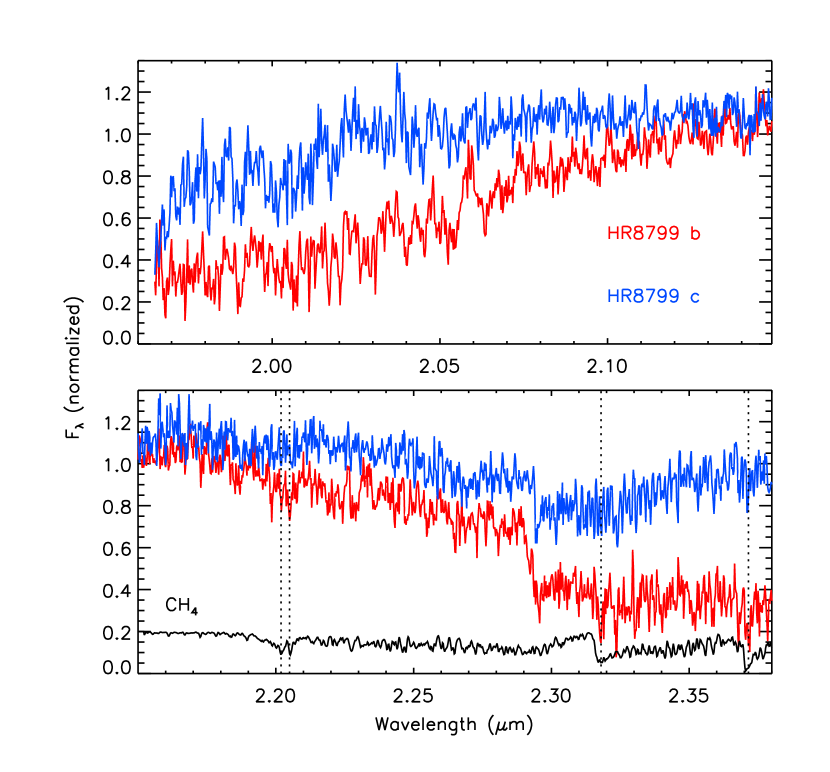
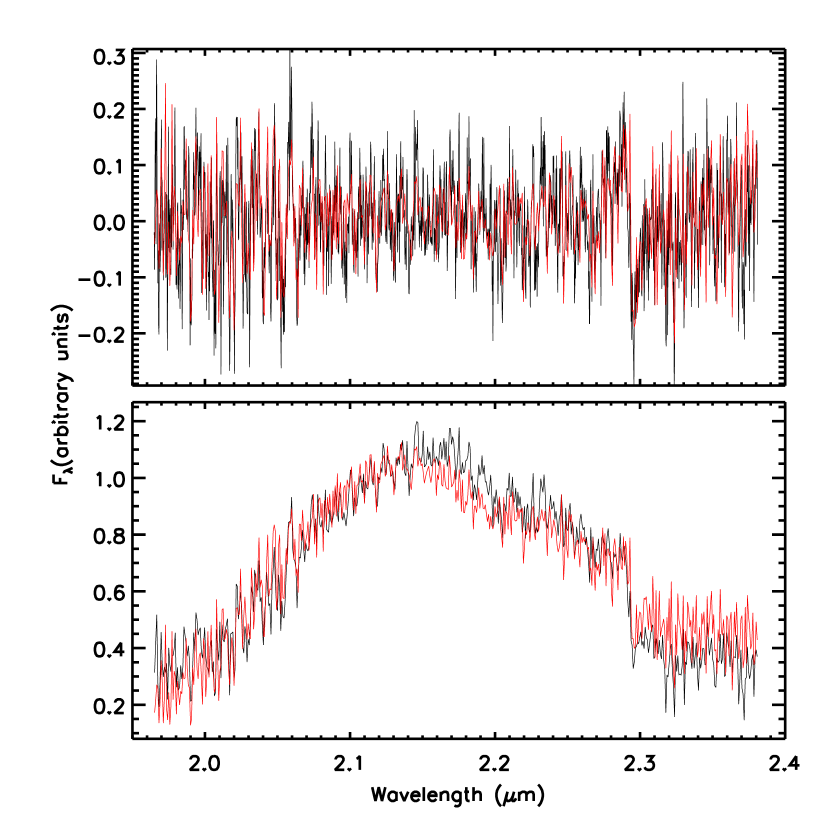
Figure 1 compares the spectrum of HR8799 b to that of HR8799 c. Both exoplanet spectra contain a similar set of absorption features, with most of the similarities at wavelengths of prominent H2O absorption; however, most lines are deeper in the spectrum of b. The CO (2,0) band-head at 2.3 m is detected now with medium spectral resolution but only marginally present at low- (B11). This band-head appears slightly deeper and has a shallower slope in the spectrum of b than c, the result of stronger water absorption and additional CH4 lines for HR8799 b in this wavelength range. Three regions of CH4 absorption are visually identifiable between 2.15 and 2.4 m (lower panel of Fig. 1). The strongest methane lines are seen around 2.32 and 2.37 m. None of these features are present in the spectrum of c, consistent with the methane non-detection reported by K13. A few additional CH4 lines are marginally identified around 2.25 m, however, many of the weaker CH4 lines overlap with those of H2O and CO, making visual identification difficult.
4.2. Cross-Correlation
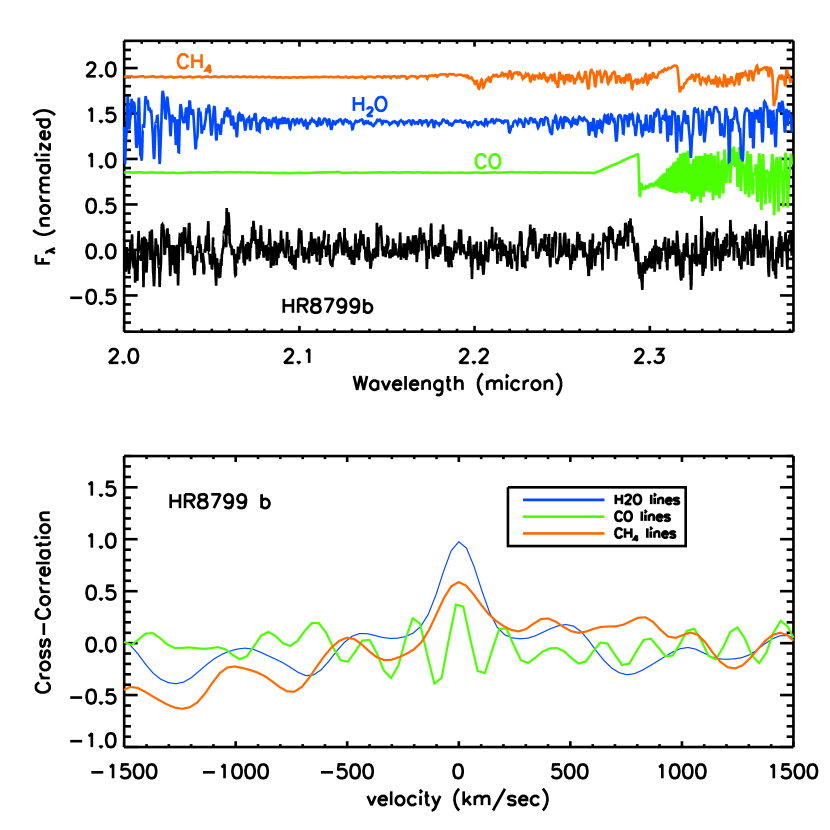
As an additional confirmation that spectral features from all three molecules are present in the OSIRIS spectrum of HR8799 b, a cross-correlation analysis was used following K13. In this case, a new CH4 template was calculated using roughly a billion of the strongest transitions across the band Yurchenko & Tennyson (2014). Water and CO templates were calculated using lists from Barber et al. (2006) and Goorvitch (1994). Figure 2 compares the cross-correlation functions (CCFs) for each template. Peaks in the CCFs are found for all three molecules at identical velocities, centered on zero km/s. As was the case for HR8799 c, a peak with maximum near 1 is found for H2O, indicating that this molecule contributes most of the spectral lines. CO also shows the characteristic ringing pattern, produced by near-repeating patterns of CO lines, many separated by roughly 200 km/s in velocity. This same CCF pattern was found for CO in HR8799 c by K13, with peak of 0.6 compared to 0.4 here. A peak in the CCF for CH4 is present, but not as prominent as found for H2O, mainly because much of the weak-line information is blended with other stronger lines at this resolution.
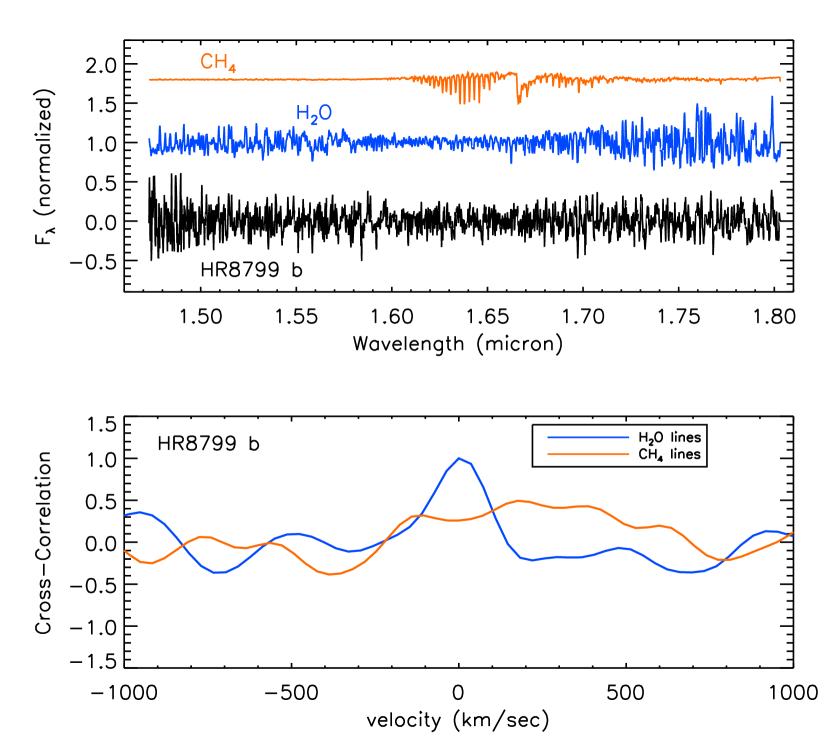
-band observations were previously obtained using the same telescope and instrument combination as used for -band and were originally analyzed at low resolution in B11. These data have been reanalyzed and continuum-filtered at full resolution (also ) following the same steps as band. The average SNR of these data is about 3 times lower than the band data and show a pattern of lines that are visually difficult to identify. B11 concluded that water is the dominant molecular opacity source in this wavelength range and this is confirmed here by a cross-correlation analysis. The CCFs for H2O and CH4 templates across the band are plotted in Figure 3. Correlating the data with an -band H2O template yields a strong peak in the CCF (Fig. 3). No peak was detected for an -band CH4 template (using the ExoMol list).
The HR8799 b -band spectrum also correlates well with the HR8799 c spectrum, another indication that both planet spectra share similar spectral patterns of H2O and CO lines. The CCF was also recalculated for HR8799 c using the new CH4 template and no peak was found, confirming the non-detection of CH4 reported by K13.
4.3. Model Comparisons
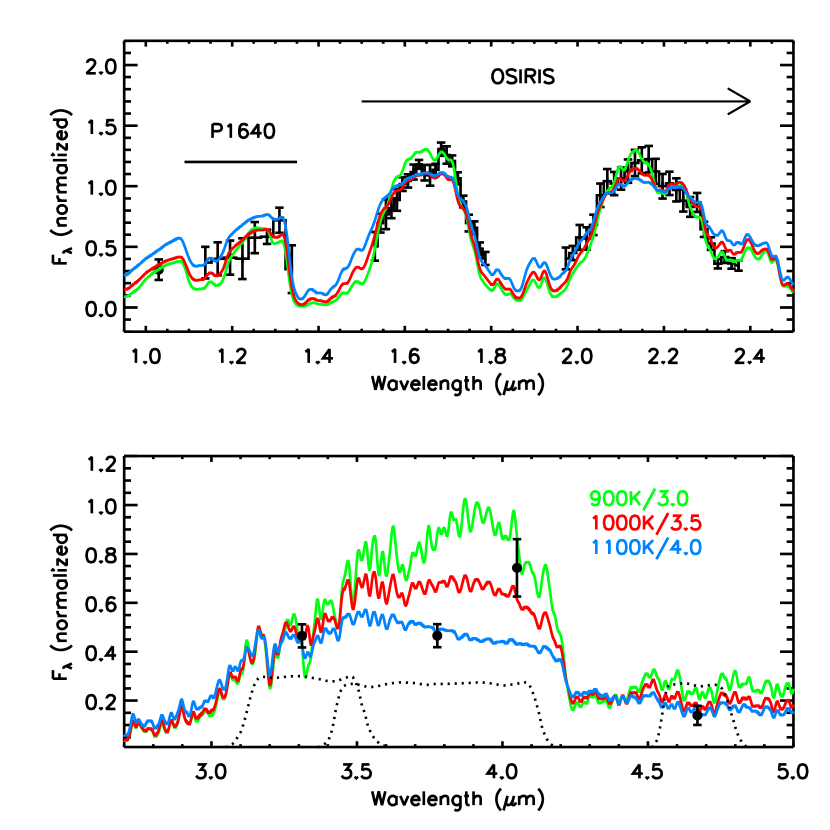
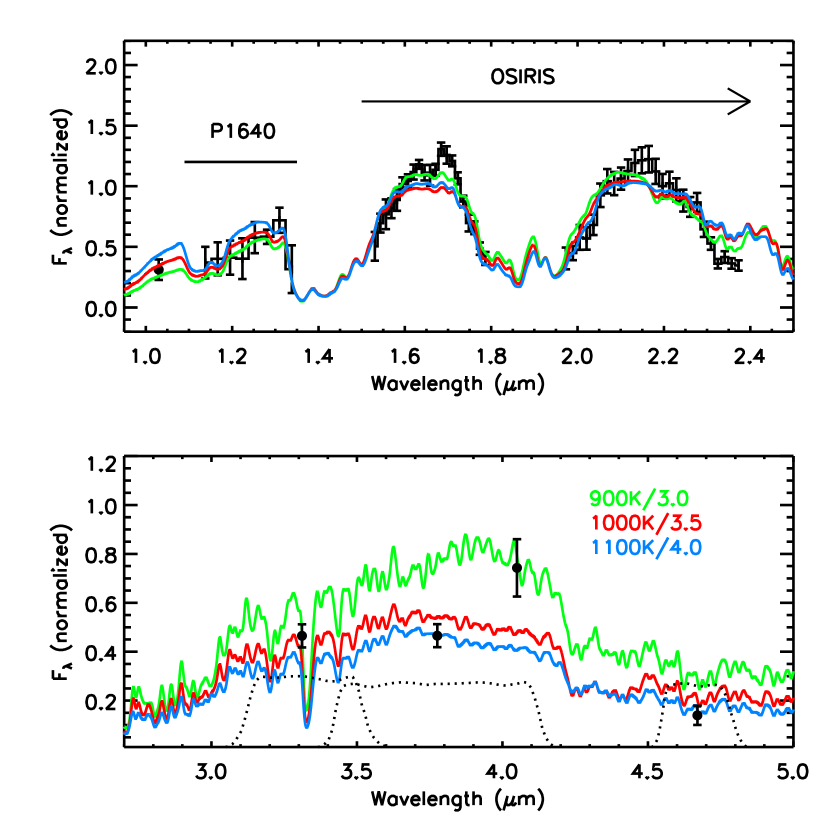
For the atmospheric abundance study presented below, it is important that the underlying thermal structure of the models, especially across most of the photosphere, is reasonably correct. Atmospheres of giant planets are generally close to local thermodynamic equilibrium and, thus, a model matching the planet’s spectral energy distribution over a wide wavelength range should have a thermal profile that reasonably approximates the planet’s average thermal structure. A similar model comparison as performed by B11 was repeated, but comparing updated models with the new CH4 list to the new medium-resolution unfiltered spectrum discussed above and additional flux calibrated data spanning 1 to 5 m. For wavelengths less than 1.8 m the z/Y-band flux of Currie et al. (2011), the low- P1640 -band spectrum Oppenheimer et al. (2013) and the -band spectrum from B11 were used. Photometric data was used at wavelengths longer than 3 m Galicher et al. (2011); Skemer et al. (2012); Currie et al. (2014). The data used for the model fits are plotted in Figure 4.
The relative flux calibration of the near-IR spectra from OSIRIS and P1640 could impact the model comparisons, as these spectra are calibrated using and photometry that have a range of reported values and uncertainties Marois et al. (2008); Metchev et al. (2009); Esposito et al. (2013). It is also possible that HR8799 b is variable as indicated by studies of brown dwarfs Metchev et al. (2015). Such potential issues are not accounted for here and the and flux calibration described in B11 is used. A small scaling was applied so that the -band portion of the P1640 spectrum matches the -band OSIRIS spectrum, resulting in a slight change in the absolute fluxes of the P1640 -band spectrum plotted in Figure 4.
Example spectra of the best matching solar abundance models are plotted in Figure 4, for a range of between 900 and 1100K and between 3.0 and 4.0. The best matching model has the same gravity as found previously by B11 ( = 3.5) but cooler ( =1000K). Across the near-IR, the model spectra do a reasonable job reproducing the observations. When fitting the observations (photometric and spectroscopic), all data are weighted equally. Between 3 and 5m, however, the model comparisons to available photometric data (from a variety of telescopes, epochs and image processing methods) show disagreements at and m. Similar levels of disagreement at this wavelength are seen in other model comparisons Marley et al. (2012); Skemer et al. (2012); Currie et al. (2014). These photometric observations probe similar atmospheric depths and, therefore, pull model fits in opposite directions in both and . Further observations across this spectral region is probably warranted. Previous studies of HR8799 b result in a range of between 750 and 1200K and between 3 and 4.5 (see Marley et al. 2012, their Table 1), encompassing the range explored here.
Model atmosphere parameters are sometimes intentionally biased to match predictions of cooling tracks, providing guaranteed consistency between , , (and ) and mass/radius expectations. Such forced agreement can be useful, but is not done here. More important is finding a range of atmospheric temperature-pressure profiles that yield pseudo-continua that are as consistent as possible with the observed spectral energy distribution. Good agreement between bulk parameters found by atmosphere-only fitting and those inferred from cooling tracks, age and luminosity can be challenging for low-temperature planet-mass objects, likely a result of complexities of their atmospheres not reproducible by time-independent one-dimensional models with simplistic cloud prescriptions. Consequently, a conservative ranges of ( 0.5) and ( 100K) around the best matching values are used for the abundance analysis discussed below, despite potential inconsistencies with cooling track predictions at the high and low ends of these ranges.
4.4. Mole Fractions of CO, CH4 and H2O
At low spectral resolution, the slopes on either side of the -band peak are very similar to those seen in substellar atmospheres where water is the dominant opacity source. B11 showed (their Fig. 14) that CO and CH4 likely contribute to the -band opacity but, at low resolution, the CO band head was not confidently detected nor any significant hints of CH4, making it difficult to assess their relative importance. Bowler et al. (2010) also found no evidence of methane absorption in their narrow-band spectrum covering to 2.2 m. With resolved absorption features from all three molecules identified, their individual abundances can now be determined.
Evidence for quenching of CO and CH4 in the atmospheres of the HR8799 planets has been established elsewhere Hinz et al. (2010); Barman et al. (2011a); Skemer et al. (2012); Marley et al. (2012). An important consequence of this mixing-induced non-equilibrium chemistry is that the mole fractions should be nearly independent of height across the photosphere. The absence of height-dependence greatly simplifies the parameterization of the mole fractions, allowing straightforward model fitting using standard minimization.
The mole fractions are determined sequentially by computing grids of synthetic spectra (continuum filtered) with scaled molecular abundances for 9 different temperature-pressure (T-P) profiles corresponding to = 900, 1000, and 1100K and = 3.0, 3.5, and 4.0. These temperatures and gravities bracket those found when comparing models to the broad wavelength data shown in Figure 4. A spectrum is calculated for each mole fraction value and model temperature-pressure profile. The mole fractions of CO, CH4 and H2O are each scaled from 0 to 1000 relative to their non-equilibrium solar abundance values using a uniform logarithmic sampling (resulting in 100 synthetic spectra per T-P profile).

The mole fraction of H2O was determined first, keeping CO and CH4 at their solar values. To avoid biasing in the H2O mole fractions caused by overlapping CO or CH4 lines, the fit was restricted to wavelengths less than the CO band head, while masking the strongest CH4 line region (near 2.2 m). Following this step, a second grid of synthetic spectra was calculated with the H2O mole fraction equal to the best-fit value from the previous step, CH4 at its solar value, and now mole fractions of CO scaled as previously done for H2O. In this case, only wavelengths greater than (and including) the CO band head were fit, while masking the strong CH4 line near 2.32 and 2.37m. In the final step, using the best-fitting H2O and CO mole fractions, a third grid of synthetic spectra was made with scaled CH4 mole fractions. Only the strongest CH4 lines from 2.2 to 2.37 m were included in this fit.
The model with the overall lowest from this three-step fitting process has a slightly lower gravity (= 3.0) than the best matching solar abundance model compared to the full SED. The distributions for the mole fractions in this model are plotted in Figure 5, with mole fractions of H2O, CO and CH4 are , , and , respectively, with the model spectrum compared to the -band observations in Figure 6. Both H2O and CO are about half the non-equilibrium solar value while CH4 is about 15 times lower than the non-equilibrium solar value (see vertical dashed lines in Fig. 5). The best matching mole fractions for each and are listed in Table 1, with formal 1- errors determined from the distributions. These values can be compared to the range of solar (non-equilibrium) mole fractions by using Figure 12 (see vertical dashed line), discussed below.
The filtered -band spectrum is used to determine the molecular abundances primarily because it is a single data set from a single instrument with uniformly characterized uncertainties. It is important, however, to verify that the resulting mole fractions still yield spectra that are in reasonable agreement with the full SED. Figure 7 compares model spectra to the full SED for three different and values and corresponding mole fractions listed in Table 1, and the comparisons remain good across the near-IR. The thermal IR includes absorption bands from CH4, CO and CO2, providing a potential secondary test of the abundances. In all cases, the model flux at 3.3m, which probes a methane fundamental absorption band, is close to the observed value. The fluxes across the CO and CO2 absorption bands between 4 and 5m changes considerably for the range of values found here, however, the observed ground-based photometry, with measurements on either side of the absorption bands, do not probe CO or CO2 absorption well.
As discussed above, H2O is detected in the med-resolution -band spectrum by cross-correlation (Fig. 3). Mole fractions for H2O were obtain by fitting the -band data in a similar manner as for band, using synthetic spectra with scaled H2O and CH4 mole fractions. A clear -minimum was found for water for the same mole fraction as found by fitting the -band spectrum, but with much larger uncertainties. CH4 was not detected (consistent with the cross-correlation test) and only an upper limit was found (see dashed lines in Fig. 5).
The mole fractions determined above are sensitive to the thermal profile, surface gravity, individual line broadening parameters, and potential residual artifacts in the data. Uncertainties associated with these properties are difficult to quantify without a more complex statistical analysis of the model comparisons and is beyond the intended scope of this paper. For example, the mole fractions depend on the model atmosphere surface gravity, but it is unlikely the planet’s gravity falls outside the range explored here, given the limits placed on gravity by other data. The details of the cloud properties (coverage and thickness) are partially mitigated by the continuum subtraction process but may still impact the inferred mole fractions indirectly though degeneracies in the surface gravity and effective temperature estimation. Uncertainties in translate into a small ( dec) changes in the mole fractions. Future refinement of the mole fractions will benefit most by improved determinations of . Surface gravity broadens spectral lines and, in principle, the width of auto-correlation functions for models of various surface gravities could be used to determine gravity’s contribution to the total line broadening. Unfortunately, even a resolution of 4000 ( km s-1) is too low for such an exercise to yield better gravity estimates than those based on model fits to lower resolution data (e.g., fitting shapes of and band spectra).
| molecule | 3.0 | 3.5 | 4.0 | |
|---|---|---|---|---|
| 900 | -3.82 | -3.39 | -3.09 | |
| H2O | 1000 | -3.85 | -3.55 | -3.12 |
| 1100 | -3.91 | -3.58 | -3.24 | |
| 900 | -3.61 | -3.48 | -3.30 | |
| CO | 1000 | -3.67 | -3.61 | -3.33 |
| 1100 | -3.72 | -3.61 | -3.30 | |
| 900 | -5.85 | -5.55 | -5.18 | |
| CH4 | 1000 | -5.85 | -5.48 | -5.12 |
| 1100 | -5.79 | -5.42 | -5.06 |
4.5. Estimating
Vertical mixing is often characterized by the coefficient for eddy diffusion () where the vertical mixing timescale above the convection zone is / and is an effective length scale usually a few tenths the pressure scale heightSmith (1998). Below the point in the atmosphere where the mixing timescales are shorter than chemical reaction timescales, the atmosphere will be in chemical equilibrium. Most chemical reactions are fast, however, the reactions governing CO and CH4 have one or more rate-limiting steps that result in long chemical timescales Visscher et al. (2010); Zahnle & Marley (2014) that rapidly increase with decreasing density, quickly exceeding the age of the planet by many orders of magnitude. The ultimate consequence is that, for plausible values of , the photospheric mole fractions of CO and CH4 (as well as others, e.g., N2, NH3, and CO2) may no longer depend on the photosphere conditions but instead on the conditions deeper in the atmosphere where the chemical and mixing timescales become comparable.
The detection of CO in Jupiter’s atmosphere is an excellent example of vertical mixing in action. For the very low temperatures in Jupiter’s atmosphere (K), the majority of carbon is in CH4 at an abundance that is essentially constant with height. Therefore, if quenching occurs in the atmosphere, the photospheric CH4 will be unchanged. The equilibrium photospheric mole fractions of CO, on the other hand, are small and rapidly decreasing with height. If pure chemical equilibrium persisted throughout, CO would be nearly impossible to observe. Yet, photospheric CO absorption has been measured, evidence that non-equilibrium chemistry is at work, and the CO abundance used to estimate the value of Fegley & Lodders (1994).
In the atmospheres of young giant exoplanets as hot as HR8799 b () the situation for CO and CH4 is reversed Barman et al. (2011b); Zahnle & Marley (2014). At pressures (between 1 and 10 bar, the temperatures are hot enough for CO to be thermochemically favored over CH4. Also, the quenching can occur at or near depths where equilibrium mole fractions are height-dependent for CH4 and nearly height-independent for CO. An important outcome is that, much like CO in Jupiter, measurements of CH4 can be used estimate in the atmospheres of planets like HR8799 b.
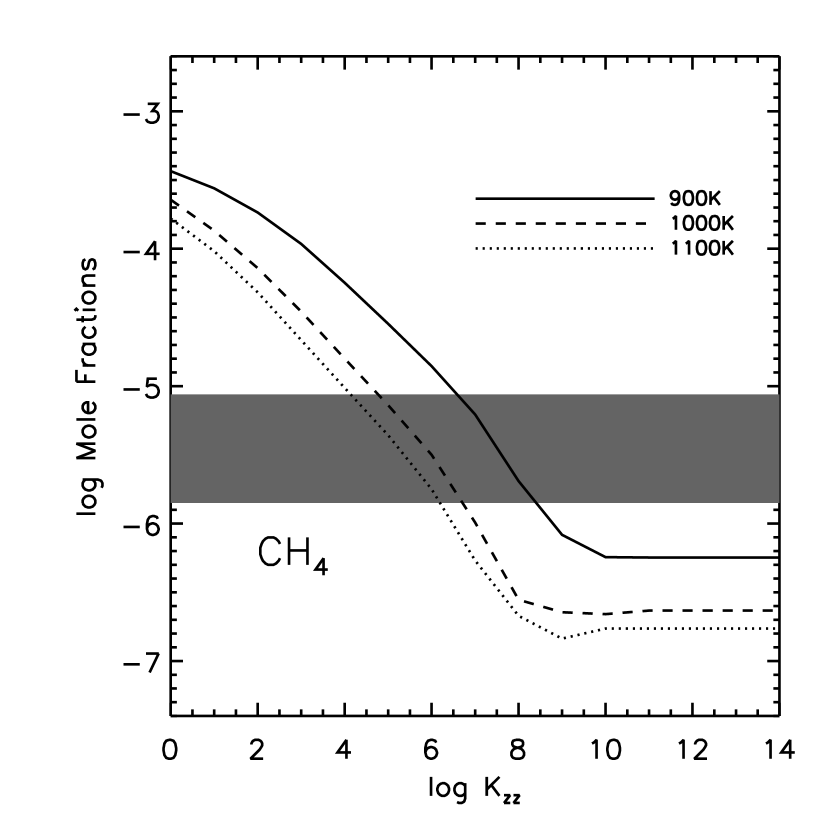
The photospheric CH4 mole fractions versus are plotted in Figure 8 for solar composition and a range of appropriate for HR8799 b. Only for does become independent of CH4. The range of inferred mole fractions for methane (horizontal shaded region in Fig. 8) indicate around 7 for ; however, the mole fractions at the quenching depth are temperature and gravity dependent leading to an uncertainty in of about 100 cm2 s-1. Large departures from solar C and O abundances could change the inferred , however, as argued below, it is unlikely that C/O is very far from solar.
4.6. C/O Ratio
The C/O ratio for HR8799 c was found to be slightly above that of the host star, tentatively favoring the core-accretion formation scenario over gravitational instability (K13). Determining the C/O for HR8799 b is an important next step in understanding the formation history of this planetary system.
The photosphere of HR8799 b is not in chemical equilibrium, as discussed above, with both CO and H2O quenched deep in the atmospheres. Deep quenching of carbon and oxygen-bearing molecules has important implications for inferring the relative C and O element abundances from the molecular mole fractions. Even young giant planets, still hot from recent formation, have atmospheres cool enough to allow solids and liquids to form, including silicate grains (e.g., MgSiO3, Mg2SiO4). The abundance of these grains is limited by the overall abundance of Si, and will sequester a non-negligible fraction of the Oxygen atoms. The photosphere of HR8799 b is well below the temperatures needed for condensation to occur and, as a result, the inventory of Oxygen should account for both the mole fractions of silicate grains and Oxygen-bearing molecules. However, for the atmosphere of HR8799 b, models indicate that the temperature at the quenching depths is above 2000K and, thus, above the condensation temperature for major oxygen-depleting grains. In the case of the HR8799 planets, non-equilibrium chemistry simplifies the C/O ratio dependence on atmospheric mole fractions (N) to
| (1) |
and for small amounts of CH4, the C/O ratio is determined by H2O and CO alone.
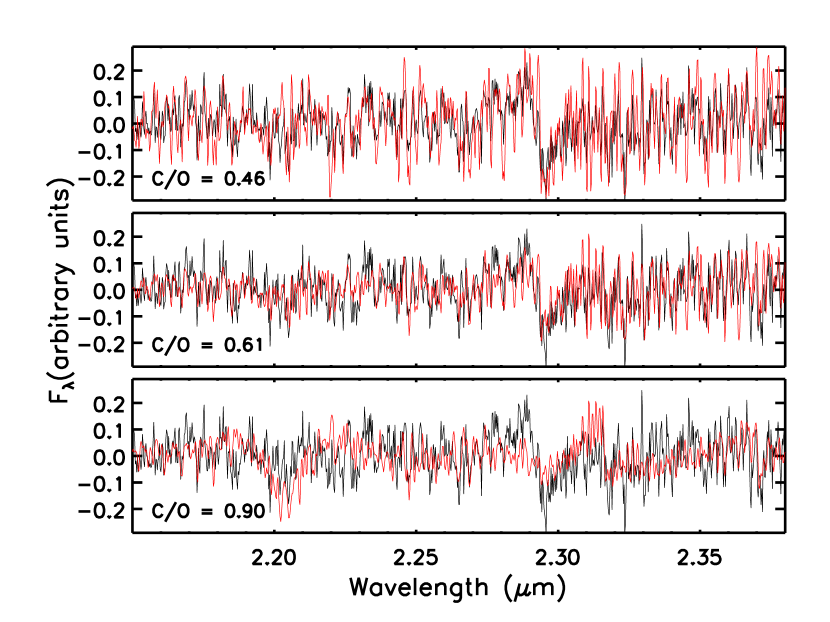
Equation 1 and the mole fractions determined above (Table 1) for each model atmosphere and , results in C/O values between 0.4 and 0.7. This large range in C/O is mostly driven by the comparably large range of acceptable values for , with C/O decreasing as increases. The mole fractions for the best matching model yield C/O = 0.61 (with 1- error determined from the formal errors in Table 1). Figure 9 compares the continuum-filtered observations to the best overall model from §4.6 (C/O = 0.61) and models with high and low C/O, to illustrate the changes in the spectrum as the relative molecular abundances change.

5. Atmospheric Composition and Formation
If giant planets form primarily by a quick one-step process via gravitational instabilities (GI), their atmospheres should have element abundances equal to the host star Helled & Schubert (2009). On the other hand, if giant planets form primarily by the multi-step core-accretion (CA) process, a range of element abundances are possible Öberg et al. (2011). The abundances of a gas giant’s atmosphere formed via CA primarily depend on the location of formation relative to the frostlines for major carbon and oxygen bearing molecules in the disk (namely H2O, CO2 and CO) and the amount of solids acquired by the planet during the runaway accretion phase. The four planets orbiting HR8799 offer an excellent opportunity to test this idea. Each planet currently orbits between the H2O and CO2 frostlines and potentially built up atmospheres from gas with similar amounts of solids.
In K13, the observed continuum-filtered spectrum of HR8799 c was compared to atmosphere models restricted to a sequence of C and O element abundances derived from the Öberg et al. (2011) chemical model. The Öberg et al. model provides values for the C and O abundances, relative to the stellar values, for different amounts of solid accretion during the buildup of the planetary envelope. These abundances are plotted in Figure 10 for planets forming between the H2O and CO2 frostlines. In this model, both C and O abundances are linear functions of solid accretion, Msolid/Mgas, with slope and intercept set by the fraction of C (or O) sequestered by condensate formation and the overall grain/gas fraction in the disk. These assumptions are based on observations of protoplanetary disks and the interstellar medium (see Table 1 of Öberg et al. 2011). Solar C and O abundances have been suggested for HR8799 Sadakane (2006) and are adopted as the baseline here Asplund et al. (2009). It should be noted, however, that this star is a -boo type star with solar C, N and O abundances but sub-solar Fe-peak elements.

A high level of solid accretion during planet formation raises both C and O abundances, with O abundances increasing more rapidly than C for the simple reason that H2O-ice is the most abundant solid between the H2O and CO2 frostlines. The combined effect is C/O decreasing as Msolid/Mgas increases. The model proposed by Öberg et al. is a simple prescription for a complex process and, consequently, deviations from this model are to be expected. Despite its simplicity, the predicted C and O abundances provide an ideal baseline for testing potential outcomes of CA formation specific to the HR8799 system.
In order to make a direct comparison to the K13 results, the observed spectrum of HR8799 b was analyzed in a similar manner as HR8799 c. Given the CH4 update made to the model atmospheres, the fit was repeated for HR8799 c. Only the C/O values for atmosphere accretion occurring between the H2O and CO2 frostlines (the current locations of all four HR8799 planets) were used (see Fig. 10). A was calculated for each continuum-subtracted synthetic spectrum in the and range described above. The resulting distributions are plotted in Figure 11. The best-matching C/O for HR8799 b is 0.66 and the revised best-matching C/O for HR8799 c is 0.64, closely matching K13, but with a broader distribution. The new ExoMol methane absorption strengths across the -band are lower than those from the Warmbier et al. (2009) linelist used in the K13 analysis resulting in smaller values for larger C/O and, hence, a broader distribution of .
The -band continuum shape can also be used to estimate the relative abundance of H2O and CO. Given the wider angular separation of b than c (1.7 versus 1″) from the star, the continuum of b is less affected by residual speckles. The observed spectrum, with continuum intact, was compared to the same set of atmosphere models and C and O abundances. The distribution from this comparison is plotted in the top panel of Fig. 11 and shows both planets having C/O between and 0.7, for similar as in the continuum filtered comparison.
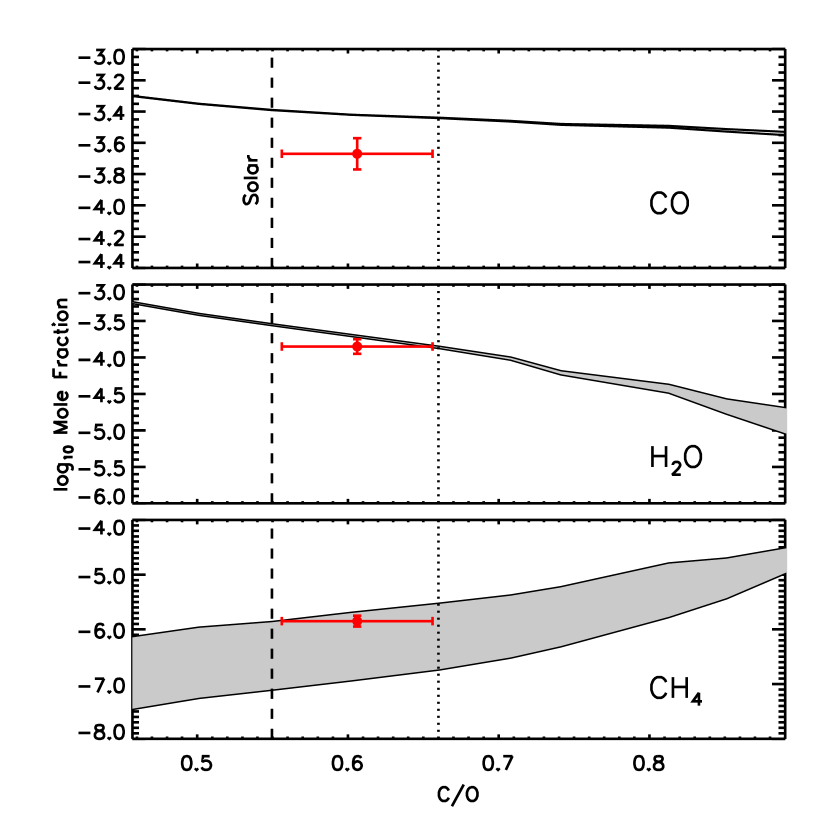
The mole fractions of H2O, CO and CH4 in the photosphere of the best-matching CA-specific atmosphere model can be compared to those found in §4.4, where the molecular abundances were determined independent of any formation model. The mole fractions for the CA-specific atmosphere models are plotted in Figure 12 as functions of C/O, for the range of and explored here. Solar (non-equilibrium) mole fractions and solar C/O are indicated in this Figure by the vertical dashed line. The CA-specific atmosphere model with C/O has H2O and CH4 mole fractions that closely match those found in §4.4. These values are plotted as red symbols with error bars estimated from the formal uncertainties in Table 1 and the CO abundances corresponding to the 1 range in C/O. CO, however, is higher than found in §4.4 for all C/O explored in the CA-specific atmospheres. Even if and are varied (see Table 1), the CO found by freely scaling the abundances remains below what is predicted in the CA-specific atmospheres. Lower would lower CO, but doing so would quickly increase CH4 to values well above what is observed. A lower CO could indicate additional chemical processes not accounted for in the atmosphere or formation models. The significance of this CO difference is hard to assess given the various source of uncertainty in the models not accounted for in the formal mole fraction error-bars. It is possible, for example, that the CO line broadening in the atmosphere models is under (or over) estimated, resulting in systematic errors in the inferred abundances (this will be investigated in a future paper).
Compared to H2O and CH4, CO has the weakest dependence on C/O. CH4 and H2O, however, are fairly sensitive to C/O, but their mole fractions can be small () for super-solar C/O. Measuring C/O from CO alone would require a CO abundance more precisely derived than most data presently allow. Perhaps of greater interest, however, are the ratios of the various molecules as C/O changes. For example, for all but the smallest C/O, CO/H2O should be greater than 1. Only for low surface gravity () do the model fits from §4.4 result in N(CO) N(H2O) and, as gravity increase, the discrepancy between the predicted and observed CO and H2O abundances grows. This may provide indirect evidence supporting low surface gravity for HR8799 b.
6. Summary and Conclusions
A new -band spectrum of HR8799 b, with spectral resolution of , was measured and simultaneous detections of water, carbon monoxide and methane absorption lines were made. Identification of lines from each molecule is possible by eye and confirmed by cross-correlating the observed spectrum with absorption templates for each molecule. The abundance of each molecule was determined by a fitting procedure where the mole fractions are treated as free parameters in sequences of synthetic spectra. The ensemble of near-IR to thermal IR observations for HR8799 b are best reproduced by an atmosphere with = 1000, = 3.5. The mole fractions are found to be between -3.09 and -3.91 for H2O, between -3.30 and -3.72 for CO, and between -5.06 and -5.85 for CH4. The best matching models have C/O between 0.55 and 0.7 depending heavily on , as also found in K13, with C/O decreasing with increasing . If the surface gravity is closer to = 4, as predicted by hot-start cooling tracks Baraffe et al. (2003), then CO would be less abundant than H2O (see Table 1) with a C/O . Such a situation would require C and O abundances that deviate from those predicted by the Öberg et al. (2011) model, perhaps resulting from planetesimal accretion or core dredging.
A cross-correlation analysis of -band data from B11, taken at a similar spectral resolution as the -band data, revealed no methane signature. A detection of CH4 absorption lines in the -band but not in may seem unexpected when compared to late-type brown dwarfs that often show more prominent CH4 absorption in than . As shown here, the methane abundance in HR8799 b is many orders of magnitude below that found in the atmospheres of field brown dwarfs, resulting in weaker methane absorption at all wavelengths. For photospheric temperatures and pressures appropriate for HR8799 b, the average methane opacity (in units of cm2/molecule) across is about 10 times stronger than the average opacity across , while the average water opacity is about 10 times stronger than methane in and 10 times weaker than methane in . Consequently, water opacity likely overwhelms that of methane across the band. The characteristics of these opacity sources, combined with lower SNR in the -band data, all contribute to the non-detection of methane in the -band spectrum.
Low methane abundance in HR8799 b is consistent with previous studies of non-equilibrium chemistry in hot, low gravity atmospheres. The mixing ratio of CH4 in young giant exoplanets is, potentially, a useful probe of the vertical mixing. Using the inferred CH4 abundance, the coefficient of eddy diffusion was found to be greater than 106 and very near 107 cm2/s for the preferred = 1000K. These values are consistent with values appropriate for Jupiter’s deep troposphere Visscher et al. (2010). Zahnle & Marley (2014) explore the topic of non-equilibrium CH4 in the context of young giant planets and their predictions are in good agreement with the values presented here.
HR8799 b and c are the first exoplanets to have C/O ratios determined from spectroscopic data with high SNR and high spectral resolution (). Young giant planets, still orbiting their star beyond the H2O-frostline, provide important opportunities to study the link between formation and atmospheric chemistry. The C/O ratios of both HR8799 b and c are similar and potentially super-stellar, but stellar values are not completely excluded. Refinements of C/O and individual molecular abundances will require improvements in the determination of surface gravity, independent of evolutionary models, perhaps with near-IR observations at even higher spectral resolution. Observations with the Hubble Space Telescope, at wavelengths within near-IR water absorption bands, might also help narrow the range of allowed abundances found here (Rajan et al., in prep). But comparisons to such data would face similar limitations as here, associate with effective temperature and gravity. More observations across the thermal infrared (3 to 5m), perhaps with future ground-based integral field spectrographs or with the James Webb Space Telescope, could provide more complete coverage of strong CH4, CO and CO2 absorption bands. New measurements across this wavelength range would also help improve effective temperature and gravity estimates. Model uncertainties need to be better understood as well, in particular those associated with clouds and natural molecular line broadening.
There are now three young directly imaged planet-mass companions (HR8799 b, c and 2M1207B) that show evidence of disequilibrium chemistry in their deep troposphere. While three is too few to constitute a trend, the data and models suggest that chemical quenching is common among this class of exoplanet. For planets as warm as those orbiting HR8799, the quenching likely occurs below the condensation depths and, consequently, bulk C/O ratios are inferable form their photospheric H2O and CO abundances. Given the broad absorption features of these molecules, it may be possible to infer C/O for massive planets from the low resolution spectra provided by GPI, P1640, and SPHERE.
References
- Allard et al. (2001) Allard, F., Hauschildt, P. H., Alexander, D. R., Tamanai, A., & Schweitzer, A. 2001, ApJ, 556, 357
- Asplund et al. (2009) Asplund, M., Grevesse, N., Sauval, A. J., & Scott, P. 2009, ARA&A, 47, 481
- Baraffe et al. (2003) Baraffe, I., Chabrier, G., Barman, T. S., Allard, F., & Hauschildt, P. H. 2003, A&A, 402, 701
- Barber et al. (2006) Barber, R. J., Tennyson, J., Harris, G. J., & Tolchenov, R. N. 2006, MNRAS, 368, 1087
- Barman et al. (2011a) Barman, T. S., Macintosh, B., Konopacky, Q. M., & Marois, C. 2011a, ApJ, 733, 65
- Barman et al. (2011b) —. 2011b, ApJ, 735, L39
- Bowler et al. (2010) Bowler, B. P., Liu, M. C., Dupuy, T. J., & Cushing, M. C. 2010, ApJ, 723, 850
- Currie et al. (2014) Currie, T., Burrows, A., Girard, J. H., Cloutier, R., Fukagawa, M., Sorahana, S., Kuchner, M., Kenyon, S. J., Madhusudhan, N., Itoh, Y., Jayawardhana, R., Matsumura, S., & Pyo, T.-S. 2014, ApJ, 795, 133
- Currie et al. (2011) Currie, T., Burrows, A., Itoh, Y., Matsumura, S., Fukagawa, M., Apai, D., Madhusudhan, N., Hinz, P. M., Rodigas, T. J., Kasper, M., Pyo, T., & Ogino, S. 2011, ApJ, 729, 128
- Esposito et al. (2013) Esposito, S., Mesa, D., Skemer, A., Arcidiacono, C., Claudi, R. U., Desidera, S., Gratton, R., Mannucci, F., Marzari, F., Masciadri, E., Close, L., Hinz, P., Kulesa, C., McCarthy, D., Males, J., Agapito, G., Argomedo, J., Boutsia, K., Briguglio, R., Brusa, G., Busoni, L., Cresci, G., Fini, L., Fontana, A., Guerra, J. C., Hill, J. M., Miller, D., Paris, D., Pinna, E., Puglisi, A., Quiros-Pacheco, F., Riccardi, A., Stefanini, P., Testa, V., Xompero, M., & Woodward, C. 2013, A&A, 549, A52
- Fabrycky & Murray-Clay (2010) Fabrycky, D. C. & Murray-Clay, R. A. 2010, ApJ, 710, 1408
- Fegley & Lodders (1994) Fegley, Jr., B. & Lodders, K. 1994, Icarus, 110, 117
- Galicher et al. (2011) Galicher, R., Marois, C., Macintosh, B., Barman, T., & Konopacky, Q. 2011, ApJ, 739, L41
- Goorvitch (1994) Goorvitch, D. 1994, ApJS, 95, 535
- Helled & Schubert (2009) Helled, R. & Schubert, G. 2009, ApJ, 697, 1256
- Hinz et al. (2010) Hinz, P. M., Rodigas, T. J., Kenworthy, M. A., Sivanandam, S., Heinze, A. N., Mamajek, E. E., & Meyer, M. R. 2010, ApJ, 716, 417
- Ingraham et al. (2014) Ingraham, P., Marley, M. S., Saumon, D., Marois, C., Macintosh, B., Barman, T., Bauman, B., Burrows, A., Chilcote, J. K., De Rosa, R. J., Dillon, D., Doyon, R., Dunn, J., Erikson, D., Fitzgerald, M. P., Gavel, D., Goodsell, S. J., Graham, J. R., Hartung, M., Hibon, P., Kalas, P. G., Konopacky, Q., Larkin, J. A., Maire, J., Marchis, F., McBride, J., Millar-Blanchaer, M., Morzinski, K. M., Norton, A., Oppenheimer, R., Palmer, D. W., Patience, J., Perrin, M. D., Poyneer, L. A., Pueyo, L., Rantakyrö, F., Sadakuni, N., Saddlemyer, L., Savransky, D., Soummer, R., Sivaramakrishnan, A., Song, I., Thomas, S., Wallace, J. K., Wiktorowicz, S. J., & Wolff, S. G. 2014, ApJ, 794, L15
- Karkoschka & Tomasko (2010) Karkoschka, E. & Tomasko, M. G. 2010, Icarus, 205, 674
- Konopacky et al. (2013) Konopacky, Q. M., Barman, T. S., Macintosh, B. A., & Marois, C. 2013, Science, 339, 1398
- Krabbe et al. (2004) Krabbe, A., Gasaway, T., Song, I., Iserlohe, C., Weiss, J., Larkin, J. E., Barczys, M., & Lafreniere, D. 2004, in Society of Photo-Optical Instrumentation Engineers (SPIE) Conference Series, Vol. 5492, Society of Photo-Optical Instrumentation Engineers (SPIE) Conference Series, ed. A. F. M. Moorwood & M. Iye, 1403–1410
- Larkin et al. (2006) Larkin, J., Barczys, M., Krabbe, A., Adkins, S., Aliado, T., Amico, P., Brims, G., Campbell, R., Canfield, J., Gasaway, T., Honey, A., Iserlohe, C., Johnson, C., Kress, E., Lafreniere, D., Magnone, K., Magnone, N., McElwain, M., Moon, J., Quirrenbach, A., Skulason, G., Song, I., Spencer, M., Weiss, J., & Wright, S. 2006, New Astron. Rev., 50, 362
- Macintosh et al. (2014) Macintosh, B., Graham, J. R., Ingraham, P., Konopacky, Q., Marois, C., Perrin, M., Poyneer, L., Bauman, B., Barman, T., Burrows, A. S., Cardwell, A., Chilcote, J., De Rosa, R. J., Dillon, D., Doyon, R., Dunn, J., Erikson, D., Fitzgerald, M. P., Gavel, D., Goodsell, S., Hartung, M., Hibon, P., Kalas, P., Larkin, J., Maire, J., Marchis, F., Marley, M. S., McBride, J., Millar-Blanchaer, M., Morzinski, K., Norton, A., Oppenheimer, B. R., Palmer, D., Patience, J., Pueyo, L., Rantakyro, F., Sadakuni, N., Saddlemyer, L., Savransky, D., Serio, A., Soummer, R., Sivaramakrishnan, A., Song, I., Thomas, S., Wallace, J. K., Wiktorowicz, S., & Wolff, S. 2014, Proceedings of the National Academy of Science, 111, 12661
- Marley et al. (2012) Marley, M. S., Saumon, D., Cushing, M., Ackerman, A. S., Fortney, J. J., & Freedman, R. 2012, ApJ, 754, 135
- Marois et al. (2008) Marois, C., Macintosh, B., Barman, T., Zuckerman, B., Song, I., Patience, J., Lafrenière, D., & Doyon, R. 2008, Science, 322, 1348
- Marois et al. (2010) Marois, C., Zuckerman, B., Konopacky, Q. M., Macintosh, B., & Barman, T. 2010, Nature, 468, 1080
- Metchev et al. (2009) Metchev, S., Marois, C., & Zuckerman, B. 2009, ApJ, 705, L204
- Metchev et al. (2015) Metchev, S. A., Heinze, A., Apai, D., Flateau, D., Radigan, J., Burgasser, A., Marley, M. S., Artigau, É., Plavchan, P., & Goldman, B. 2015, ApJ, 799, 154
- Öberg et al. (2011) Öberg, K. I., Murray-Clay, R., & Bergin, E. A. 2011, ApJ, 743, L16
- Oppenheimer et al. (2013) Oppenheimer, B. R., Baranec, C., Beichman, C., Brenner, D., Burruss, R., Cady, E., Crepp, J. R., Dekany, R., Fergus, R., Hale, D., Hillenbrand, L., Hinkley, S., Hogg, D. W., King, D., Ligon, E. R., Lockhart, T., Nilsson, R., Parry, I. R., Pueyo, L., Rice, E., Roberts, J. E., Roberts, Jr., L. C., Shao, M., Sivaramakrishnan, A., Soummer, R., Truong, T., Vasisht, G., Veicht, A., Vescelus, F., Wallace, J. K., Zhai, C., & Zimmerman, N. 2013, ApJ, 768, 24
- Pueyo et al. (2014) Pueyo, L., Soummer, R., Hoffmann, J., Oppenheimer, R., Graham, J. R., Zimmerman, N., Zhai, C., Wallace, J. K., Vescelus, F., Veicht, A., Vasisht, G., Truong, T., Sivaramakrishnan, A., Shao, M., Roberts, Jr., L. C., Roberts, J. E., Rice, E., Parry, I. R., Nilsson, R., Luszcz-Cook, S., Lockhart, T., Ligon, E. R., King, D., Hinkley, S., Hillenbrand, L., Hale, D., Dekany, R., Crepp, J. R., Cady, E., Burruss, R., Brenner, D., Beichman, C., & Baranec, C. 2014, ArXiv e-prints
- Sadakane (2006) Sadakane, K. 2006, PASJ, 58, 1023
- Skemer et al. (2012) Skemer, A. J., Hinz, P. M., Esposito, S., Burrows, A., Leisenring, J., Skrutskie, M., Desidera, S., Mesa, D., Arcidiacono, C., Mannucci, F., Rodigas, T. J., Close, L., McCarthy, D., Kulesa, C., Agapito, G., Apai, D., Argomedo, J., Bailey, V., Boutsia, K., Briguglio, R., Brusa, G., Busoni, L., Claudi, R., Eisner, J., Fini, L., Follette, K. B., Garnavich, P., Gratton, R., Guerra, J. C., Hill, J. M., Hoffmann, W. F., Jones, T., Krejny, M., Males, J., Masciadri, E., Meyer, M. R., Miller, D. L., Morzinski, K., Nelson, M., Pinna, E., Puglisi, A., Quanz, S. P., Quiros-Pacheco, F., Riccardi, A., Stefanini, P., Vaitheeswaran, V., Wilson, J. C., & Xompero, M. 2012, ApJ, 753, 14
- Smith (1998) Smith, M. D. 1998, Icarus, 132, 176
- Visscher & Fegley (2005) Visscher, C. & Fegley, Jr., B. 2005, ApJ, 623, 1221
- Visscher et al. (2010) Visscher, C., Moses, J. I., & Saslow, S. A. 2010, Icarus, 209, 602
- Warmbier et al. (2009) Warmbier, R., Schneider, R., Sharma, A. R., Braams, B. J., Bowman, J. M., & Hauschildt, P. H. 2009, A&A, 495, 655
- Wong et al. (2004) Wong, M. H., Mahaffy, P. R., Atreya, S. K., Niemann, H. B., & Owen, T. C. 2004, Icarus, 171, 153
- Yurchenko & Tennyson (2014) Yurchenko, S. N. & Tennyson, J. 2014, MNRAS, 440, 1649
- Zahnle & Marley (2014) Zahnle, K. J. & Marley, M. S. 2014, ApJ, 797, 41