On the long-term correlations and multifractal properties of electric arc furnace time series
Abstract
In this paper, we study long-term correlations and multifractal properties elaborated from time series of three-phase current signals coming from an industrial electric arc furnace plant.
Implicit sinusoidal trends are suitably detected by considering the scaling of the fluctuation functions.
Time series are then filtered via a Fourier-based analysis, removing hence such strong periodicities.
In the filtered time series we detected long-term, positive correlations.
The presence of positive correlations is in agreement with the typical V–I characteristic (hysteresis) of the electric arc furnace, providing thus a sound physical justification for the memory effects found in the current time series.
The multifractal signature is strong enough in the filtered time series to be effectively classified as multifractal.
Keywords— Multifractal analysis; Electric arc furnace; Time series analysis; Fourier detrending.
1 Introduction
The analysis of complex systems [11, 20, 7] is recently gaining traction with the development of new computational and theoretical tools, specifically designed to tackle the problem of disentangling the complex interactions among different parts of a process. A common approach for this purpose is the study of scale-invariant properties [37], i.e., those features that manifest in a similar manner at all magnification levels of the system. The scale-invariance property is a peculiar feature of fractal structures, and it is quantifiable by evaluating a suitable collection of scaling exponents that compactly describe how the system evolves when observed at different scales [13]. In particular, the scaling of the correlation properties of a stochastic process could provide valuable information on the underlying dynamical system, especially in cases in which the observed system denotes long-term memory and nonlinear behaviors [18, 9].
Long-term memory properties of a stochastic process are firstly described by power-law like decreasing of the autocorrelation calculated for suitable observables. This feature can be characterized by the value of the so-called Hurst exponent [35], which assumes values in . The value of is 0.5 when the process corresponds to uncorrelated noise, whereas if the process is persistent (correlated) or antipersistent (anticorrelated) then is greater than or less than 0.5, respectively. However, conventional methods employed to analyze the long-term correlations of a time series (e.g., spectral analysis and Hurst analysis) are known to be misleading when data are non-stationary and contains deterministic trends [3, 15]. Therefore, in many experiments it is important to distinguish intrinsic fluctuations characterizing the process from pure trending behaviors. A well-established approach employed to this end is the Detrended Fluctuation Analysis (DFA) [36], which has been successively generalized in the so-called Multifractal Detrended Fluctuation Analysis (MF-DFA) [19, 28, 18]. MF-DFA accounts for the possibility to characterize different degrees of correlation by considering a collection of scaling exponents. Such scaling exponents provide a way to perform classical multifractal analyses on time series. Notably, it is possible to calculate the so-called multifractal spetrum, which describes all relevant multifractal characteristics of the system under analysis. MF-DFA technique has been used in a multitude of contexts, such as breast cancer imaging [12], river flow modeling [26], brain signals [10], solar filaments and sunspots [14, 39], financial returns [41, 25], high-energy physics [23], earth’s gravity [38], protein contact networks [22], and protein molecular dynamics [42].
Detrending is a very crucial aspect in multifractal analysis of time series [1, 21, 4]. In fact, trends are usually a source of spurious multifractal signatures observed in the analyzed series. Conventional MF-DFA is able to deal with trends compatible with (higher-order) polynomials. Nonetheless, trending could appear also as a consequence of periodicities, such as those induced by seasonality for long time series. To this end, Chianca et al. [5] proposed to perform a preprocessing stage involving a Fourier analysis in order to identify and then remove specific frequencies with large amplitude. Such a filtering technique demonstrated to provide good results in several different contexts [27, 26, 40], while however criticisms and limitations of the method have been highlighted in the context of sunspot time series [14].
In this paper, we study long-term correlations and multifractal properties elaborated from time series of three-phase current signals coming from an electric arc furnace (EAF) [30, 31, 29]. EAF modeling and analysis of related data is an active area of research [24, 2, 17, 33, 32, 34]. Previous studies focused mostly on system identification and prediction problems with the aim of power optimization and control. However, to our knowledge there is no track in the literature of studies employing MF-DFA to characterize EAF signals. An EAF is a plant utilized in industrial environments for the production of steel by a melting process of metallic scraps. EAF consists of a cylindrical melting pot covered by a removable vault, inside of which are placed one or more electrodes. The scraps to be molten (metallic charge) are deposited on the bottom of the melting pot and, by applying AC or DC tension to the electrodes, an electric arc is generated between the extremities of such electrodes and the scraps. The current traversing the metallic charge raises its temperature until the fusion point is reached, initiating the melting process. The V–I characteristic of the EAF is the result of a nonlinear process with memory [31], since the electrical current value is determined as a function of both the voltage and the internal state, which in turn is determined by the past states of the system. Such a process gives rise to an electrical phenomenon called hysteresis [6].
Toward removing all implicit periodicities proper of an alternating current setting, the EAF time series are preprocessed via a Fourier-based analysis in order to remove the first few complex coefficients. By analyzing the filtered time series we detected long-term, positive correlations. This outcome is in agreement with the typical V–I characteristic of the EAF, which shows a clear hysteretic behavior, as in fact the equivalent dipole of the arc is a dynamic and nonlinear one [6]. The multifractal signature is consistent among the three-phases and it is strong enough in the filtered time series to be effectively classified as multifractal. Finally, we show that shuffling the series reveals that the multifractal signature is entirely due to the long-term correlations.
The paper is structured as follows. Section 2 provides an introduction to the EAF context. In Section 3 we discuss our results regarding long-term correlations and multifractal properties of the analyzed three-phase current signals. Section 4 provides the concluding remarks and future directions. Finally, in Appendix 4 we introduce the MF-DFA technique.
2 Electric arc furnace and the V–I characteristic
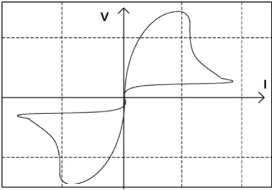
The analyzed EAF [31] is an alternating current furnace powered by a three-phase electrical supply. The plant contains three electrodes placed on the three vertices of a triangle, supported by vertical guides that allow controlling their distance with respect to the underlying metallic charge. When the applied voltage is sufficiently high to break the air resistance, an electric arc is struck from the extremity of each electrode to the metallic charge. In an ideal setting, the electric arc is created each time the absolute value of the alternating voltage exceeds a threshold and, consequently, the current assumes an almost sinusoidal waveform. However, in real-world situations, the V–I characteristic is subject to many sources of noise, such as arc instabilities, non-monochromaticity of the input signal, and metallic charge cave-ins that hinder the analysis of the measured data. The latter effect, for example, might cause sudden drops in the current magnitude.
The V–I characteristic of the system forms a closed trajectory in the tension–current phase space (see Fig. 1). This behavior denotes a branching process in the joint evolution of those two quantities and it is the distinctive feature of a system subject to hysteresis [6]. This implies that the system possesses memory of the previous states. As we will show in this study, the hysteresis can be investigated through the analysis of the long-term correlations of the related EAF current time series.
3 Results and discussion
Our data consists in three current time series, each related to one of the three phases of the EAF under analysis [31]. In the following, we will denote the three phases as A, B, and C. Each time series is composed 1150000 samples, having a sampling frequency of 1920 sample per second. The inter-sample time is hence seconds, which gives a total of roughly minutes of recording. All data are standardized prior to processing.
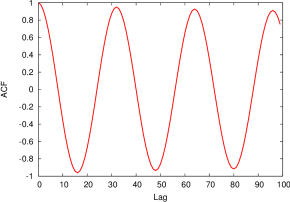
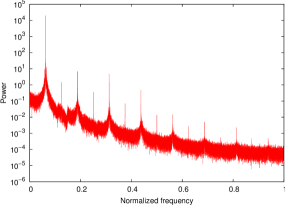
Fig. 2 shows the autocorrelation 2(a) and power spectrum 2(b) for phase A. Autocorrelation is in agreement with a typical sinusoidal waveform of a current signal (60 Hz). The power spectrum offers an insight on the fact that such a signal contains many harmonics of significant power, which correspond to strong periodicities in the series. This is fairly expected, due to the nature of the physical system under analysis. However, in order to avoid the detection of spurious multifractal signatures, it is necessary to eliminate such periodicities. The interest in the analysis of such EAF signals lies hence in the non-linearities that are super-imposed during the melting process on the baseline sinusoidal signal.
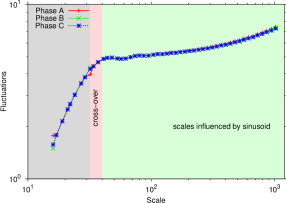
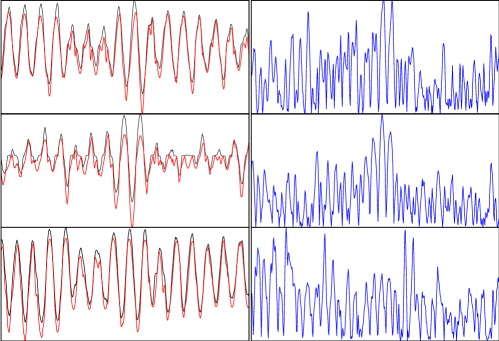
In Fig. 3 we show the scaling of the fluctuations (6) for the three original signals. A cross-over is visible in Fig. 3 at a scale of roughly 32–40 time instants, which corresponds (considering the aforementioned inter-sample time) to a regime of 48–60 Hz. The cross-over is consistent among the three phases, as in fact in the figure the three fluctuation functions overlap almost perfectly. Therefore, fluctuations, when calculated on the original signals, immediately pick up the main sinusoid of the signal due to the frequency of the electrical current. In order to remove traces of all periods in the three current signals, we applied Fourier detrending [27, 5, 26, 40]. The procedure consists in transforming the signal in the Fourier space with the fast Fourier transform. Complex-valued Fourier coefficients are then order according to their amplitude (from larger to smaller). In order to obtain a suitable signal to be processed with MF-DFA, we have zeroed the first 3000 coefficients (corresponding to roughly 1.5 seconds) and then antitransformed the signal back to the time domain. The result of the filtering can be appreciated in Fig. 4. In the figure, we show an excerpt of the original signals together with the identified trends (left panels), while in the right panels we report the corresponding filtered versions. It is worth noting that, as expected, the identified trend is not compatible with a single sinusoid, as in fact the trend in the signal is a combination of the main sinusoid with several harmonics of different power (see Fig. 2(b)). As we will demonstrate in the following, such filtered signals contain long-term, positive correlations and a fair multifractal signature.
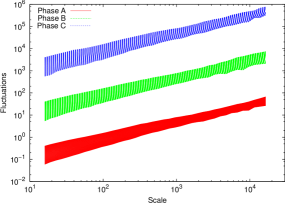
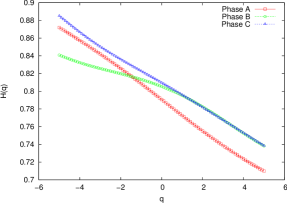
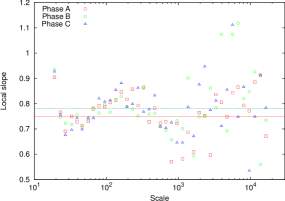
Filtered signals are then analyzed with the MF-DFA procedure, which is described in Appendix 4. MF-DFA has been executed by using scales from 16 up to 16384, ranging in [-5, 5], and with a linear fitting for the local detrending; same outcome has been obtained with a quadratic fitting. Results are reported in Fig. 5. Scaling of fluctuations, shown in Fig. 5(a), provides a confirmation that the filtering stage removed all relevant periodicities in the original signals. In fact, log-log plot of the filtered signals, for all three phases, is now largely consistent with a global power-law scaling. Let us now focus on Fig. 5(b), which shows the generalized Hurst exponents (6). All three signals denote long-term, positive correlations: for phase A, for phase B and C. In Fig. 5(c) we show the local slopes of the fluctuation functions for . Local slopes of the three signals fluctuate around the estimated Hurst exponents (the global slope of the entire fluctuation function). As typically found in synthetic time series [36], higher deviations are observed when moving to larger scales. The discovery of long-term, positive correlations in all three (filtered) electrical current signals is well-justified and it is in agreement with the typical V–I characteristic of EAF (Sec. 2). In fact, hysteresis is a phenomenon that is observed when the output of a (nonlinear) system does not depend only on its current input, but also on past system states. Such a memory effect is imprinted in the EAF time series, as highlighted by the generalized Hurst exponents shown in Fig. 5(b).
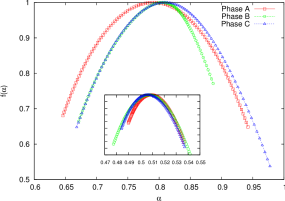
Another important fact in multifractal analysis is the distinction between monofractal and multifractal scaling: if the scaling of a system can be fully characterized by a single exponent (Hurst exponent in our case) then it is monofractal, otherwise it is called multifractal. The analysis of the multifractal spectrum (9) shown in Fig. 5(d) provides the answer to such a question. All three signals denote a fair multifractal scaling: the width (11) of the spectrum is for phase A, for phase B, and for phase C. It is worth mentioning for phase A and C a small but yet visible tendency of being insensitive to larger fluctuations, which can be deduced from the fact that the spectra are slightly right sided. The converse holds for phase B, which instead appear as slightly left sided – as in fact the corresponding Hurst exponents tends to be flat for negative . As discussed by Drożdż and Oświȩcimka [8], right sided spectra are a less usual in experimental time series. The authors [8] offer a mechanism for reproducing such an effect by constructing a synthetic time series starting from a binomial cascade and successively super-imposing a white noise signal considering a suitable threshold for editing the original cascade. However, we believe that in our case such an asymmetry is likely to be a byproduct of the preliminary filtering stage performed via Fourier coefficient truncation. Our results indicate that all three (filtered) time series are compatible with signals having both long-term, positive correlations and a fair amount of multifractal features. This suggests that the non-linearities and memory effects of the melting process are super-imposed on the original current signals as noise. Such a noise retains relevant information regarding the physical process, which we suitably detected by means of MF-DFA.
Multifractality could be observed as a byproduct of the long-range correlations and/or it could emerge as a consequence of an underlying broad probability distribution [18]. Shuffling the time series provides hence a reliable proof to disambiguate the origins of the observed multifractality. In fact, if the multifractal behavior is entirely due to the long-term correlations, then the shuffled signals would not present any multifractality at all; shuffling the data destroys all long-term correlations. This can be quantitatively verified by observing a relevant shrinking of the multifractal spectrum width. On the other hand, if multifractality is (also) due to a broad underlying density, then shuffling would have only a visible but yet limited impact on the width of the resulting multifractal spectrum. As shown in the inset of Fig. 5(d), the shuffled signals do not contain any sign of multifractal signature. This leads us to claim that the observed multifractal properties of the current time series are entirely due to the long-term correlations – the memory effects due to the hysteresis. We argue that a broad probability density function, in our case, might not be possible, due to the EAF physical constraints. In fact, EAF operates in an industrial setting that is suitably controlled in order to achieve specific operating conditions. To summarize, in Table 1 we report all relevant coefficients determined via MF-DFA.
| phase A | phase B | phase C | |
|---|---|---|---|
| 0.75 | 0.78 | 0.78 | |
| 0.51 | 0.56 | 0.56 | |
| 0.30 | 0.21 | 0.31 | |
| (shuffled) | 0.04 | 0.06 | 0.05 |
4 Conclusions and future directions
In this paper, we studied the long-term correlations and multifractal properties elaborated from time series of three-phase electric current measured from an electric arc furnace. Electric arc furnaces are industrial plants used for the production of steel by a melting process of metallic scraps. The V–I characteristic of the EAF under analysis is the result of a nonlinear process having memory. In fact, the value of the electrical current is determined as a function of both voltage and internal state, which in turn is determined by considering the history of the states of the system. Such a process gives rise to an electrical phenomenon called hysteresis.
We initially filtered the original signals via a Fourier based detrending, which we have performed in order to remove the implicit sinusoidal trends due to the alternate current. Our analysis showed that the memory effects of EAF process are suitably encoded into the filtered time series in the form of long-terms, positive correlations, which are quantified by the high values found for the Hurst exponent. Successively, we have shown the presence of a fair multifractal signature in all three time series, confirming thus the complexity of such noisy signals. Finally, shuffling of the (filtered) time series demonstrated that the multifractal signature was entirely due to the long-term correlations of the signals.
Future research works will focus on the study of the long-term and multifractal properties of the cross-correlations between current and voltage time series related to the electric arc furnace.
Multifractal detrended fluctuation analysis
The MF-DFA procedure is extensively described in Ref. [19]. In this work, we partially relied on the software provided by Ihlen [16]. The method consists of five steps, three of which are identical to the DFA version. Given a time series of length with compact support, the MF-DFA procedure is performed with the following steps:
-
•
Step 1 : The series is computed as the cumulative sum (profile) of the series :
(1) -
•
Step 2 : The series is divided in non-overlapping segments of equal length . To account for the possible non-divisibility of by , the operation is repeated in reverse order by starting from the opposite end of the series, thus obtaining a total of segments.
-
•
Step 3 : The local detrending operation is executed by performing a suitable polynomial fitting on each of the segments. Then the variance is determined as
(2) for each segment and
(3) for , where is the fitted polynomial in segment . The order of the fitting polynomial, , determines the capability of the (MF-)DFA in eliminating trends in the series, thus it has to be tuned according to the expected maximum trending order of the time series.
-
•
Step 4 : The th-order average of the variance over all segments is evaluated as
(4) with . The -dependence of the fluctuations function allows to highlight the contributions of fluctuations at different magnitude orders. For only the larger fluctuations contribute mostly to the average in Eq. 4; conversely, for the magnitude of the smaller fluctuations is enhanced. For the standard DFA procedure is obtained. The case cannot be computed with the averaging form in Eq. 4 and so a logarithmic form has to be employed,
(5) The steps 2 to 4 have to be repeated for different time scales , where all values of have to be chosen such that to allow for a meaningful fitting of data.
-
•
Step 5 : The scaling behaviour of the fluctuation functions can be determined by analyzing log-log plots of versus for each value of . If the series is long-range power-law correlated, is approximated (for large values of ) by the form
(6)
The exponent is the generalized Hurst exponent; for it reduces to the standard Hurst exponent, . When the considered time series is monofractal, i.e., it shows a uniform scaling over all magnitude scales of the fluctuations, is independent of . On the contrary, when the small fluctuations scale differently from the large ones, the dependency of on becomes apparent and the series can be considered multifractal.
Starting from Eq. 4 and using Eq. 6, it is straightforward to obtain
| (7) |
where, for simplicity, it has been assumed that the length of the series is a multiple of the scale , such that . The exponent
| (8) |
is the -order mass exponent (also called Rényi scaling exponent) of the generalized partition function, . It is worth mentioning that gives an estimation of the correlation dimension. The multifractal spectrum, denoted as , provides a compact characterization of the multifractality of the time series. Such a function is obtained via the Legendre transform of ,
| (9) |
where , called singularity exponent, is equal to the derivative . Using Eq. 8 it is possible to directly relate and to , obtaining:
| (10) |
The multifractal spectrum (9) allows to infer important information regarding the degree of multifractality and the specific sensitivity of the time series to fluctuations of high/low magnitudes. In fact, the width of the support of , defined as
| (11) |
is a direct and important quantitative indicator of the multifractal signature in the series.
References
- Bashan et al. [2008] A. Bashan, R. Bartsch, J. W. Kantelhardt, and S. Havlin. Comparison of detrending methods for fluctuation analysis. Physica A: Statistical Mechanics and its Applications, 387(21):5080–5090, 2008. doi: 10.1016/j.physa.2008.04.023.
- Chang et al. [2014] G. W. Chang, M.-F. Shih, Y.-Y. Chen, and Y.-J. Liang. A hybrid wavelet transform and neural-network-based approach for modelling dynamic voltage-current characteristics of electric arc furnace. IEEE Transactions on Power Delivery, 29(2):815–824, Apr. 2014. ISSN 0885-8977. doi: 10.1109/TPWRD.2013.2280397.
- Chen et al. [2002] Z. Chen, P Ch.. Ivanov, K. Hu, and H. E. Stanley. Effect of nonstationarities on detrended fluctuation analysis. Physical Review E, 65:041107, Apr. 2002. doi: 10.1103/PhysRevE.65.041107.
- Chen et al. [2005] Z. Chen, K. Hu, P. Carpena, P. B-G, H. E. Stanley, and P Ch.. Ivanov. Effect of nonlinear filters on detrended fluctuation analysis. Physical Review E, 71:011104, Jan. 2005. doi: 10.1103/PhysRevE.71.011104.
- Chianca et al. [2005] C. V. Chianca, A. Ticona, and T. J. P. Penna. Fourier-detrended fluctuation analysis. Physica A: Statistical Mechanics and its Applications, 357(3):447–454, 2005. doi: 10.1016/j.physa.2005.03.047.
- Chua et al. [1987] L. O. Chua, C. A. Desoer, and E. S. Kuh. Linear and Nonlinear Circuits. McGraw-Hill, New York, 1987.
- Crutchfield [2012] J. P. Crutchfield. Between order and chaos. Nature Physics, 8(1):17–24, 2012. doi: 10.1038/nphys2190.
- Drożdż and Oświȩcimka [2015] S. Drożdż and P. Oświȩcimka. Detecting and interpreting distortions in hierarchical organization of complex time series. Physical Review E, 91(3):030902, 2015. doi: 10.1103/PhysRevE.91.030902.
- Drożdż et al. [2009] S. Drożdż, J. Kwapień, P. Oświecimka, and R. Rak. Quantitative features of multifractal subtleties in time series. EPL (Europhysics Letters), 88(6):60003, 2009. doi: 10.1209/0295-5075/88/60003.
- Fetterhoff et al. [2015] D. Fetterhoff, I. Opris, S. L. Simpson, S. A. Deadwyler, R. E. Hampson, and R. A. Kraft. Multifractal analysis of information processing in hippocampal neural ensembles during working memory under tetrahydrocannabinol administration. Journal of Neuroscience Methods, 244:136–153, 2015. ISSN 0165-0270. doi: 10.1016/j.jneumeth.2014.07.013.
- Friedrich et al. [2011] R. Friedrich, J. Peinke, M. Sahimi, and M. R. R. Tabar. Approaching complexity by stochastic methods: From biological systems to turbulence. Physics Reports, 506(5):87–162, 2011. doi: 10.1016/j.physrep.2011.05.003.
- Gerasimova et al. [2013] E. Gerasimova, B. Audit, S. G. Roux, A. Khalil, F. Argoul, O. Naimark, and A. Arneodo. Multifractal analysis of dynamic infrared imaging of breast cancer. EPL (Europhysics Letters), 104(6):68001, 2013. doi: 10.1209/0295-5075/104/68001.
- Harte [2010] D. Harte. Multifractals: Theory and Applications. CRC Press, Boca Raton, Florida, 2010.
- Hu et al. [2009] J. Hu, J. Gao, and X. Wang. Multifractal analysis of sunspot time series: the effects of the 11-year cycle and Fourier truncation. Journal of Statistical Mechanics: Theory and Experiment, 2009(02):P02066, 2009. doi: 10.1088/1742-5468/2009/02/P02066.
- Hu et al. [2001] K. Hu, P Ch.. Ivanov, Z. Chen, P. Carpena, and H. E. Stanley. Effect of trends on detrended fluctuation analysis. Physical Review E, 64:011114, Jun. 2001. doi: 10.1103/PhysRevE.64.011114.
- Ihlen [2012] E. A. F. Ihlen. Introduction to multifractal detrended fluctuation analysis in Matlab. Frontiers in Physiology, 3, 2012. doi: 10.3389/fphys.2012.00141.
- Janabi-Sharifi and Jorjani [2009] F. Janabi-Sharifi and G. Jorjani. An adaptive system for modelling and simulation of electrical arc furnaces. Control Engineering Practice, 17(10):1202–1219, 2009. doi: 10.1016/j.conengprac.2009.05.006.
- Kantelhardt [2011] J. W. Kantelhardt. Fractal and multifractal time series. In R. A. Meyers, editor, Mathematics of Complexity and Dynamical Systems, pages 463–487. Springer New York, 2011. ISBN 978-1-4614-1805-4. doi: 10.1007/978-1-4614-1806-1˙30.
- Kantelhardt et al. [2002] J. W. Kantelhardt, S. A. Zschiegner, E. Koscielny-Bunde, S. Havlin, A. Bunde, and H. E. Stanley. Multifractal detrended fluctuation analysis of nonstationary time series. Physica A: Statistical Mechanics and its Applications, 316(1):87–114, 2002. doi: 10.1016/S0378-4371(02)01383-3.
- Kwapień and Drożdż [2012] J. Kwapień and S. Drożdż. Physical approach to complex systems. Physics Reports, 515(3):115–226, 2012. doi: 10.1016/j.physrep.2012.01.007.
- Ludescher et al. [2011] J. Ludescher, M. I. Bogachev, J. W. Kantelhardt, A. Y. Schumann, and A. Bunde. On spurious and corrupted multifractality: the effects of additive noise, short-term memory and periodic trends. Physica A: Statistical Mechanics and its Applications, 390(13):2480–2490, 2011. doi: 10.1016/j.physa.2011.03.008.
- Maiorino et al. [2015] E. Maiorino, L. Livi, A. Giuliani, A. Sadeghian, and A. Rizzi. Multifractal characterization of protein contact networks. Physica A: Statistical Mechanics and its Applications, 428:302–313, 2015. ISSN 0378-4371. doi: 10.1016/j.physa.2015.02.026.
- Mali et al. [2015] P. Mali, S. Sarkar, S. Ghosh, A. Mukhopadhyay, and G. Singh. Multifractal detrended fluctuation analysis of particle density fluctuations in high-energy nuclear collisions. Physica A: Statistical Mechanics and its Applications, 424:25–33, 2015. doi: 10.1016/j.physa.2014.12.037.
- Medina et al. [2005] A. Medina, M. A. Gomez-Martinez, and C. R. Fuerte-Esquivel. Application of bifurcations theory to assess nonlinear oscillations produced by AC electric arc furnaces. IEEE Transactions on Power Delivery, 20(2):801–806, Apr. 2005. ISSN 0885-8977. doi: 10.1109/TPWRD.2005.844289.
- Meng et al. [2012] H. Meng, F. Ren, G.-F. Gu, X. Xiong, Y.-J. Zhang, W.-X. Zhou, and W. Zhang. Effects of long memory in the order submission process on the properties of recurrence intervals of large price fluctuations. EPL (Europhysics Letters), 98(3):38003, 2012. doi: 10.1209/0295-5075/98/38003.
- Movahed and Hermanis [2008] M. S. Movahed and E. Hermanis. Fractal analysis of river flow fluctuations. Physica A: Statistical Mechanics and its Applications, 387(4):915–932, 2008. doi: 10.1016/j.physa.2007.10.007.
- Nagarajan and Kavasseri [2005] R. Nagarajan and R. G. Kavasseri. Minimizing the effect of sinusoidal trends in detrended fluctuation analysis. International Journal of Bifurcation and Chaos, 15(5):1767–1773, 2005. doi: 10.1142/S021812740501279X.
- Oświȩcimka et al. [2006] P. Oświȩcimka, J. Kwapień, and S. Drożdż. Wavelet versus detrended fluctuation analysis of multifractal structures. Physical Review E, 74:016103, Jul 2006. doi: 10.1103/PhysRevE.74.016103.
- Sadeghian and Lavers [1999a] A. Sadeghian and J. D. Lavers. Application of radial basis function networks to model electric arc furnaces. In Proceedings of the IEEE International Joint Conference on Neural Networks, volume 6, pages 3996–4001, Washington, DC, Jul. 1999a. IEEE.
- Sadeghian and Lavers [1999b] A. Sadeghian and J. D. Lavers. Nonlinear black-box modeling of electric arc furnace: an application of fuzzy logic systems. In Proceedings of the IEEE International Fuzzy Systems Conference Proceedings, volume 1, pages 234–239, Seoul, South Korea, Aug. 1999b. IEEE.
- Sadeghian and Lavers [2011] A. Sadeghian and J. D. Lavers. Dynamic reconstruction of nonlinear v–i characteristic in electric arc furnaces using adaptive neuro-fuzzy rule-based networks. Applied Soft Computing, 11(1):1448–1456, 2011. doi: 10.1016/j.asoc.2010.04.016.
- Samet and Golshan [2012] H. Samet and M. E. H. Golshan. A wide nonlinear analysis of reactive power time series related to electric arc furnaces. International Journal of Electrical Power & Energy Systems, 36(1):127–134, 2012. doi: 10.1016/j.ijepes.2011.10.033.
- Samet et al. [2014a] H. Samet, E. Farjah, and Z. Sharifi. A dynamic, nonlinear and time-varying model for electric arc furnace. International Transactions on Electrical Energy Systems, 2014a. ISSN 2050-7038. doi: 10.1002/etep.1955.
- Samet et al. [2014b] H. Samet, T. Ghanbari, and J. Ghaisari. Maximizing the transferred power to electric arc furnace for having maximum production. Energy, 72:752–759, 2014b. doi: 10.1016/j.energy.2014.05.105.
- Serinaldi [2010] F. Serinaldi. Use and misuse of some Hurst parameter estimators applied to stationary and non-stationary financial time series. Physica A: Statistical Mechanics and its Applications, 389(14):2770–2781, 2010. doi: 10.1016/j.physa.2010.02.044.
- Shao et al. [2012] Y.-H. Shao, G.-F. Gu, Z.-Q. Jiang, W.-X. Zhou, and D. Sornette. Comparing the performance of FA, DFA and DMA using different synthetic long-range correlated time series. Scientific Reports, 2, 2012. doi: 10.1038/srep00835.
- Stanley [1999] H. E. Stanley. Scaling, universality, and renormalization: Three pillars of modern critical phenomena. Reviews of Modern Physics, 71(2):S358, 1999. doi: 10.1103/RevModPhys.71.S358.
- Telesca et al. [2015] L. Telesca, M. Lovallo, S. Mammadov, F. Kadirov, and G. Babayev. Power spectrum analysis and multifractal detrended fluctuation analysis of earth’s gravity time series. Physica A: Statistical Mechanics and its Applications, 428:426–434, 2015. ISSN 0378-4371. doi: 10.1016/j.physa.2015.02.034.
- Wu et al. [2015] N. Wu, Q.-X. Li, and P. Zou. Multifractal properties of solar filaments and sunspots numbers. New Astronomy, 38:1–10, 2015. ISSN 1384-1076. doi: 10.1016/j.newast.2014.12.008.
- Zhao et al. [2011] X. Zhao, P. Shang, A. Lin, and G. Chen. Multifractal fourier detrended cross-correlation analysis of traffic signals. Physica A: Statistical Mechanics and its Applications, 390(21):3670–3678, 2011. doi: 10.1016/j.physa.2011.06.018.
- Zhou [2009] W.-X. Zhou. The components of empirical multifractality in financial returns. EPL (Europhysics Letters), 88(2):28004, 2009. doi: 10.1209/0295-5075/88/28004.
- Zhou et al. [2014] Y.-W. Zhou, J.-L. Liu, Z.-G. Yu, Z.-Q. Zhao, and V. Anh. Fractal and complex network analyses of protein molecular dynamics. Physica A: Statistical Mechanics and its Applications, 416(0):21–32, 2014. ISSN 0378-4371. doi: 10.1016/j.physa.2014.08.047.