Uranus at Equinox: cloud morphology and dynamics††footnotemark: †
Abstract
As the 7 December 2007 equinox of Uranus approached, collaboration between ring and atmosphere observers in the summer and fall of 2007 produced a substantial collection of groundbased observations using the 10-m Keck telescope with adaptive optics and space-based observations with the Hubble Space Telescope. Both near-infrared and visible-wavelength imaging and spatially resolved near-infrared spectroscopic observations were obtained. We used observations spanning the period from 7 June 2007 through 9 September 2007 to identify and track cloud features, determine atmospheric motions, characterize cloud morphology and dynamics, and define changes in atmospheric band structure. Atmospheric motions were obtained over a wider range of latitudes than previously was possible, extending to 73∘ N, and for 28 cloud features we obtained extremely high wind-speed accuracy through extended tracking times. We confirmed the existence of the suspected northern hemisphere prograde jet, locating its peak near 58∘ N. The new results confirm a small N-S asymmetry in the zonal wind profile, and the lack of any change in the southern hemisphere between 1986 (near solstice) and 2007 (near equinox) suggests that the asymmetry may be permanent rather than seasonally reversing. In the 2007 images we found two prominent groups of discrete cloud features with very long lifetimes. The one near 30∘ S has departed from its previous oscillatory motion and started a significant northward drift, accompanied by substantial morphological changes. The complex of features near 30∘ N remained at a nearly fixed latitude, while exhibiting some characteristics of a dark spot accompanied by bright companion features. Smaller and less stable features were used to track cloud motions at other latitudes, some of which lasted over many planet rotations, though many could not be tracked beyond a single transit. A bright band has developed near 45∘ N, while the bright band near 45∘ S has begun to decline, both events in agreement with the idea that the asymmetric band structure of Uranus is a delayed response to solar forcing, but with a surprisingly short delay of only a few years.
Subject headings:
Uranus, Uranus Atmosphere; Atmospheres, dynamics1. Introduction
Uranus reached equinox on 7 December 2007, for the first time in 42 years, and for the first time ever when modern high resolution instruments were capable of detailed characterization of the event. Uranus’ appearance in HST and Keck imagery at near-IR wavelengths revealed a richer treasure-trove of atmospheric information than the bland close-up Voyager imaging in 1986. Recent pre-equinox observations recorded a surprising level of activity, unusual cloud dynamics, and a hemispherical asymmetry in cloud bands, discrete cloud structure, and atmospheric motions. A wide range of discrete cloud lifetimes was discovered, ranging from less than an hour to possibly decades, and a north-south asymmetry in the zonal wind was characterized (Sromovsky and Fry 2005). A recent dramatic event was the rise and fall of Uranus’ brightest cloud feature, which peaked in 2005, and faded dramatically thereafter (Sromovsky et al. 2007). A large and very long lived storm system (S34) was discovered (Sromovsky and Fry 2005). Some evidence suggests that it existed as early as the 1986 Voyager encounter, but there is little doubt that it existed from at least 2000 through at least 2005, during which time it slowly oscillated in latitude between 32∘ S and 36∘ S and exhibited a superimposed inertial oscillation with a period near 0.7 days. In 2004 it suddenly became visible in K′ images (Hammel et al. 2005b), indicating an increased cloud altitude. Cycle 15 HST observations in 2006 captured the first dark spot in Uranus’ northern hemisphere (Hammel et al. 2009). This roughly elliptical spot is similar to several dark spots observed on Neptune, even exhibiting what appears to be a bright companion cloud in a pre-discovery image.
New ground-based images we obtained from the Keck telescope in 2007 (beginning on 7 June and extending through 9 September) provide a new abundance of discrete cloud features that we use to gain a better understanding of Uranus’ atmospheric dynamics. We also obtained imagery from the Hubble Space Telescope Wide Field Planetary Camera 2 in July and August of 2007. Here we discuss cloud morphologies, motions, and evolution, and include in the analysis results from Voyager and prior HST observations. We extend the zonal wind observations up to 73∘ N, and further establish the north-south asymmetry of Uranus’ zonal circulation. We were able to determine highly accurate drift rates for 28 cloud features by tracking them over long time periods, and find little change in the measured circulation between 1986 and 2007.
2. Observations
Our primary data are Keck and HST observations obtained during 2007. We also made use of a limited number of HST archival images from 2004-2006.
2.1. Recent Keck and HST Observations
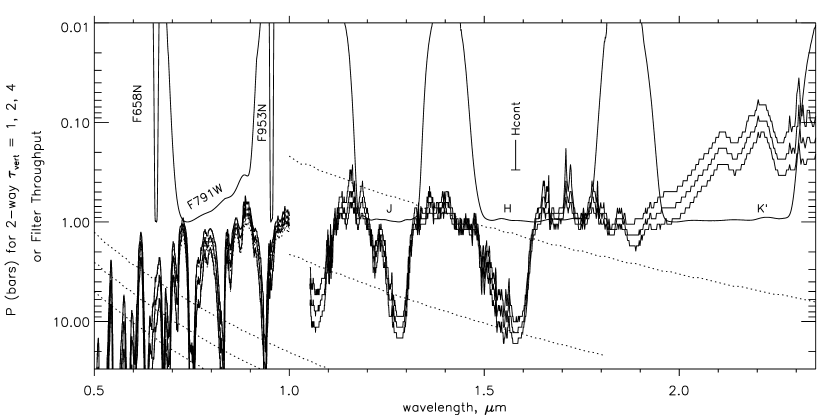
Using the NIRC2 camera on the Keck II telescope, suitable atmospheric observations of Uranus were obtained on dates given in Table 1, where we also list basic observing conditions and PIs for each observing run. The ring-plane crossing was on 16 August, when bad weather severely limited observations from the Keck telescope. Most of our images were made with broadband J, H, and K′ filters using the NIRC2 Narrow Camera. A few were made with narrow-band filters for better discrimination of vertical structure. After geometric correction, the angular scale of the NIRC2 narrow-angle camera is 0.009942′′/pixel (NIRC2 General Specifications web page: http://alamoana.keck.hawaii.edu/inst/nirc2/ genspecs.html). This provides 350 (June) to 369 (September) pixels across the planet. Typical resolution in the Keck II AO images of Uranus was 0.06′′, providing 58-61 resolution elements across the disk. The penetration depth of these observations into the atmosphere of Uranus is indicated in Fig. 1. Only particles extending to pressures less than 1 bar can be seen in K′ images of Uranus, while J and H images can see to the 10-bar level in a clear atmosphere. The main variations visible in J and H bands appear to occur in the 2-5 bar region (Sromovsky and Fry 2007, 2008), well below the expected methane condensation level near 1.2 bars.
| Date | Temporal | Sub Obs. | Sub Solar | Uranus | Phase | |
|---|---|---|---|---|---|---|
| (mm/dd/yyyy) | Coverage (h, UT) | Lat.(,∘) | Lat. (, ∘) | Diam. (as) | Angle (∘) | PI |
| 06/07/2007 | 14:19-15:23 | 0.97 | -2.03 | 3.504 | 2.893 | van Dam |
| 07/26/2007 | 10:44-15:11 | 0.66 | -1.49 | 3.639 | 2.076 | de Pater |
| 07/27/2007 | 10:37-15:34 | 0.64 | -1.48 | 3.641 | 2.041 | Hammel |
| 07/28/2007 | 12:07-15:12 | 0.61 | -1.47 | 3.643 | 2.005 | Hammel |
| 07/30/2007 | 11:24-15:28 | 0.56 | -1.45 | 3.648 | 1.932 | Sromovsky |
| 07/31/2007 | 10:34-15:22 | 0.53 | -1.43 | 3.650 | 1.894 | Sromovsky |
| 08/08/2007 | 11:15-15:06 | 0.29 | -1.35 | 3.665 | 1.574 | de Pater |
| 08/09/2007 | 10:53-15:20 | 0.25 | -1.33 | 3.666 | 1.531 | de Pater |
| 08/19/2007 | 10:30-14:51 | -0.10 | -1.22 | 3.680 | 1.083 | Sromovsky |
| 08/20/2007 | 10:27-14:49 | -0.14 | -1.21 | 3.682 | 1.036 | Sromovsky |
| 09/07/2007 | 10:47-13:26 | -0.86 | -1.01 | 3.693 | 0.153 | Hammel |
| 09/09/2007 | 8:13-13:21 | -0.94 | -0.99 | 3.693 | 0.061 | Showalter |
| Date | Temporal | Sub Obs. | Sub Solar | Uranus | Phase | |
|---|---|---|---|---|---|---|
| (mm/dd/yyy) | Coverage (h UT) | Lat. (, ∘) | Lat. (, ∘) | Diam. (as) | Angle (∘) | PI |
| 07/28/2007 | 2:48-11:25 | 0.61 | -1.47 | 3.643 | 2.005 | Sromovsky |
| 07/29/2007 | 2:47-11:23 | 0.59 | -1.46 | 3.645 | 1.969 | Sromovsky |
| 08/17/2007 | 7:14-7:29 | -0.03 | -1.25 | 3.678 | 1.176 | Rages |
| 08/19/2007 | 23:16-23:31 | -0.10 | -1.22 | 3.680 | 1.083 | Rages |
| 08/27/2007 | 6:59-8:53 | -0.41 | -1.13 | 3.688 | 0.699 | Rages |
| Instrument | Filter | Central , m | Bandpassa, m |
|---|---|---|---|
| NIRC2b | J | 1.248 | 0.163 |
| NIRC2b | H | 1.633 | 0.296 |
| NIRC2b | K′ | 2.124 | 0.351 |
| NIRC2b | Hcont | 1.5804 | 0.0232 |
| WFPC2c | 791W | 0.790 | 0.130 |
| WFPC2c | F953N | 0.954 | 0.005 |
| ACSd | F658N | 0.658 | 0.008 |
aeffective bandpass for WFPC2, otherwise full
width at half maximum.
bwww.alamoana.keck/hawaii.edu/inst/nirc2/filters.html.
cWFPC2 Instrument Handbook v 9.0, Oct. 2004.
dACS Instrument Handbook v 5.0, Oct. 2004.
2.2. Image Processing and Navigation
HST image processing and navigation proceeded along the lines described by Sromovsky and Fry (2007). Our Keck image processing also followed Sromovsky and Fry (2007) except that we used an updated geometric distortion correction code provided by Brian Cameron of the California Institute of Technology (see www2.keck.hawaii.edu/inst/nirc2/forReDoc/post_ observing/dewarp/). We made use of the SPICELIB toolkit (Acton 1996) to generate ephemeris information concerning the orientation of the planet’s pole vector, the range to the planet, and the sub latitude and sub longitude of the observer (the point at which a vector from the planet center to the observer intersects the surface). We used standard 1-bar radii of = 25,559 km and = 24,973 km and a longitude system based on a 17.24-h period (Seidelmann et al. 2002). We determined planet center coordinates by fitting a projected planet limb to maximum gradient limb points. The combined effect of navigation errors and other cloud tracking errors is approximately 0.6 narrow angle camera pixels RMS, which is estimated from the image-to-image scatter found in the plots of discrete cloud position versus time. In describing positions we use both planetocentric latitude (), which is the angle above the equatorial plane measured from the planet center, and planetographic latitude (), which is the angle between the local normal and the equatorial plane.
3. Atmospheric Circulation Results
3.1. Overview of cloud features in 2007 Keck II images
A sampling of the discrete cloud features we used to track atmospheric motions is provided for all but the June 7 observing run in Figs. 2- 6, where K′ and H images are shown along with a high-pass filtered H image. (June 7 did not add any features not seen on other dates.) All the encircled cloud targets were observed on multiple images and were used to determine drift rates and wind speeds. Target labels have the form mddnn, where m and dd denote the month and day when a given target was prominent and clearly identified, and nn is the sequence number for the date. Earlier and/or later observations of the same feature were often identified and linked together for estimating wind speeds, in which case all such targets were given the same label, eliminating some of the original labels given before the linkage was established. Only the higher altitude cloud features ( bar) are visible in the K′ images, and almost all of those are seen in the northern hemisphere. The reason target circles in K′ images are sometimes displaced from target locations is that in these images the positions are based on predictions of a constant drift model, while many of the clouds actually move at a variable drift rate.
Many of the cloud targets were quite subtle, and were most easily discerned in high-pass filtered images, shown in the bottom rows of the aforementioned figures. The key methods of distinguishing subtle cloud features from noise are the time dependence of position and morphology. A trackable cloud must not change shape significantly over the tracked interval and must have a consistent drift rate over the tracked interval. The uncertainties in tracking are revealed by comparison of measured positions relative to our best-fit constant drift track, which is only meaningful with 3 or more time samples. As discussed later, all but one target are sampled 4 or more times, and many far more than that. Uncircled bright features south of the equator in Figs. 3 and 5 are satellites.
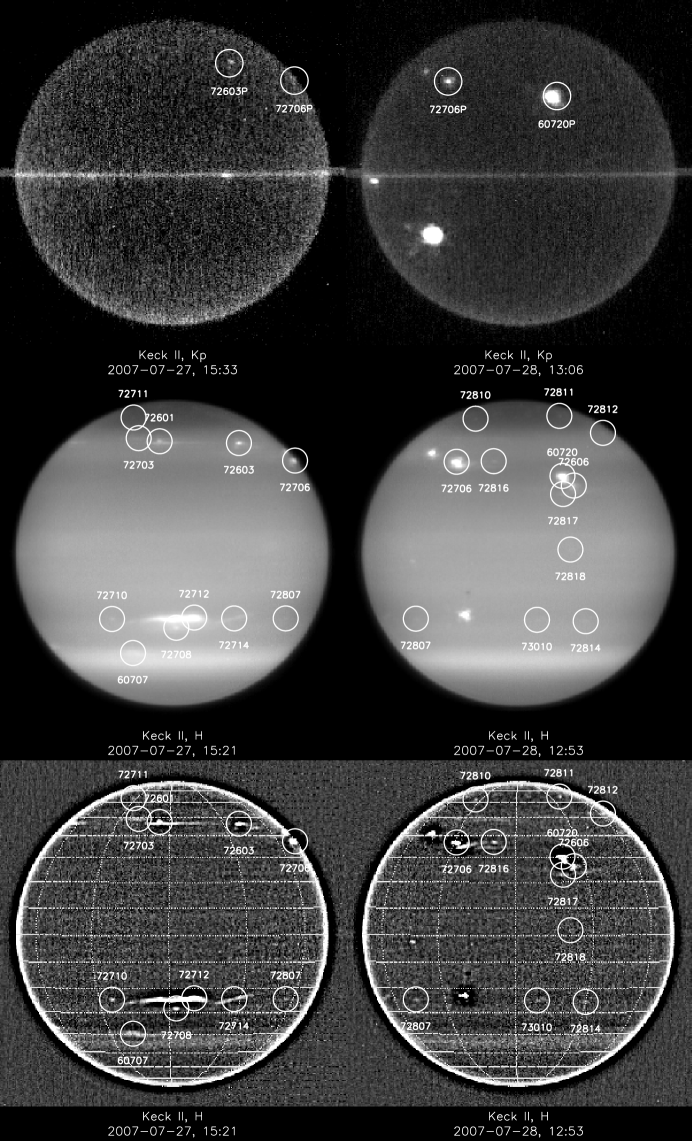
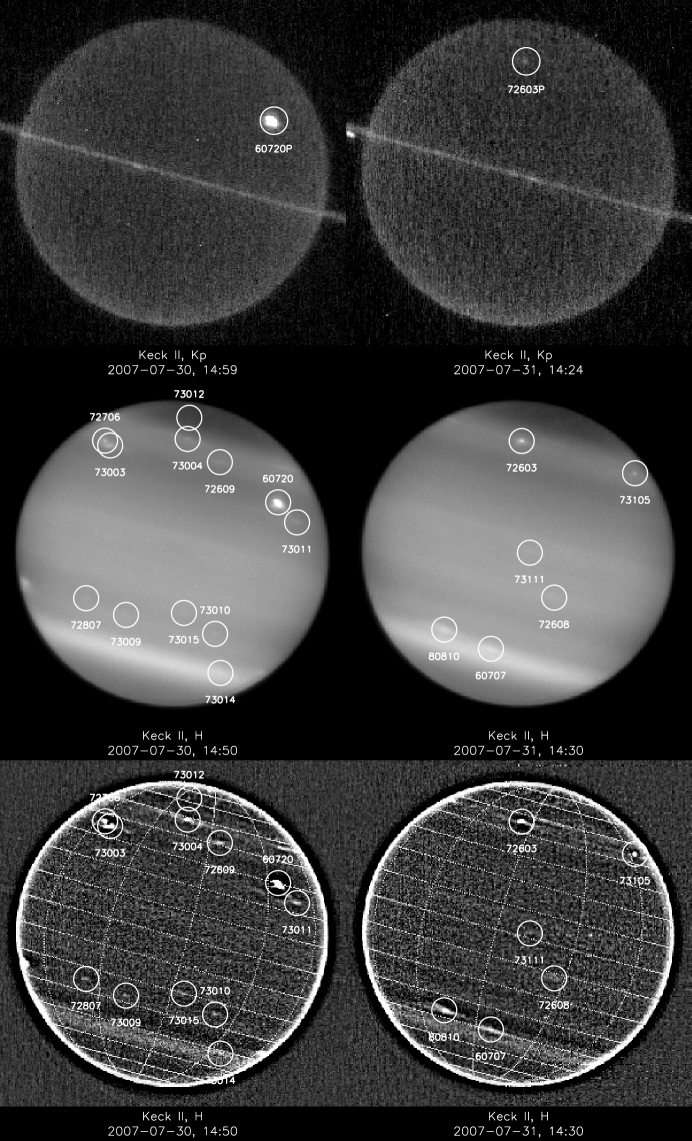
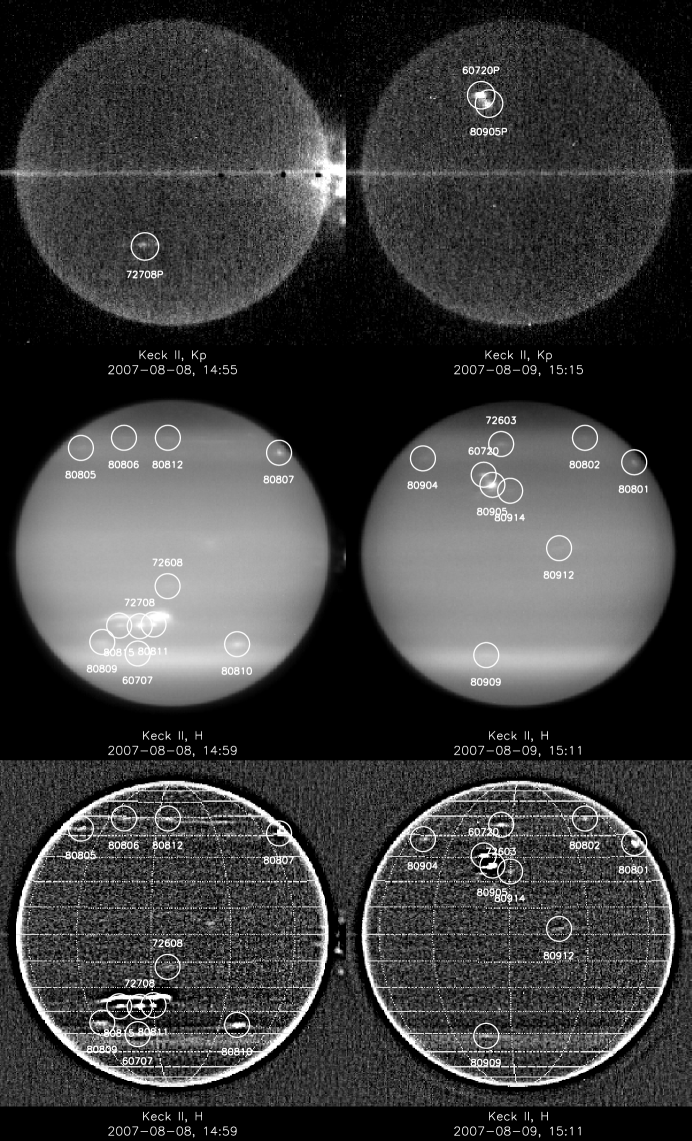
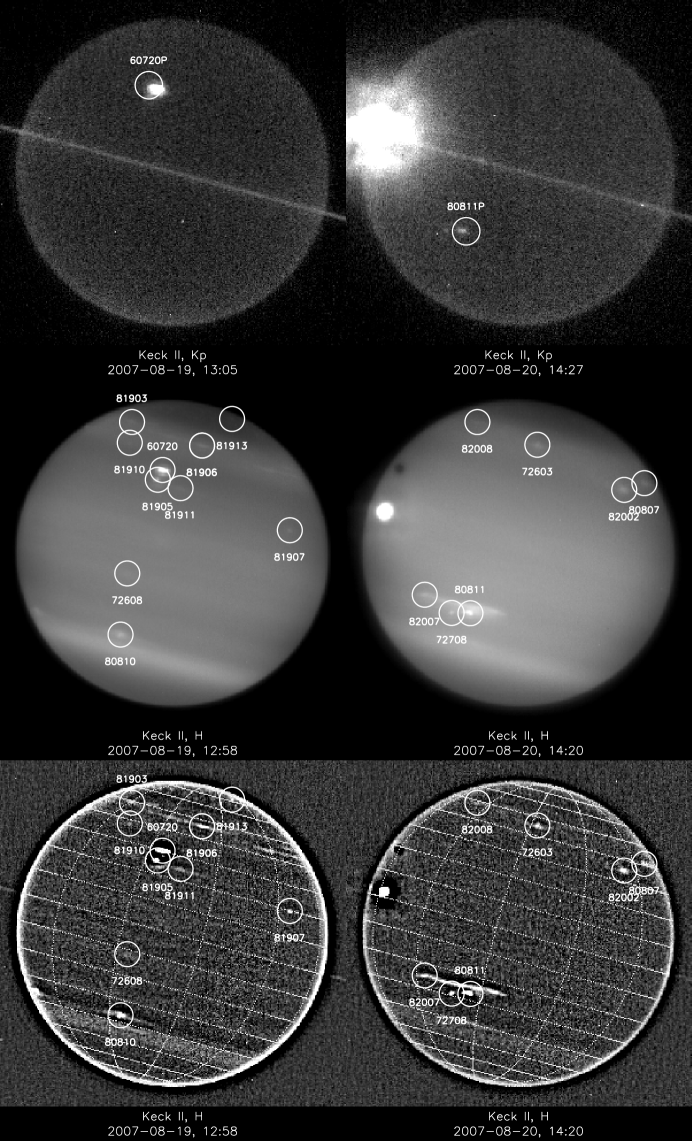
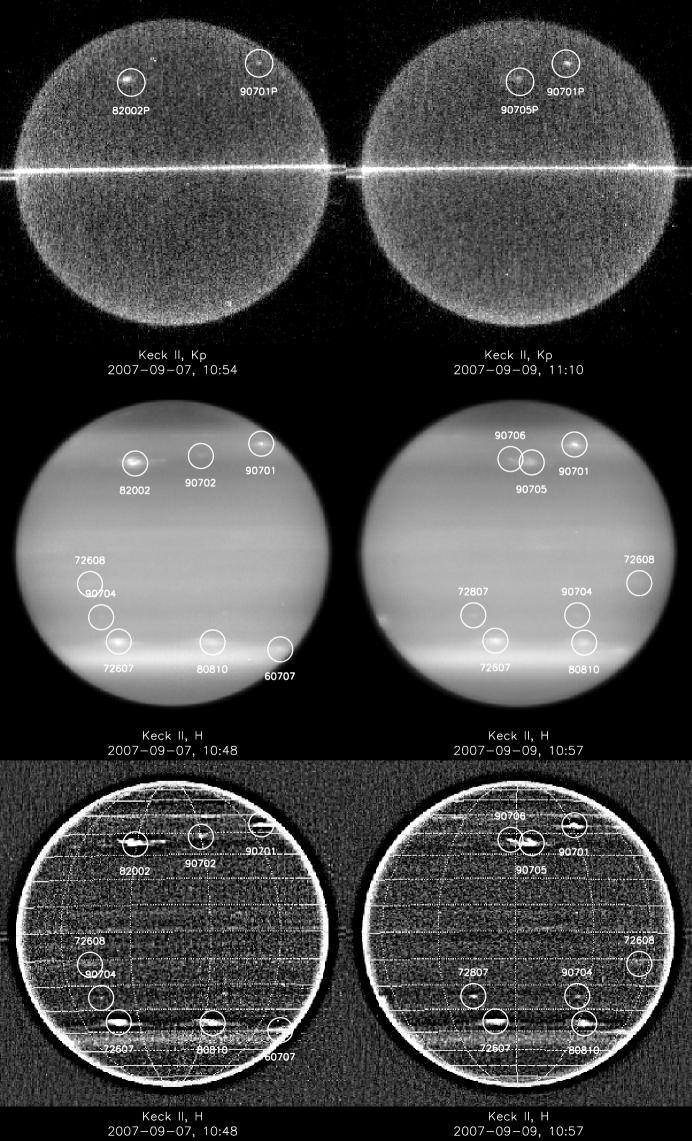
Keck II imaging observations in the H filter provided the best combination of contrast and resolution, and thus provided most of the input to the cloud tracking effort. Most of our Keck runs provided observations on two successive nights, between which Uranus undergoes 1.39 rotations. As a result, there were only a few cloud targets seen on both nights of each observing run. These provided the highest initial wind speed accuracy, of the order of 1.3 to 3 m/s. Most targets were followed during only a single transit on one night. The best accuracy for these is about 10 m/s, for a target tracked over about 4 hours. Typical errors are twice this large because most clouds are tracked for much less than four hours. The longest tracking time within a single transit was 4.17 hours. The estimated uncertainties in the zonal winds are of the same order as uncertainties in the meridional winds, although meridional wind speeds are much smaller. Because we could not resolve any systematic meridional motion for features observed on only one transit, meridional wind speeds are not tabulated. However, rather substantial meridional excursions of 2.1∘ of latitude were observed in prior years for a long-lived feature near 34∘S. Empirical fits to a simple inertial oscillation model imply that this feature regularly reaches peak meridional speeds of 28 m/s (Sromovsky and Fry 2005), but the speed varies so rapidly that it is difficult to resolve by direct measurement.
In many cases we were able to find cloud features that lasted long enough to track over very extended time periods, the longest of which was 2255 hours (94 days). We tracked 15 targets for more than 100 hours, seven of which were tracked for more than 1000 hours. Many of these moved at extremely uniform drift rates, with an average speed defined to within a few cm/sec, and average drift rates to within 10-4∘/h.
3.2. Cloud motion fits and uncertainties
Our wind results are obtained by fitting individual longitude observations to a constant drift model. Two fits are computed: one weighting individual observations by the inverse of their expected variances, and the second is an unweighted fit. In the latter case the standard deviation of the points from the fit provides the basis for the error estimate and accounts for uncertainties in identification due to inherently poor morphology (long streaky features) or variations in contrast or in feature evolution. The weighted error estimates are computed in the pixel domain, with individual position errors taken to be 0.6 pixel RMS, an estimate that roughly accounts for the observed variability in measurements over a large sample, and thus incorporates both typical tracking and image navigation errors. Our final wind result is the average of the two fits, and assigned the larger of the two errors. Individual measurement uncertainties are typically 0.3∘ of latitude and longitude near the central disk and increase towards the limbs.
Over a single transit, fitting errors are generally smaller than our a priori estimates () and over longer periods the errors are close to our a priori values for latitude, but about twice as large for longitudinal measurements. The increased errors in longitude are partly due to the longitudinally stretched character of many features, making them difficult to locate in that dimension, and also because systematic deviations in drift rate can accumulate much larger longitudinal deviations than the corresponding systematic variations in latitude. Thus, part of what seems like longitudinal measurement error is really just systematic deviation from our simple constant drift model. Some cloud feature motions exhibit short period and long period oscillations, leading to systematic deviations in both longitude and latitude from constant longitudinal drift at a fixed latitude. Only a few cloud targets are sampled well enough to characterize these systematic variations.
The uncertainties quoted for both mean positions and mean drift rates are formal uncertainties based on an assumed random distribution of errors, with no accounting for possible systematic deviations from the assumed constant drift models. For large numbers of measurements over long time intervals, these formal uncertainties can become quite small and do not necessarily (more often do not) accurately reflect the steadiness of the motion or position of the tracked feature, nor our ability to predict where it will be in the future. Besides unsteady motions, there are two other effects that might produce significant systematic errors in latitude: pixel scale errors and center-finding errors associated with north-south asymmetries in limb profiles, either because of physical differences in the atmosphere or differences in illumination at non-zero phase angles. By measuring satellite positions we were able to verify the published NIRC2 pixel scale to better than 0.4%. An error of this size would not affect our center finding accuracy, but would cause a latitude error that increased towards the north and south limbs, reaching values of 0.13∘, 0.38∘, and 0.61∘at latitudes of 30∘, 60∘, and 70∘respectively. To assess the limb-asymmetry impact, the limbs of images at 1.0∘ and 2.9∘ phase angles were fit to model ellipses first using all available points, then fitting only the left or right (south or north) limb. The largest difference between fitting both limbs together, which is our standard method, and fitting just one limb was only 0.34 pixels, which is a reasonable bound on the systematic center-finding error in the latitude direction. At latitudes of 0∘, 30∘, 60∘, and 70∘, the corresponding errors in latitude would be 0.11∘, 0.13∘, 0.22∘ , and 0.32∘ respectively.
3.3. Cloud-tracked wind results
We follow Allison et al. (1991), Hammel et al. (2001, 2005a), and Sromovsky and Fry (2005) in using prograde (IAU westward) winds as positive winds on Uranus. On most planets, eastward winds would be prograde. Uranus is unusual because the rotational pole of Uranus (as defined by the right hand rule) is 98∘ from its orbital pole. Because this puts the rotational pole south of the invariable plane of the solar system, IAU convention makes this the south pole of the planet (Seidelmann et al. 2002).
3.3.1 Tracking discrete features
From observations during a single transit we obtained 51 cloud-tracked winds with wind speed uncertainties less than 40 m/s, the majority of which being less than 20 m/s. A table of these results can be obtained as on-line supplementary material at www.ssec.wisc.edu/planetary/uranus/onlinedata/ ura2009eqdyn/. In Table 4, we summarize the high-accuracy results of tracking features over more than a single transit. Remarkably, we were able to find 28 such features, thanks to the relatively close spacing of observations during the period approaching equinox. We found these long-lived targets by linking together observations over shorter time intervals, using preliminary fits from short time intervals to identify possible cases in which two targets were actually the same cloud feature. After linking two such measurement groups together, the longer time base provided much more accurate predictions that facilitated linkages over longer time intervals. Besides the consistency of longitudinal tracks, latitude and morphology were also used as a basis for identification of features. In some cases two features appeared close to the predicted latitude and longitude of another feature, in which case we did not attempt a linkage.
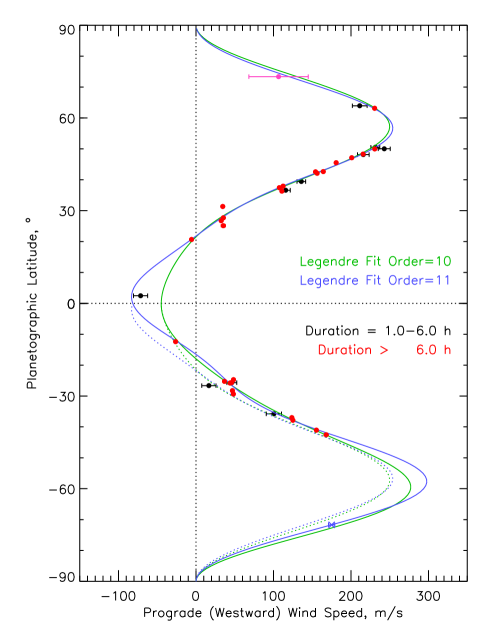
All the wind determinations yielding zonal speed uncertainties 40 m/s are plotted versus latitude in Fig. 7. Six of these, measured over time spans less than 1 hour, are shown as light blue. The 4 deviant measurement of this subset, near 20∘ N and 150 m/s was tracked over an interval of less than 1 hour, with all but one of 14 measurements within 24 minutes. It is just south of what appears to be a dark vortex and is probably a companion to that feature. Evolution of companions is common and likely contributed to tracking errors that resulted in this substantial deviation. The more reliable wind values from single transit tracking in the 1-6 hour range are shown in black. The highly accurate long duration tracking results are shown in red. Although error bars are plotted for all results, the long-duration error bars are generally too small to notice.
| Eastward | zonal wind | ID | track | |||
|---|---|---|---|---|---|---|
| Lat. () | Lat. () | drift rate (∘/h) | (m/s west) | (mddnn) | Nobs | time (h) |
| 62.03 | 63.120.10 | -4.03830.0041 | 230.450.25 | 72810 | 18 | 74.74 |
| 48.66 | 49.970.13 | -2.84920.0144 | 230.561.76 | 80802 | 5 | 27.95 |
| 46.99 | 48.310.06 | -2.58440.0020 | 215.640.17 | 72601 | 22 | 123.34 |
| 45.78 | 47.110.04 | -2.35310.0002 | 200.900.07 | 72603 | 47 | 1082.70 |
| 44.17 | 45.500.08 | -2.05630.0042 | 180.830.37 | 90701 | 13 | 50.56 |
| 41.31 | 42.640.06 | -1.78260.0007 | 164.200.17 | 72609 | 18 | 334.94 |
| 41.22 | 42.540.08 | -1.66210.0049 | 154.191.50 | 72803 | 10 | 68.23 |
| 40.76 | 42.080.07 | -1.68240.0010 | 156.270.09 | 80807 | 13 | 287.62 |
| 36.64 | 37.920.05 | -1.14410.0033 | 112.400.34 | 72706 | 20 | 72.12 |
| 36.14 | 37.420.10 | -1.08880.0211 | 107.522.09 | 80801 | 5 | 27.95 |
| 35.05 | 36.310.07 | -1.10050.0005 | 110.770.05 | 82002 | 10 | 456.25 |
| 30.17 | 31.340.03 | -0.32400.0001 | 34.500.04 | 60720 | 63 | 1751.44 |
| 26.60 | 27.680.05 | -0.32020.0004 | 35.300.10 | 72606 | 21 | 340.57 |
| 25.68 | 26.730.07 | -0.29260.0005 | 32.530.06 | 81905 | 8 | 458.81 |
| 24.10 | 25.110.07 | -0.30970.0100 | 35.252.69 | 73011 | 8 | 19.87 |
| 19.79 | 20.650.08 | 0.05040.0112 | -5.751.30 | 81907 | 6 | 21.64 |
| -11.86 | -12.400.03 | 0.21710.0001 | -26.310.02 | 72608 | 39 | 1082.66 |
| -23.72 | -24.710.06 | -0.42740.0003 | 48.380.27 | 72712 | 14 | 577.16 |
| -24.25 | -25.260.12 | -0.32620.0148 | 36.731.67 | 72714 | 3 | 19.62 |
| -24.61 | -25.630.04 | -0.40940.0001 | 45.950.03 | 72807 | 30 | 1080.41 |
| -24.73 | -25.750.09 | -0.40380.0044 | 45.250.59 | 90704 | 5 | 50.50 |
| -24.77 | -25.800.05 | -0.39230.0016 | 43.900.62 | 73010 | 17 | 100.83 |
| -27.17 | -28.270.05 | -0.42870.0003 | 46.990.08 | 80811 | 15 | 764.12 |
| -28.25 | -29.370.05 | -0.44420.0002 | 48.220.04 | 72708 | 23 | 577.20 |
| -35.73 | -37.000.04 | -1.23880.0001 | 123.630.02 | 72607 | 29 | 1078.67 |
| -36.56 | -37.840.03 | -1.26610.0001 | 124.970.05 | 80810 | 50 | 1055.93 |
| -39.74 | -41.050.03 | -1.64590.0001 | 155.320.05 | 60707 | 54 | 2254.79 |
| -41.22 | -42.540.09 | -1.82060.0188 | 167.982.62 | 73014 | 8 | 19.87 |
NOTE: Uncertainty estimates here exclude the systematic errors discussed in Sec. 3.2.
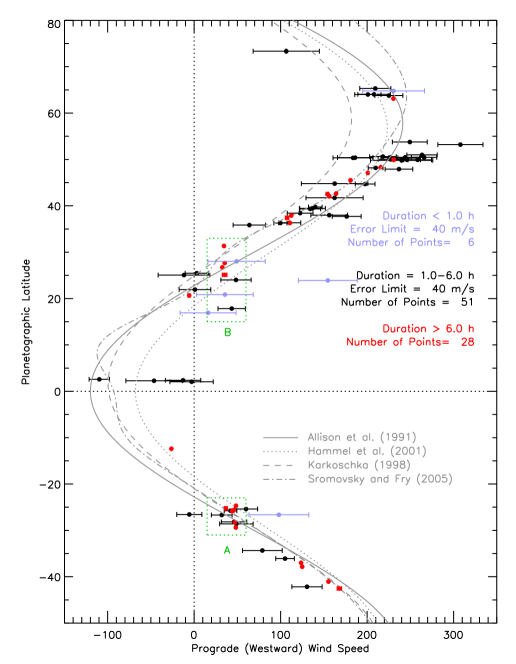
In Fig. 7, four model zonal wind profiles are provided for reference. The solid curve is a symmetric fit to the 1986 Voyager wind observations by Allison et al. (1991). This weights all Voyager observations equally, and thus probably gives too much weight to the highly uncertain near-equatorial determination based on radio occultation results of Lindal et al. (1987). The second symmetric curve (dotted) by Hammel et al. (2001) provides a better fit to the more accurate cloud-tracked winds obtained by Voyager imaging (Smith et al. 1986). Equations for these two fits are given by Hammel et al. (2001). The third curve (dashed) is an asymmetric fit by Karkoschka (1998a) based on HST observations that provided measurements in northern latitudes not visible to Voyager cameras. The fourth curve (dot-dash) is an asymmetric fit by Sromovsky and Fry (2005) to a combination of 2003-4 Keck observations and Voyager and Karkoschka HST results.
Our new observations extend to higher northern latitudes than prior observations (up to 73∘ N), which allows us for the first time to define the location of a northern hemisphere prograde jet peak at roughly 58∘ N, which is now much better defined than the southern jet and crudely symmetric to it. Our new results also provide a large number of highly accurate wind measurements, which indicate that the current wind profile is asymmetric, roughly following the Sromovsky and Fry (2005) profile, except at low latitudes and in two special regions outlined in green boxes. In both outlined regions the highly accurate determinations (red) indicate regions of nearly zero latitudinal gradients in wind speed. The most plausible explanation for this is that several of the tracked features are generated by a single circulation feature, much as the bright companion clouds generated by the Great Dark Spot on Neptune (Sromovsky et al. 2002). These bright companions (on Neptune) are thought to be orographic clouds produced by vertical motions as the zonal flow is deflected around the vortex that creates the dark spot (Stratman et al. 2001). Cloud groupings are further discussed in the following section.
3.3.2 Cloud complexes
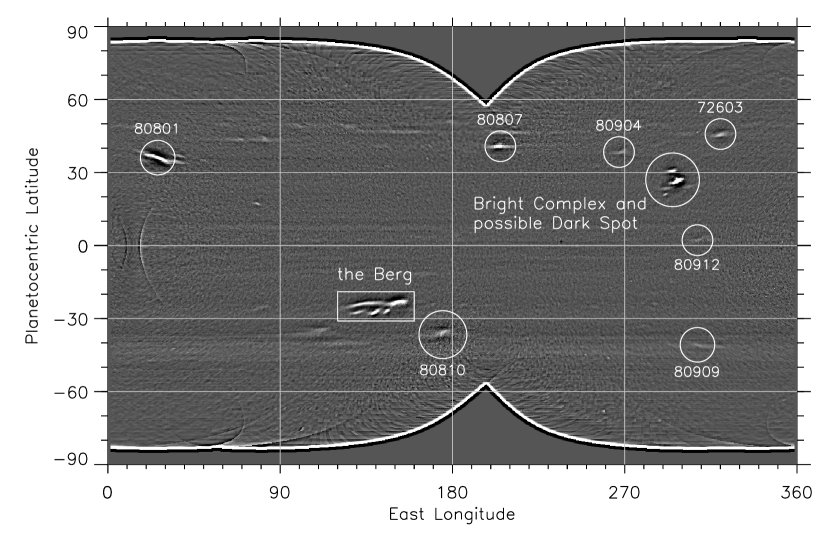
The groups of bright cloud features associated with the two outlined regions in Fig. 7 are put into context by the mosaicked rectilinear projection of images taken on 8-9 August 2007 (Fig. 8), in which it can be seen that nearly all of cloud features in the outlined latitude bands are also grouped together in close spatial proximity. These spatial groups are labeled Berg and Bright Complex for reasons discussed below. In the latitude regions occupied by the closely grouped features, there are very few accurate wind vectors that can be obtained at other longitudes that might be used to define the true latitudinal gradient of the zonal wind in these latitude bands.
In 2006, Hubble Space Telescope images revealed a small dark spot in the atmosphere of Uranus (Hammel et al. 2009), which was found to have associated bright companions. The dark feature was tracked in HST images and the companion groups visible at near-IR wavelengths were tracked in both HST and groundbased images. In fact, the feature generating cloud targets in region B (Fig. 7) is possibly the same feature identified as a dark spot at visible wavelengths in 2006, and may be the same feature that produced the brightest cloud feature ever observed on Uranus in 2005 (Sromovsky et al. 2007), termed the Bright Complex. It is also conceivably feature V reported by Hammel et al. (2005a) and also the unusually bright feature identified by Sromovsky et al. (2000). The latitude of the presumed vortex feature in the 2007 observations is likely close to the middle of the group of red points in region B. This is somewhat uncertain because the presumed vortex feature does not have well-defined boundaries and may undergo latitude excursions. Companions can appear in different locations relative to a vortex and also can vary with time. Thus the rough center of a group of companions is only an estimate of where the vortex might be located.
As can be surmised from Figs. 3-6, trackable discrete cloud features tend to cluster in narrow latitude bands, leaving several gaps of 10∘ at low latitudes, and larger gaps at high latitudes. In northern high latitude regions, which are just beginning to be seen, there appear to be small discrete cloud features that should provide very usable targets in coming years as the observer subpoint moves further northward. On the other hand, from 44∘ S (planetocentric) to the south pole, we have not seen a discrete cloud feature since 1986. The only discrete feature ever tracked in this region was at 71.7∘ S moving at 1754 m/s and seen only in Voyager 2 UV images (Smith 1986).
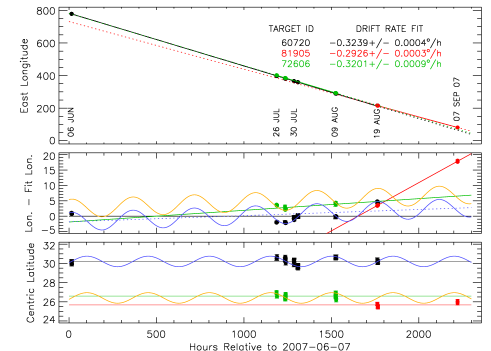
The wind results in region A of Fig. 7 are derived from clouds that are all associated with a major circulation feature that may have been present since 1986. The 2007 group of targets includes 60720, 72603, 72606, 72817, and 73011, which are identified in Figs. 2, 3, and 4. The long-term behavior of this cloud complex was first described by Sromovsky and Fry (2005), who referred to it as S34 because it had for many years been oscillating between planetocentric latitudes of 32∘ S and 36.5∘ S, possibly for two decades. But since it began drifting equatorward in 2005 (Fig. 9) the informal name Berg seems more appropriate (this arose from its vague similarity to an iceberg disconnected from an ice shelf).

3.3.3 Bin-averaged single-transit winds
To improve wind speed accuracy in latitude bands with a high density of single-transit cloud targets, we binned the 1-6 hour tracking results into 2∘ latitude bins and computed weighted averages. The results for 2∘ bins, including only bins for which estimated errors could be reduced to 10 m/s or better are provided in Table 5. For these 10 bins, the listed latitude is the mean latitude of the wind vectors included in the bin, not the latitude of the center of the bin. The binned and high-accuracy tracking results are plotted in Fig. 10, where we also show two different fits to the observations, which are described in the following section.
3.3.4 Fitting smooth functions to zonal wind observations
To facilitate use of these results by the scientific community, we fit the raw observations with 10th order and 11th order Legendre polynomial expansions. These polynomials are orthogonal solutions to Laplace’s equation in spherical coordinates, ideally suited to representation of a zonally uniform function, and are used by dynamical modelers (Lebeau and Dowling 1998). Because of large latitude gaps in the observations, fits of these and higher orders are prone to wild oscillations in the unmeasured regions. Also, because of the extremely high accuracy of some of the long-term observations, a fit that strictly weights observations according to estimated measurement accuracy can be dominated by a few highly accurate observations at the expense of large deviations in regions with few accurate measurements. To provide a degree of smoothing in the fitting process and to equalize weighting over all measured latitudes, we applied the following constraints: each 2007 observation had its error increased by root-sum-squaring it with a minimum error of 1 m/s; in addition, synthetic measurements of 0.0 m/s0.01 m/s were added at the poles, and the Voyager result at 71.7∘ S (1754 m/s) was added to inhibit instability in what would otherwise be a large unmeasured region and because it is the only measurement ever obtained between the south pole and 42∘ S. The resulting fits are shown by the solid curves in Fig. 10, with fit coefficients given in Table 6. The relative values of these fits are 1440 and 1280 for the order 10 and 11 Legendre fits respectively. These large values of are a result of the regions of nearly zero wind speed gradients, which cannot be well fit with the imposed smoothing constraints. The dispersion of these different fits in regions without measurements is a useful reminder that the true profile there is not constrained by observations.
3.3.5 North-south asymmetry
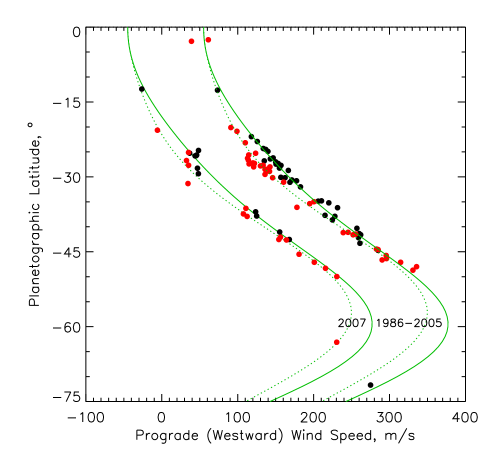
The fit profiles compared to their reflections about the equator (dotted curves in Fig. 10) indicate that the wind profile is asymmetric. The biggest asymmetry may be in the region of the prograde jets near latitudes of 54∘, but at present this is hardly constrained at all by the observations. Although the northern jet will likely become better defined within the next several years, presuming that an obscuring south polar cap does not form too rapidly, there is less prospect for improved measurements in the southern band region, or especially poleward, before the next equinox (in 2049), although there is some hope that the southern collar may break up into trackable features before disappearing entirely. The asymmetry is more convincingly shown by direct comparison of observations. In Fig. 11, we plot the most accurate observations from 2007 in black, then plot the northern half of the observations with inverted latitudes in red, providing a direct comparison of northern and southern observations at the same distance from the equator. We also show a similar plot for all observations from 1986 to 2005, displaced by 100 m/s to avoid overlap. This second curve is dominated by the more recent measurements from 1997-2005, which will be further discussed in the following section. Although the asymmetry is not large, it is clearly resolvable and consistently supported by recent measurements. The best defined asymmetry is in the 20-40∘ latitude range, where it is only about 20 m/s.
| Std. Dev. | Eastward | Zonal wind | |||
|---|---|---|---|---|---|
| Lat. () | Lat. () | in Lat. (∘) | drift rate (∘/h) | (m/s westward) | NBIN |
| 62.87 | 63.930.18 | 0.12 | -3.800.17 | 21110 | 3 |
| 49.19 | 50.500.14 | 0.19 | -2.840.07 | 23106 | 7 |
| 48.70 | 50.010.13 | 0.15 | -3.010.10 | 24308 | 5 |
| 46.80 | 48.130.08 | 0.11 | -2.580.09 | 21608 | 2 |
| 38.13 | 39.430.10 | 0.43 | -1.410.06 | 13606 | 4 |
| 35.34 | 36.600.08 | 0.60 | -1.250.05 | 11606 | 4 |
| 2.33 | 2.440.09 | 0.18 | 0.450.06 | -7109 | 4 |
| -24.65 | -25.670.08 | 0.15 | -0.420.06 | 4606 | 2 |
| -25.59 | -26.640.09 | 0.06 | -0.150.08 | 1709 | 2 |
| -34.52 | -35.780.09 | 0.66 | -0.960.07 | 10010 | 2 |
NOTE: Uncertainty estimates here exclude the systematic errors discussed in Sec. 3.2.
| Legendre | Order-10 | Order-11 |
|---|---|---|
| Function | Coeff. | Coeff. |
| 79.90 | 75.06 | |
| -13.99 | -20.05 | |
| 203.5 | 220.4 | |
| -159.5 | 4.77 | |
| -126.5 | -153.7 | |
| -5.24 | -5.307 | |
| -11.49 | -110.2 | |
| 4.437 | 21.07 | |
| -42.05 | -59.91 | |
| 14.81 | -47.44 | |
| 28.33 |
3.4. Stability of the zonal circulation
In Fig. 12 we compare our fit profiles to prior wind observations of Smith (1986) using Voyager images, radio occultation results of Lindal et al. (1987), 1997 HST results by Karkoschka (1998b), and results by Hammel et al. (2001) that were derived from a combination of 1998 HST NICMOS images and 2000 HST WFPC2 and Keck images. We also include high-accuracy and binned results of Sromovsky and Fry (2005), shown as small black dots, and new results based on 2003 observations by Hammel et al. (2005a), shown as purple diamonds. We remeasured these latter observations to correct for a small navigation error that shifted the latitude scale by 1.5∘. The solid curves shown in this figure are the same fits given in Fig. 10. Most of the data displayed here are reasonably consistent with the zonal profile determined from our 2007 observations. Besides a few deviant points near 27-30∘ N, which are plausibly related to companion cloud features, the most significantly deviant points are those of Hammel et al. (2001). At latitudes between 25∘ S and 40∘ N, the Hammel et al. (2001) observations are 10 m/s less westward than the trend followed by most of the other observations, while they are in much closer agreement elsewhere.
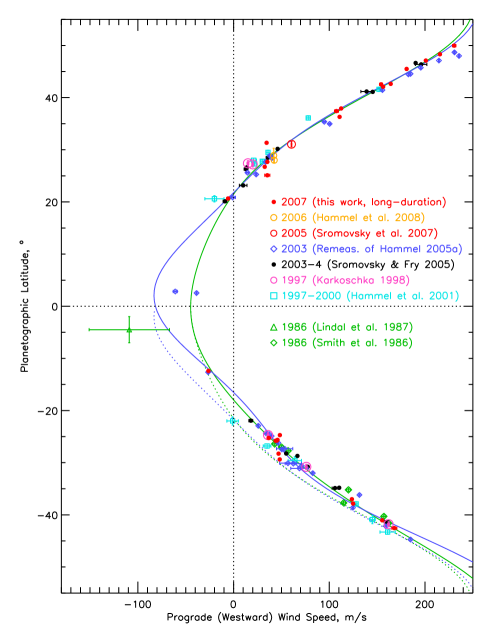
There is remarkably little difference between the 1986 Voyager results and the more recent extensive observations in 2003-4 and in 2007. Perhaps the close agreement of 2003-4 and 2007 results should not be too surprising because of the relatively short time interval in comparison to Uranus’ rather long radiative time constants (Conrath et al. 1990). It is much more surprising that there is such close agreement with the Voyager results, which were obtained 21 years prior to the 2007 equinox, and close to the midpoint between the last two equinoxes. If the asymmetry we see at the time of the 2007 equinox is at a peak, which might be expected if it is a long-delayed response to seasonal solar forcing, then the Voyager results might be expected to be half-way between the current asymmetry and its reversal (shown as the dotted curves in Fig. 12). Even though the asymmetry in the zonal circulation is small, the Voyager results are clearly not halfway between the current and reversed states. They are instead in very good agreement with the current drift rate observations, suggesting that the asymmetry in the zonal circulation may be a permanent one. Although there is no known physical basis for such a permanent asymmetry, it cannot be ruled out, especially given the substantial and non-seasonally reversing asymmetries in the circulations of Jupiter and Saturn.
4. The Behavior of Long-lived Discrete Features
Karkoschka (1998a) tracked seven cloud features in near-IR HST NICMOS images captured during July and October 1997, and noted that during the entire time span he found no evidence for appearance or disappearance of any of features. Hammel et al. (2005a) and Sromovsky and Fry (2005) showed that not all Uranus cloud features share this persistence. However, Sromovsky and Fry (2005) did find seven long-lived cloud features during the 2003-2004 time period, most with estimated lifetimes longer than a month, one longer than a year, and one that appeared to persist for a decade or longer. We also found long-lived features in our 2007 data.
4.1. Tracking of long-lived cloud features
Among the 28 cloud features stable enough to track over more than a single rotation of Uranus, seven were tracked for more than 1000 hours, one of which was tracked for more than 2250 hours. The latter feature (labeled 60707 in Fig. 2) is a relatively subtle brightening at the edge of the southern bright band, best seen in the high-pass filtered image for 27 July. It can also be seen near the central meridian in the 31 July image in Fig. 3, and near the right limb in Fig. 6. A plot of longitude and latitude vs. time (Fig. 13) indicates both short-term and long-term variability in the position of the feature. Most of the short-term variability is due to the fuzzy longitudinally extended nature of the feature, which creates uncertainty in defining its exact location in longitude. The long-term variations may be due to wave motion. Although the existence of a stable oscillation cannot be confirmed due to sampling limitations, the deviations from a constant longitudinal drift are consistent with a modulation amplitude (0 to peak) of 3∘ and a period of 83 days. That period is much shorter than the period of 1000 days found for the large feature near 34∘ S (Sromovsky and Fry 2005) or the periods of 448 or 753 days suggested for the brightest ever Uranus cloud feature found at 30∘ N (Sromovsky et al. 2007). If the longitude oscillation is attributed to a small latitudinal oscillation and an associated variation in drift rate due to the latitudinal gradient in the zonal atmospheric flow, then the amplitude of the latitudinal oscillation would be only 0.08∘, and thus not observable. (Equations relating latitudinal and longitudinal oscillations are given in Sec. 4.3.)

4.2. Reacquisition of a major northern bright spot (and dark spot?)
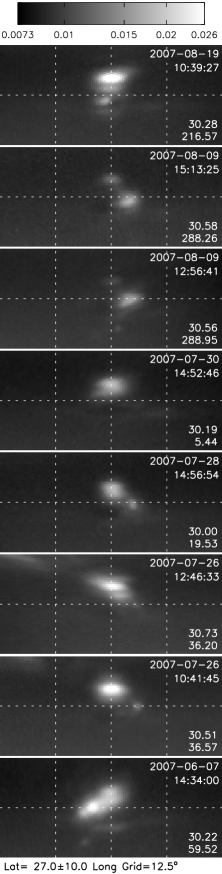
The next longest tracking interval (1751 h) was achieved for the target labeled 60720 (visible in Figs. 2-4). This is part of a complex of features near 30∘ N that probably persists for much longer periods than any individual element and is likely related to an especially prominent bright spot near 30∘ N latitude, which in August 2005 became the brightest cloud feature ever observed on Uranus. That feature was also found to exhibit two superimposed oscillations, a slow 445-day oscillation in longitude relative to its mean drift rate and a rapid 0.7-day inertial oscillation (Sromovsky et al. 2007). A similar feature (possibly the same feature in a different state of activity), was seen in 2007. A sequence of images of this feature, shown in Fig. 14, suggests that the bright feature is possibly a companion to a dark feature. Other bright companions seem to be present as well, with varying relative locations and brightness values. In two cases, in the bottom row and 2nd from the top row in Fig. 14, the brightest feature in the H image is different from the brightest feature in the K′ image, which is a more sensitive indicator of cloud altitude. Temporal variations in altitude are also present as indicated by varying relative brightness in K′ images.
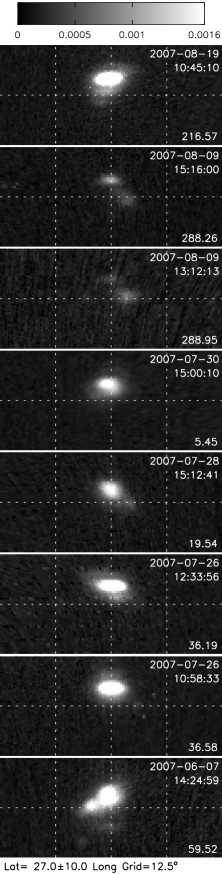
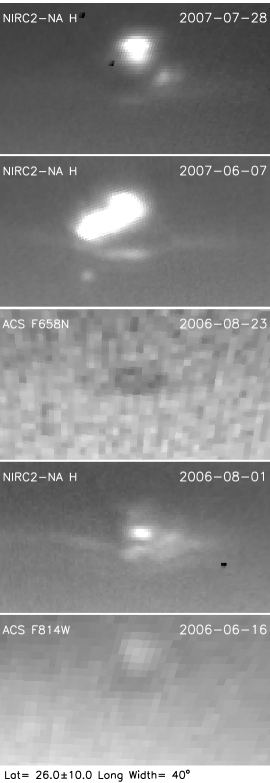
This northern complex appears to be related to the first dark spot discovered on Uranus. While Neptune is famous for its Great Dark Spots, until recently there had been no comparable feature observed on Uranus. The first such Uranus Dark Spot, discovered with HST in 2006 (Hammel et al. 2009) and shown in Fig. 15, exhibited a surprisingly large contrast in the red and was faintly visible in Keck near-IR images in 2006. A compact dark feature was also observed on 7 June 2007 in Keck images (also in Fig. 15), along with bright companion clouds much like those observed for Neptune’s Great Dark Spot in 1989 (right column of Fig. 15). Both HST and Keck features are of similar size, about 9-10∘ in longitude and about 3.5∘ in latitude, and at similar latitudes of 25-26∘N. The Keck feature in 2007 is just south of 60720 in Fig. 2 and is also visible in Fig. 14.
4.3. Possible oscillation of the 30∘ N complex
The possibly oscillatory behavior of the bright/dark complex is illustrated in Fig. 16, which displays longitude and latitude observations for three bright cloud features associated with the 30∘ N complex. Tracking the motion of the group of features is complicated by substantial changes in morphology. The most stable of the various elements is the feature labeled 60720. This feature exhibits a clear variation in latitude during July 26-31, which is accompanied by a variation in longitude relative to its mean drift longitude. The best fit constant drift longitude is indicated by the solid black curve in the top panel, which becomes a horizontal line in the relative longitude plot in the middle panel. These two sets of variations are consistent with a simple model in which the latitude of the feature oscillates in time and acquires a drift rate that matches the zonal wind profile as it moves in latitude. For small oscillations we can assume a linear gradient in the zonal wind profile. Following Sromovsky et al. (2007), except starting with the latitude modulation, we obtain the coupled equations
| (1) | |||
| (2) |
where, is latitude, is the amplitude of the latitudinal oscillation, is the period, is the time reference, is the time delay of the oscillation, denotes longitude, is the gradient of the zonal wind drift (longitude change per unit time) with respect to latitude, evaluated at the reference latitude , is the zonal drift rate at the midpoint of the oscillation, and is the initial longitude. Because the drift rate may be controlled by a circulation feature at a slightly different latitude than the observed feature, and because we don’t really know the zonal wind itself with sufficient accuracy, is determined independently rather than just evaluating the zonal wind profile at .
The blue oscillatory curves in Fig. 16, which fit the observed longitude and latitude variations of cloud 60720 reasonably well, use the model defined by Eqs. 1 and 2 with parameter values = 30.2∘N, ∘, h, =1415 h, 1.0∘, ∘/h, assuming the value of D′ = -2.392∘/day/∘Lat given by Sromovsky et al. (2007), where here longitudes are positive eastward. The derived value of is just 0.002∘/h more than the drift rate obtained for a constant drift model. The gold curves, which are just offset versions of the blue curves, provide a reasonable fit to the variations of cloud target 72606, which is offset from 60720 by 3.8∘ in latitude and 4.3∘ in longitude. These two features appear to move at the same drift rate, even though widely separated in latitude, suggesting that they are both companions to a circulation feature, such as a dark vortex, which control both their motions. The oscillation period of 350 h is very different from those determined for the 30∘ N feature in 2005, which had a rapid oscillation at an inertial period of 0.68 days and a slow oscillation at a period most likely near 450 days, but possibly longer (Sromovsky et al. 2007), although the latitude amplitude was comparable (0.6-0.7∘). It should be noted that the best evidence for an oscillation is near 1200 hours (see Fig. 16), where the samples are relatively closely spaced and the feature morphology is relatively consistent, though even there the coverage is only a small fraction of a cycle. The large difference in the morphology of the feature complex between 7 June 2007 and 26 July 2007 make the linkage between early and late observations uncertain. Thus we cannot confirm the existence of a stable oscillation, although it does provide a plausible possible explanation for the observed deviations in longitude and latitude.
An especially odd result is the uncertain fate of the complex between 20 August 2007 and 7-9 September 2007. The most consistent feature (60720) does not appear anywhere near the predicted location in the September images. The feature identified as 81905, which is about 4.5∘ S of 60720, provides the most likely match to the only feature seen anywhere near the predicted location. However, with this assignment the inferred drift rate (see red points and linear drift line in Fig. 16) is very different from what characterized the BS30N complex at prior times. Thus it may be the case that the vortex generating the complex of bright cloud features changed dramatically between 20 August and 7 September, perhaps dissipating or perhaps increasing its rate of latitudinal drift. Given the long lifetime of this feature, and the past evidence of great variations in the brightness of its companion features, it seems more likely that it may be just going through a change in vertical structure that temporarily reduces its production of companion clouds, as was inferred for the rapid (4-day) disappearance of a bright component of a southern feature in 2004 (Hammel et al. 2005b).
4.4. Dynamical changes in the southern Berg feature.
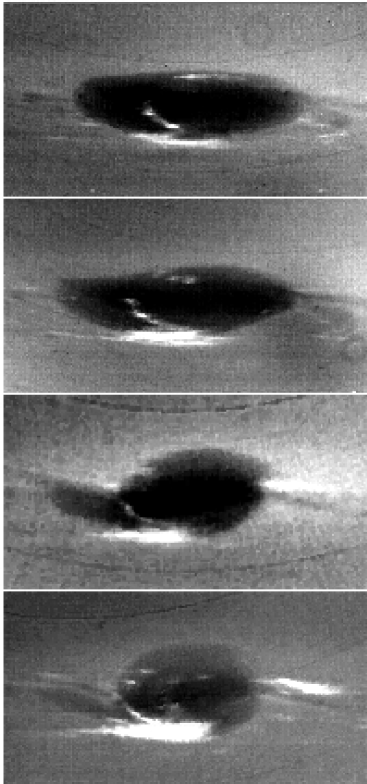
Between 1998 and 2004 what we are now calling the Berg was the one clearly prominent and persistent feature near 34∘ S planetocentric latitude, which oscillated in latitude between 36∘S and 32∘S with a period of 1000 days (Sromovsky and Fry 2005). This feature, which is feature A in the results of Hammel et al. (2005a), has long consisted of two components separated by about 2∘ of latitude. The northernmost component is generally an elongated streak, covering from 10∘ to 20∘ of longitude prior to 2005 (Sromovsky and Fry 2005), but more recently as much as 40∘ (Fig. 17). A feature morphologically similar to the 1998-2004 feature, and in the same latitude range was found in 1994 and in 1986 Voyager observations, suggesting a lifetime of nearly two decades. It was thus quite surprising to see major changes in the behavior of this feature between 2004 and 2007, during which it began drifting northward at about 2∘ of latitude per year (Fig. 9) and underwent large morphological changes (Fig. 17).
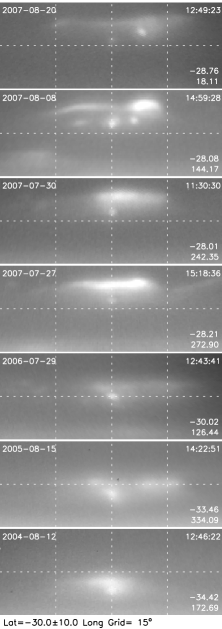
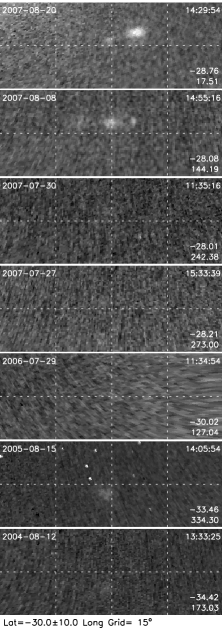
The southern component of the Berg usually took the form of a single small roughly circular bright spot (72708 in Fig. 2), at least up to 30 July 2007. This is the feature that Hammel et al. (2005b) found to brighten significantly in 2004 K′ images. However, on 8 August 2007 three small southern components were seen (80811, 80815, and 72708, in Fig. 4), and on 20 August 2007, only two were seen (80811 and 72708 in Fig. 5). Note that several small bright spots visible in the top two H images of Fig. 17 (left column) extended high enough in altitude to become visible in K′ images (right column), which is very unusual for a southern cloud feature. In fact, the sudden vertical development of the Berg in 2004 (Hammel et al. 2005b) may be dynamically related to the Berg’s subsequent northward drift. Whether the northward drift is the beginning of an equatorial drift and subsequent dissipation, as presumably occurred (but was unseen) for Neptune’s Great Dark Spot, or whether it will continue to exist in a new dynamical regime can only be answered with continued observations. The Berg might also be an analog to Neptune’s second dark spot (DS2). During the Voyager encounter that feature was observed to oscillate 2.4∘ in latitude and 47∘ in longitude with a 36-day period (Sromovsky et al. 1993). The oscillation of DS2 was never explained, nor was its absence in any subsequent images of Neptune. Perhaps it stopped oscillating and began an equatorial drift that ultimately resulted in dissipation. Thus, its fate might be better understood from a more detailed history of the Uranus Berg.
4.5. Motion of the Berg in 2007.
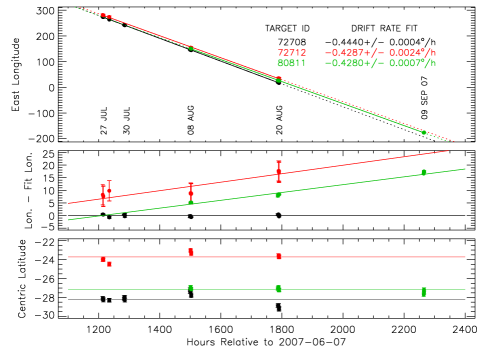
The motion of the Berg in 2007 is complicated to define because its component elements undergo such dramatic morphological changes. Each component can only be tracked for a small fraction of the total lifetime of the complex. Targets that were part of the complex included, 72708, 72712, 82007, 80811, and 80815. The most prominent of these was 72708, a small well-localized bright feature a few degrees south of the main streak feature. It was tracked from 27 July 2007 to 20 August 2007, and can be seen in the left column of images in Fig. 4, including the K′ image, which indicates that it reached unusually high altitudes for a southern hemisphere cloud feature. Two other features (80811 and 80815) also appear in this image, and can also be seen, though with low contrast, in the K′ image. Another prominent feature (72712) is a brighter and thicker region within the elongated streak, visible in Fig. 2. This feature is not well localized in longitude but is well localized in latitude. Observations of 72708, 72712, and 80811 are plotted in Fig. 18. These yield very accurate drift rates, but don’t all agree with each other within their expected uncertainties. This is not too surprising, given the possibility of companion clouds forming in the vicinity of the generating vortex, but not always at a stable location.
Although 72708 and 72712 differ in drift rates by 0.0153∘/h over the 300 hours during which they were both observed, that only results in relative longitudinal shift of 4.6∘, which is a small fraction of the 30∘ extent of the Berg complex. The mean latitudes of 72712 (23.72∘ S PG) and 80811 (27.17∘ S PG) differ by 3.45∘ and would thus have a differential drift rate of 1.38∘/h, implying a separation by more than 400∘ of longitude over the 300 hours, if they had moved with the mean zonal flow at their respective latitudes. This assumes that the zonal flow does not actually have a nearly zero latitudinal gradient at the latitude of the feature. However, the gradient we infer is mainly based on features at nearby latitudes, not at exactly the same latitudes. Unfortunately, there is so much uncertainty in the drift rate of other features at the same latitude, that one cannot reach a definitive conclusion regarding the true zonal wind gradients at the Berg latitude.
There seems to be no clear latitudinal drift or oscillation during the 43 days of tracking of Berg features in 2007. Some components do move in latitude, but the overall behavior suggests a slight maximum in mid August of 2007. However, we cannot conclude that the equatorial drift is at an end because HST images obtained in September 2008 show what appears to be the Berg at a surprisingly low latitude of 17∘ S (Sromovsky et al. 2008), which suggests that the Berg’s equatorial drift rate has actually accelerated. More observations in 2009 and beyond will be needed to unambiguously resolve the latitudinal drift and ultimate fate of this interesting dynamical feature.
5. Possible Seasonal Changes in Latitude Bands
5.1. Expectations
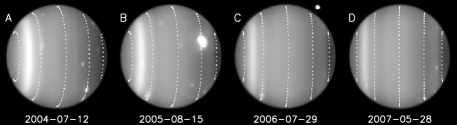
Because of its 98∘ spin-axis inclination, Uranus has the largest fractional seasonal variation of insolation of any planet. Because of its long radiative time constant, its response to this forcing should be small and phase shifted by a considerable fraction of the 90∘ maximum. Thus, it is plausible to suggest that Uranus’ maximum north-south contrast should occur slightly before its 7 December 2007 equinox. Leading up to equinox, the two hemispheres have had strong differences in the albedo of deep cloud bands (Fig. 19) and in the dynamical activity producing localized bright and dark cloud features. These asymmetries are likely indicators of a seasonal response to the latitude-dependent seasonal variations of insolation and were expected to decline before equinox. If Uranus were only responding to the local annual average insolation, we would expect its atmospheric structure to be roughly symmetric about the equator (the expectation would be for exact symmetry except for the variation in Uranus’ orbital distance with season). Such approximate symmetry in structure does appear in recent microwave observations (Hofstadter et al. 2004), which probe very deep levels where the radiative time constant greatly exceeds Uranus’ 84-year orbital period. But at higher levels of the atmosphere, we have seen hemispheric contrast changes suggesting seasonal effects. The earliest changes were in the south polar cap, and the most recent in the bright band structure near 45∘ S.
5.2. The South Polar Cap
Analysis of 1986 Voyager observations by Rages et al. (1991) inferred the existence of a southern polar cap of relatively thick clouds. However, the presence of single permanent south polar cap was strongly rejected by the light curve analysis of Hammel and Lockwood (2007), as well as by the post 1994 imaging results. The bright cap was still prominent in 1994, but declined significantly between 1994 and 2002 (Rages et al. 2004), leaving primarily a narrow bright band near 45∘ S. Rages et al. (2004) interpreted the changed appearance as a decline in the optical depth of the methane cloud, placed between 1.26 and 2 bars, which resulted in better views of deeper cloud patterns at the 4-bar level, although changes in the polar region methane mixing ratio may have been an even more important factor (Karkoschka and Tomasko 2008).
5.3. The bright bands near 45∘
The “collar” that used to mark the boundary of the south polar cap is now visible as a bright band in images of intermediate absorption, such as the H-band images of Figs. 2-6. At short wavelengths, where little absorption is present, it is overwhelmed by Rayleigh scattering, and at strongly absorbing wavelengths it is too deep to be seen. The band extends from approximately 40∘ S to 48∘ S in planetocentric coordinates (41.3∘ to 49.3∘ planetographic). Near-IR grism observations of Uranus in 2006 from the Keck telescope indicate that the bright band is associated with increased aerosol scattering in a cloud layer near 2 bars (Sromovsky and Fry 2008). This cloud pressure estimate is based on methane band absorption models of Irwin et al. (2006) and a 1% CH4 mixing ratio. Using a 1.6% methane mixing ratio, which is closer to that estimated at the band latitude by Karkoschka and Tomasko (2009), Irwin et al. (2007) also found increased scattering near 2 bars from an analysis of similar near-IR spectra of Uranus obtained at the UKIRT observatory. On the other hand, Karkoschka and Tomasko (2009) were able to fit STIS CCD spectral images of the bright band using a model with locally increased aerosol scattering in a distributed layer between 1.2 and 2 bars. They argue that absorption coefficient extrapolation errors at near-IR wavelengths may be contributing to this pressure disagreement.
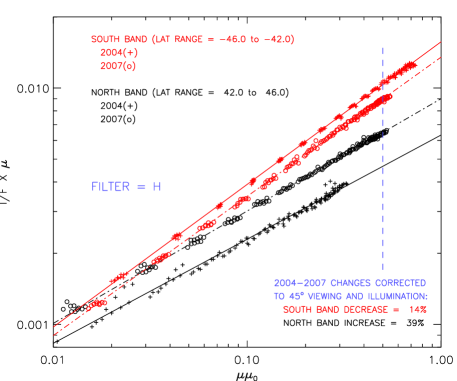
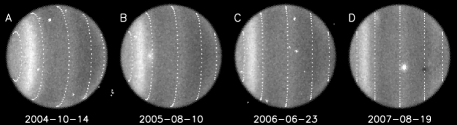
Recent HST WFPC2 and Keck observations of the bright band already provide evidence for the expected eventual reversal in hemispheric contrast. This is shown in Fig. 19, both in the sequence of Keck H-band images and in the Minnaert plots for 2004 and 2007, which are used to correct for view angle and illumination differences. For each year we separately sampled reflectivity variations within a 42∘-46∘ S band (planetocentric coordinates) and in what appears to be a developing northern band (using a symmetric sampling window of 42∘-46∘ N). We fit these samples to the Minnaert function , then evaluated each function for the same angular conditions (). Because not all of the Keck imagery has yet been photometrically calibrated, we scaled the images to yield the same central disk I/F value of (1.090.05), which is the H filter I/F value determined by Fry and Sromovsky (2007). The Keck H-band results reveal a small (14%) decline in the brightness of the south band and a substantial (39%) increase in brightness in the northern band. Although absolute changes are somewhat uncertain (perhaps 5% or more), there is little question that the northern and southern bands have been moving towards each other in brightness, with the northern band clearly brightening.
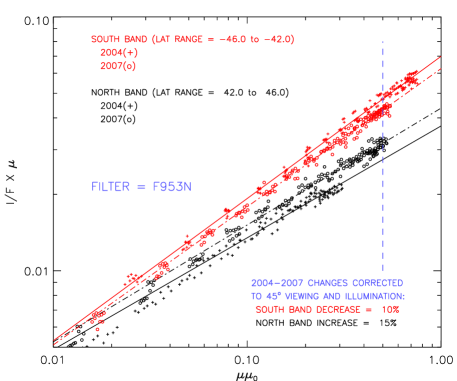
Changes in band brightness have also been resolved by HST WFPC2 images (Rages et al. 2007), which have more accurate photometry, although the size of the effect is much smaller at shorter wavelengths and the effect of phase angle variations needs to be considered. In Fig. 20 we display a Minnaert plot comparing HST WFPC2 F953N images from 2004 and 2007, finding a 10% decrease in the southern band and a 15% increase in the northern band; when we make the same comparison between 2005 and 2007, which provides nearly equal phase angles, the changes drop to 6% and 11% respectively, which is approximately consistent with a linear change. However, an analysis of the F791W HST observations yields somewhat different results, indicating that imperfect Minnaert corrections for the viewing angle differences at different phase angles may contribute a small fraction (1/4) of the observed changes in HST images of Uranus between 2004 and 2007.
If we assume that the brightness changes of the two 45∘ bands continued at the same rates observed between 2004 and 2007, they would reach equal view-angle corrected I/F values in the F953N filter band 3.5 years after equinox (when equal solar forcing existed in both hemispheres). A similar calculation for the H-band suggests a phase delay of 2.2 years. These are surprisingly small delays compared to the 100-year radiative time constant estimated near the 1-bar level by Conrath et al. (1990). Of course the temporal coverage for the 45∘ band variations is only a tiny fraction of a full cycle, and the actual mechanism of forcing is unknown, making the meaning of the phase delay estimates subject to considerable uncertainty.
6. Conclusions
HST WFPC2 imaging and near-infrared adaptive optics imaging of Uranus by the Keck II telescope during and leading up to 2007 has revealed new constraints on the dynamical response of the Uranus atmosphere to seasonal forcing. Our main conclusions are as follows:
-
1.
Discrete cloud features. We found 85 features that could be tracked well enough to yield wind errors 40 m/s, 51 of which were tracked for intervals between 1 and 6 hours, and 28 of which were tracked for more than a full rotation of Uranus. Discrete clouds were found at higher northern latitudes than previously was possible (up to 73∘ N), but otherwise the distribution of clouds was similar to that seen in 2003-4, except for greater numbers of clouds in the 35∘- 45∘N region. No trackable features were observed south of 42.5∘ S and few accurate winds could be measured at low latitudes due to sparse sampling and the lack of discrete features with sufficient contrast.
-
2.
Zonal mean circulation. The zonal mean circulation measured in 2007 attained very high accuracy at 28 latitudes where long-lived features could be tracked and medium accuracy at 10 latitudes by binning the 1-6 hr tracking results. The extended latitude range of our data allowed us to define for the first time a northern jet maximum near 58∘ N. We also remeasured features in 2003 images obtained by Hammel et al. (2005a), correcting for a small navigation error present in the original results and producing winds that are more consistent with other measurements.
-
3.
Asymmetry in zonal circulation. Uranus’ zonal circulation profile has a small asymmetry that is most apparent in the 20-40∘ latitude range, reaching a broad peak of around 20 m/s in the difference between north and south wind measurements at corresponding latitudes. This can be seen in 2007 measurements, but is more firmly established by combining measurements from 1997-2007. Symmetry properties equatorward of 20∘ and poleward of 50∘ cannot be assessed because of inadequate sampling.
-
4.
Temporal changes in the zonal circulation. Uranus’ southern hemispheric circulation measured in 2007 (near equinox) does not differ significantly from that measured in 2003-4 or from that measured by Voyager in 1986 (near solstice). If the observed asymmetry near equinox were seasonally reversed, the circulation should be midway through reversal near solstice, suggesting that Voyager winds should be 10 m/s slower than winds near equinox. That does not appear to be the case, suggesting that the small asymmetry observed in the circulation profile might be a permanent dynamical feature. Observations over a much longer time interval will be needed to firmly settle this issue.
-
5.
Long-lived cloud features. Seven cloud features were tracked for more than 1000 hours, several of which were associated with large groups that might be considered companion clouds to vortex circulations not directly observed. The longest lived cloud feature lasted for more than 2250 hours and has a non-uniform drift rate consistent with a latitudinal oscillation with a period of 2000 hours and an amplitude of 3∘.
-
6.
The major northern cloud complex. A group of bright features observed near 30∘ N seems to consist of companions to a recently discovered visible Dark Spot. The feature has non-uniform motions consistent with coupled latitude and longitude oscillations, with a period of 350 hours, and amplitudes of 0.55∘ in latitude and 3∘ in longitude. Although no individual component was tracked throughout the observation period, the complex as a group of variable components did exist throughout the observation period (covering 2250 hours), and seems likely to be the same feature associated with the 2006 Uranus Dark Spot (Hammel et al. 2009), and perhaps the extremely bright cloud complex discovered first in 2005 Keck images (Sromovsky et al. 2007).
-
7.
Dynamics of the Berg. The major southern cloud feature that oscillated for many years between planetocentric latitudes of 32∘S and 36.5∘S, started drifting northward in 2005, reaching a mean latitude near 26∘S in 2007. Remarkable morphological changes occurred during this drift, and beginning as early as 2004 (Hammel et al. 2005b), some components reached altitudes high enough to be visible in K′ images. This is the only feature observed on Uranus or Neptune that exhibited a long period of latitudinal oscillations and subsequently transitioned to a state of latitudinal drift. Its subsequent fate may help us to understand the disappearance of Neptune’s second dark spot (DS2).
-
8.
Progress towards Bright Band reversal. In the Keck II images a northern bright band became visible in 2007, a counterpart to the bright band extending from 40∘-48∘ planetocentric latitude (41∘-49∘ planetographic) in the southern hemisphere. Photometric analyses of Keck and HST images show that from 2004 to 2007 the southern band has faded by 14% in the H band Keck II images, and by 10% in WFPC2 953N images, while the northern band has brightened by 39% and 15% respectively. This suggests that hemispheric symmetry at this latitude would be achieved 2.2-3.5 years after equinox and that bright band reflectivity has a surprisingly small lag relative to solar forcing.
Future observations should provide a much better definition of the circulation at high northern latitudes and better measures of the hemispheric contrast reversal that seems to be currently underway. We would expect to see a considerable brightening of the northern bright band and the eventual formation of a northern polar cap. Hopefully, the circulation at high northern latitudes can be well characterized before a thickening northern polar cap obscures discrete cloud features needed to track the winds. A breakup of the southern bright band may permit measurement of wind speeds in this thus-far poorly characterized region. The changes in vertical cloud structure associated with these changes in brightness distributions on Uranus will be investigated with the help of near-IR spectra as well as band-pass filter imagery from both HST and Keck observatories, some of which have already been acquired.
Acknowledgments.
We thank two anonymous reviewers for detailed reviews and constructive suggestions, specifically for pointing out the implied short time delay between equinox and projected bright band symmetry. This work is partly based on observations with the NASA/ESA Hubble Space Telescope. Support for Program numbers 10805, 11118, 11156, 11190, and 11292 was provided by NASA through grants from the Space Telescope Science Institute, which is operated by the Association of Universities for Research in Astronomy, Inc., under NASA contract No. NAS5-26555. Support for this work was also provided by NASA through its Planetary Atmospheres Program under grant NNG05GF00G (LAS) and the Planetary Astronomy Program under grant NNG05G084G (LAS). HBH acknowledges support from NASA grants NNG0GG125G, NNX06AD12G, and NNX07A043G, as well as funding from NASA specifically for Keck observations and reductions. IdP has been funded by NASA grant NNX07AK70G, and by the National Science Foundation and Technology Center for Adaptive Optics, managed by UC Santa Cruz under cooperative agreement No. AST-9876783. Some of the data presented herein were obtained at the W. M. Keck Observatory, which is operated as a scientific partnership among the California Institute of Technology, The University of California, and NASA, and was built with financial support of the W. M. Keck foundation. The authors wish to recognize and acknowledge the very significant cultural role and reverence that the summit of Mauna Kea has always had within the indigenous Hawaiian community. We are most fortunate to have the opportunity to conduct observations from this mountain.
References
- Acton (1996) Acton, C. H., 1996. Ancillary data services of NASA’s Navigation and Ancillary Information Facility. Planet. and Space Sci. 44, 65–70.
- Allison et al. (1991) Allison, M., Beebe, R. F., Conrath, B. J., Hinson, D. P., Ingersoll, A. P., 1991. Uranus atmospheric dynamics and circulation. In: Bergstralh, J. T., Miner, E. D., Matthews, M. S. (Eds.), Uranus. University of Arizona, Tucson, pp. 253–295.
- Conrath et al. (1990) Conrath, B. J., Gierasch, P. J., Leroy, S. S., 1990. Temperature and circulation in the stratosphere of the outer planets. Icarus 83, 255–281.
- Fry and Sromovsky (2007) Fry, P. M., Sromovsky, L. A., 2007. NIRC2 Photometry of Uranus, Uranian Satellites, and Triton in August 2004. Icarus 192, 117–134.
- Hammel et al. (2005a) Hammel, H. B., de Pater, I., Gibbard, S., Lockwood, G. W., Rages, K., 2005a. Uranus in 2003: Zonal winds, banded structure, and discrete features. Icarus 175, 534–545.
- Hammel et al. (2005b) Hammel, H. B., de Pater, I., Gibbard, S. G., Lockwood, G. W., Rages, K., 2005b. New cloud activity on Uranus in 2004: First detection of a southern feature at 2.2 m. Icarus 175, 284–288.
- Hammel and Lockwood (2007) Hammel, H. B., Lockwood, G. W., 2007. Long-term atmospheric variability on Uranus and Neptune. Icarus 186, 291–301.
- Hammel et al. (2001) Hammel, H. B., Rages, K., Lockwood, G. W., Karkoschka, E., de Pater, I., 2001. New Measurements of the Winds of Uranus. Icarus 153, 229–235.
- Hammel et al. (2009) Hammel, H. B., Sromovsky, L. A., Fry, P. M. Rages, K., Showalter, M., de Pater, I., van Dam, M., 2009. The Dark Spot in the Atmosphere of Uranus in 2006: Discovery, Description, and Dynamical Simulations. Icarus 201, 257–271.
- Hofstadter et al. (2004) Hofstadter, M. D., Butler, B. J., Hammel, H. B., Klein, M. J., 2004. The Discovery of Radio-Bright Northern Latitudes on Uranus: Implications for Weather and Climate. Bull. Am. Astron. Soc. 36, 1074.
- Irwin et al. (2006) Irwin, P. G. J., Sromovsky, L. A., Strong, E. K., Sihra, K., Bowles, N., Calcutt, S. B., Remedios, J. J., 2006. Improved near-infrared methane band models and k-distribution parameters from 2000 to 9500 cm-1 and implications for interpretation of outer planet spectra. Icarus 181, 309–319.
- Irwin et al. (2007) Irwin, P. G. J., Teanby, N. A., Davis, G. R., 2007. Latitudinal Variations in Uranus’ Vertical Cloud Structure from UKIRT UIST Observations. Astrophys. J. 665, L71–L74.
- Karkoschka (1998a) Karkoschka, E., 1998a. Clouds of High Contrast on Uranus. Science 280, 570–572.
- Karkoschka (1998b) Karkoschka, E., 1998b. Methane, Ammonia, and Temperature Measurements of the Jovian Planets and Titan from CCD-Spectrophotometry. Icarus 133, 134–146.
- Karkoschka and Tomasko (2008) Karkoschka, E., Tomasko, M., 2008. Standard Interpretation Method for Methane Band Imaging Disproven for Uranus. In: Bull. Am. Astron. Soc., Vol. 40 of AAS/Division for Planetary Sciences Meeting Abstracts. p. 489.
- Karkoschka and Tomasko (2009) Karkoschka, E., Tomasko, M., 2009. The Haze and Methane Distributions on Uranus from HST-STIS Spectroscopy. Icarus 202, 287–309.
- Lebeau and Dowling (1998) Lebeau, R. P., Dowling, T. E., 1998. EPIC Simulations of Time-Dependent, Three-Dimensional Vortices with Application to Neptune’s Great Dark SPOT. Icarus 132, 239–265.
- Lindal et al. (1987) Lindal, G. F., Lyons, J. R., Sweetnam, D. N., Eshleman, V. R., Hinson, D. P., 1987. The atmosphere of Uranus - Results of radio occultation measurements with Voyager 2. J. Geophys. Res. 92 (11), 14987–15001.
- Rages et al. (1991) Rages, K., Pollack, J. B., Tomasko, M. G., Doose, L. R., 1991. Properties of scatterers in the troposphere and lower stratosphere of Uranus based on Voyager imaging data. Icarus 89, 359–376.
- Rages et al. (2004) Rages, K. A., Hammel, H. B., Friedson, A. J., 2004. Evidence for temporal change at Uranus’ south pole. Icarus 172, 548–554.
- Rages et al. (2007) Rages, K. A., Hammel, H. B., Sromovsky, L., 2007. Uranus: Direct Comparison of Northern vs. Southern Hemispheres at Equinox. Bull. Am. Astron. Soc. 39, 425.
- Seidelmann et al. (2002) Seidelmann, P. K., Abalakin, V. K., Bursa, M., Davies, M. E., de Bergh, C., Lieske, J. H., Oberst, J., Simon, J. L., Standish, E. M., 2002. Report of the IAU/IAG Working Group on Cartographic Coordinates and Rotational Elements of the Planets and Satellites. Celestial Mechanics and Dynamical Astronomy 82, 83–110.
- Smith et al. (1986) Smith, B. A., Soderblom, L. A., Beebe, R., Bliss, D., Brown, R. H., Collins, S. A., Boyce, J. M., Briggs, G. A., Brahic, A., Cuzzi, J. N., Morrison, D., co-authors, 1986. Voyager 2 in the Uranian system - Imaging science results. Science 233, 43–64.
- Smith (1986) Smith, P. H., 1986. The vertical structure of the Jovian atmosphere. Icarus 65, 264–279.
- Sromovsky and Fry (2005) Sromovsky, L. A., Fry, P. M., 2005. Dynamics of cloud features on Uranus. Icarus 179, 459–484.
- Sromovsky and Fry (2007) Sromovsky, L. A., Fry, P. M., 2007. Spatially resolved cloud structure on Uranus: Implications of near-IR adaptive optics imaging. Icarus 192, 527–557.
- Sromovsky and Fry (2008) Sromovsky, L. A., Fry, P. M., 2008. The methane abundance and structure of Uranus’ cloud bands inferred from spatially resolved 2006 Keck grism spectra. Icarus 193, 252–266.
- Sromovsky et al. (2008) Sromovsky, L. A., Fry, P. M., Ahue, W. M., Hammel, H. B., de Pater, I., Rages, K. A., Showalter, M. R., van Dam, M. A., 2008. Uranus at Equinox: Cloud Morphology and Dynamics. In: Bull. Am. Astron. Soc., Vol. 40 of AAS/Division for Planetary Sciences Meeting Abstracts. pp. 488–489.
- Sromovsky et al. (2002) Sromovsky, L. A., Fry, P. M., Baines, K. H., 2002. The Unusual Dynamics of Northern Dark Spots on Neptune. Icarus 156, 16–36.
- Sromovsky et al. (2007) Sromovsky, L. A., Fry, P. M., Hammel, H. B., de Pater, I., Rages, K. A., Showalter, M. R., 2007. Dynamics, Evolution, and Structure of Uranus’ Brightest Cloud Feature. Icarus 192, 558–575.
- Sromovsky et al. (1993) Sromovsky, L. A., Limaye, S. S., Fry, P. M., 1993. Dynamics of Neptune’s Major Cloud Features. Icarus 105, 110–141.
- Sromovsky et al. (2000) Sromovsky, L. A., Spencer, J. R., Baines, K. H., Fry, P. M., 2000. NOTE: Ground-Based Observations of Cloud Features on Uranus. Icarus 146, 307–311.
- Stratman et al. (2001) Stratman, P. W., Showman, A. P., Dowling, T. E., Sromovsky, L. A., 2001. EPIC Simulations of Bright Companions to Neptune’s Great Dark Spots. Icarus 151, 275–285.