The Lyman alpha Reference Sample: V. The impact of neutral ISM kinematics and geometry on Lyman alpha escape ∗∗\ast∗∗\astBased on observations made with the NASA/ESA Hubble Space Telescope, obtained at the Space Telescope Science Institute, which is operated by the Association of Universities for Research in Astronomy, Inc., under NASA contract NAS 5-26555. These observations are associated with programs GO11522, GO11727, GO12027, and GO12583.
Abstract
We present high-resolution far-UV spectroscopy of the 14 galaxies of the Lyman Alpha Reference Sample; a sample of strongly star-forming galaxies at low redshifts (). We compare the derived properties to global properties derived from multi band imaging and 21 cm HI interferometry and single dish observations, as well as archival optical SDSS spectra. Besides the Lyman line, the spectra contain a number of metal absorption features allowing us to probe the kinematics of the neutral ISM and evaluate the optical depth and and covering fraction of the neutral medium as a function of line-of-sight velocity. Furthermore, we show how this, in combination with precise determination of systemic velocity and good Ly spectra, can be used to distinguish a model in which separate clumps together fully cover the background source, from the “picket fence” model named by Heckman et al. (2011). We find that no one single effect dominates in governing Ly radiative transfer and escape. Ly escape in our sample coincides with a maximum velocity-binned covering fraction of and bulk outflow velocities of km s-1, although a number of galaxies show these characteristics and yet little or no Ly escape. We find that Ly peak velocities, where available, are not consistent with a strong backscattered component, but rather with a simpler model of an intrinsic emission line overlaid by a blueshifted absorption profile from the outflowing wind. Finally, we find a strong anticorrelation between H equivalent width and maximum velocity-binned covering factor, and propose a heuristic explanatory model.
1. Introduction
Radiation in Lyman alpha (Ly), the transition between the ground state and the first excited state of atomic Hydrogen, is one of the most important sources of information about the high-redshift Universe; yet interpretation of this line has proven complicated.
Ly reprocesses around 2/3 of ionizing photons, or 1/3 of raw ionizing power, (Spitzer, 1978; Dijkstra, 2014) from star-forming regions into one strong, narrow emission feature. The transition is resonant which, combined with typically high column densities of neutral Hydrogen in young galaxies, leads to a high probability of absorption by ground-state hydrogen atoms and immediate reemission in a different direction. As a result, the typical mean free path of a Ly photon is considerably shorter and the optical path before escape significantly longer than is the case for non-resonance lines. Due to the longer path traveled within a H i system, Ly photons have a larger probability of encountering and getting scattered or absorbed by dust grains.
While the gas will be Doppler shifted out of resonance with a fraction of the Ly photons which can then escape freely, the photons that do experience scattering will typically be transported far away from their projected spatial point of origin after a number of scatterings before escaping or being absorbed. This effectively erases any information about their spatial origin, making Ly appear as an extended, diffuse halo superimposed upon imaging data in other filters (Östlin et al., 2009; Hayes et al., 2013, 2014; Steidel et al., 2011). With the escaping radiation distributed over a large area, these halos tend to contain large regions of low surface brightness which may integrate to a significant amount of the escaping Ly flux which is difficult to detect against foreground and noise, especially at high . The strength of this effect varies strongly between galaxies; some show strong diffusion, while it is less pronounced in others. Observed brightness and morphology in Ly is thus in part decoupled from intrinsic brightness and morphology, with observed values only in the broadest statistical sense tracing the intrinsic configuration.
The strong resonance of the transition has a similar impact on the shape and strength of the spectroscopic signature of Ly. As shown by e.g. Neufeld (1991), it is very unlikely, even with a very low dust content, for Ly to escape a static, homogeneous Hi medium. However, as observed by Kunth et al. (1998) and modeled by e.g. Verhamme et al. (2006), Dijkstra et al. (2006), Laursen et al. (2009), the presence of a bulk outflow, generated by e.g. radiation or momentum pressure from star-forming regions, can Doppler shift the atoms of the outflowing gas out of resonance with the Ly radiation coming from the inner regions, allowing them to escape more easily. Galaxies of similar intrinsic Ly equivalent width may show observed spectral features ranging from strong, P Cygni-like features to broad, damped absorption, depending on e.g. outflow velocity. Even in the presence of outflows, dust still has a suppressing impact on Ly escape fraction (Atek et al., 2009; Hayes et al., 2013). Studies have also suggested that observed equivalent widths of Ly are better reproduced by a clumpy medium embedded in a warm or hot, diffuse medium than the earlier models of a homogeneous expanding shell (Laursen et al., 2013; Duval et al., 2014). While many constraints and conclusions have been reached, pinning down the exact interplay of factors which governs Ly radiative transfer processes has proven difficult. The importance of outflows has been observationally confirmed by e.g. Kunth et al. (1998) and Wofford et al. (2013). Mas-Hesse et al. (2003) conclude that also the spatial distribution of neutral gas along the line of sight is important to the shape of the line profile, and have proposed a scenario reconciling the models with general theory of galaxy formation.
The Lyman Alpha Reference Sample (LARS, Hayes et al. (2013)) is a coordinated attempt to resolve some of the outstanding questions of Ly radiative transfer and escape by careful and detailed study of a sample of 14 star-forming galaxies in the nearby Universe. The backbone of the study is made up of HST imaging in H, Ly and FUV continuum as well as HST COS spectroscopy of the same galaxies. Additionally, the study encompasses observations in H i from the Green Bank Telescope (GBT) and the Karl I. Jansky Very Large Array (VLA); multi-wavelength optical observations from the Nordic Optical Telescope (NOT), Calar Alto PMAS IFU observations, HST-COS FUV spectroscopy presented here and treated in further detail by Orlitova et al. (in prep.), as well as archival data from SDSS, GALEX, and more.
In this paper, we present a detailed analysis of kinematics and geometry of the neutral medium along the line of sight towards the brightest star-forming regions of the LARS galaxies, inferred from absorption features in the UV continuum as observed in spectroscopy performed with the HST COS under programs 11522, 11727, 12027, and 12583. The aim of this analysis is to investigate how these properties influence the transport and escape of Ly in these galaxies. We are, for the first time, able to compare our spectroscopic findings to global properties of the sample galaxies, like e.g. global Ly escape fraction, extracted and computed from HST imaging as presented in Hayes et al. (2014). In this paper, “global” properties of a galaxy means properties of the full galaxy as obtained from either HST imaging or 21 cm radio interferometry or single-dish observations, presented in Hayes et al. (2014) and Pardy et al. (2014), whichever is appropriate from context. We measure a selection of metal lines in the low-ionized state (LIS) medium. LIS metal absorption lines are well established as tracers of neutral gas (see e.g. Pettini et al., 2002; Erb et al., 2012; Sandberg et al., 2013), and have been employed in studies of relations between neutral ISM kinematics/geometry and Ly radiative transfer (Kunth et al., 1998; Shapley et al., 2003; Jones et al., 2013) and Lyman Continuum escape (Heckman et al., 2011; Jones et al., 2013; Jaskot & Oey, 2014). In particular, we focus on the four Si ii lines at 1190, 1193, 1260 and 1304 to investigate in- or outflowing winds, line strengths, and utilize the fact that these lines all arise form the same ground state to attempt to resolve the ambiguity of whether residual flux at line center stems from low column density or low covering factor. Furthermore, we can compare our findings to global H i properties inferred from 21 cm GBT single dish and VLA interferometry observations as presented in Pardy et al. (2014) and in a broader scope the findings of other, related works in the field of Ly radiative transfer.
Furthermore, we stack and measure the Si iv transitions at 1122, 1393 and 1402 to trace the hot, high-ionized medium and compare its properties to those of the neutral medium.
The structure of this paper is as follows: In Section 2, we briefly present the sample, describe the observations involved in this analysis and the data reduction and preparations. In Section 3, we present data calibration and measurements, and give a short description of the methods involved. In Section 4, we present the results of these measurements and the subsequent analysis and comparisons with other works involving the sample. In this section, we also discuss how to interpret our findings. General discussion of our findings, comparisons to previous research in the field and possible caveats is done in Section 5. A summary and conclusion is given in Section 6, and a discussion of individual targets is given in Appendix A.
2. Observations and data
2.1. Sample
A full description and motivation of the sample is found in Östlin et al. (2014). Here, we provide a short summary.
Since the basic idea of the Lyman Alpha Reference Sample is to investigate the fate of Ly photons, which are mainly produced in the hot gas surrounding star/forming regions, the sample should consist of galaxies of strong star formation. To achieve this, a selection was made of UV-bright galaxies from the SDSS and GALEX catalogs. The galaxies were chosen to span UV-luminosities similar to those of Ly emitters and Lyman Break Galaxies (LBGs) at redshifts . To ensure that the sample consists of actively star-forming galaxies, LARS galaxies are selected to have a H equivalent width of W(H), a domain in which the galaxy luminosity is dominated by the young population of OB stars and a high production of Ly. Galaxies with FWHM(H) km s-1, indicating an AGN component, were rejected. The galaxies have redshifts within a range of ; the lower side keeps Ly well clear of the geocoronal Ly line, while the higher side keeps H within the imaging bandpass of the ACS camera on the HST.
LARS overlaps with other COS campaigns. LARS 1, 6, 7 and 10 are observed for and included in the sample of Wofford et al. (2013) as KISSR 1578, 2019, 242 and 178, respectively. LARS 12, 13 and 14 are observed by Heckman et al. (2011). The COS data of LARS 7 have also been published in France et al. (2010) as KISSR 242.
LARS galaxies have been observed in several wavelength ranges and with various techniques: In UV continuum-, Ly- and H imaging with the HST (Hayes et al., 2013; Östlin et al., 2014; Hayes et al., 2014), in 21 cm H i emission with Green Bank Telescope single dish and Karl I. Jansky VLA radio interferometric observations (Pardy et al., 2014), and Calar Alto PMAS IFU observations. An overview of key numbers describing the sample can be found in Table 1, including high precision redshifts derived from SDSS DR7 archival data.
| ID | Common name | (measured) | RA | Dec |
|---|---|---|---|---|
| [h:m:s] | [d:m:s] | |||
| (1) | (2) | (3) | (4) | (5) |
| LARS 01 | Mrk 259 | 13:28:44.161 | +43:55:51.31 | |
| LARS 02 | … | 09:07:03.150 | +53:27:13.28 | |
| LARS 03 | Arp 238 | 13:15:32.983 | +62:07:43.89 | |
| LARS 04 | … | 13:07:26.330 | +54:27:09.97 | |
| LARS 05 | Mrk 1486 | 13:59:48.958 | +57:26:38.11 | |
| LARS 06 | KISSR 2019 | 15:45:43.070 | +44:16:09.82 | |
| LARS 07 | IRAS 1313+2938 | 13:16:02.420 | +29:23:15.57 | |
| LARS 08 | … | 12:50:12.483 | +07:35:04.10 | |
| LARS 09 | IRAS 0820+2816 | 8:23:53.722 | +28:06:38.59 | |
| LARS 10 | Mrk 0061 | 13:01:40.301 | +29:23:10.09 | |
| LARS 11 | … | 14:03:46.251 | +06:28:28.05 | |
| LARS 12 | SBS 0934+547 | 09:38:11.650 | +54:28:41.94 | |
| LARS 13 | IRAS 0147+1254 | 01:50:27.210 | +13:09:14.96 | |
| LARS 14 | … | 09:25:58.924 | +44:27:53.29 |
2.2. Observations and data reduction
As described in Section 2, the LARS sample overlaps with two other samples for which COS spectroscopy has been obtained in the appropriate settings. Here we rely upon the archival data, and GO program ID numbers are listed in column 2 of Table 2. Specifically, LARS targets 1, 6, 7, and 10 were observed during COS guaranteed time observations (ID: 11522,12027, PI: Green, see Wofford et al., 2013), and LARS 12, 13, and 14 were observed under GO 11727 (Heckman et al., 2011).
Both sets of archival observations were obtained using the COS acquisition modes ACS/IMG or ACS/SEARCH, which successfully acquired and centred upon the brightest NUV point that fell within the Primary Science Aperture (PSA). For the FUV spectroscopy, somewhat different strategies have been adopted by the individual observers. GO 11522,12027 used one orbit per target, obtaining spectra in the G130M grating. These observers used two different central wavelength settings (CENWAVE=1291 and 1318 throughout; column 3 of Table 2) to perform a spectroscopic dither that spanned the gap between the two segments of the detector. GO 12727 observations instead used 2 or 4 orbits per target and, because of the larger redshift of these galaxies, obtained spectra in both G130M and G160M gratings. In each grating two exposures were obtained using different FP-POS positions of the grating to perform a small spectral dither.
Our own observations (GO 12583; LARS 02, 03, 04, 05, 08, 09, 11) also used one orbit per target. We first used the ACS/SBC/F140LP and WFC3/UVIS/F336W, obtained as part of the imaging campaign (Östlin et al., 2014) to identify the regions of peak UV surface brightness. Knowing precisely the target coordinates for the COS observations we acquired the targets with ACQ/IMG with the NUV imager. Again targets were perfectly centred to within a couple of NUV pixels. For five of the seven targets we noted that multiple UV sources would fall within the PSA, and may degrade spectral resolution, so in these cases we imposed orient constraints () in order to align multiple sources with the cross-dispersion axis. We performed spectral observations with the G130M grating; since the targets vary in redshift between and 0.084, we chose the CENWAVE settings (again see Table 2) to include Ly and the largest possible number of low-ionization absorption lines, tuning the spectral gap between the detector segments to regions without features of interest. For each target we performed spectral dithers using three FP-POS settings, except for LARS 3 which was observed in the continuous viewing zone (CVZ) and used all four FP-POS positions.
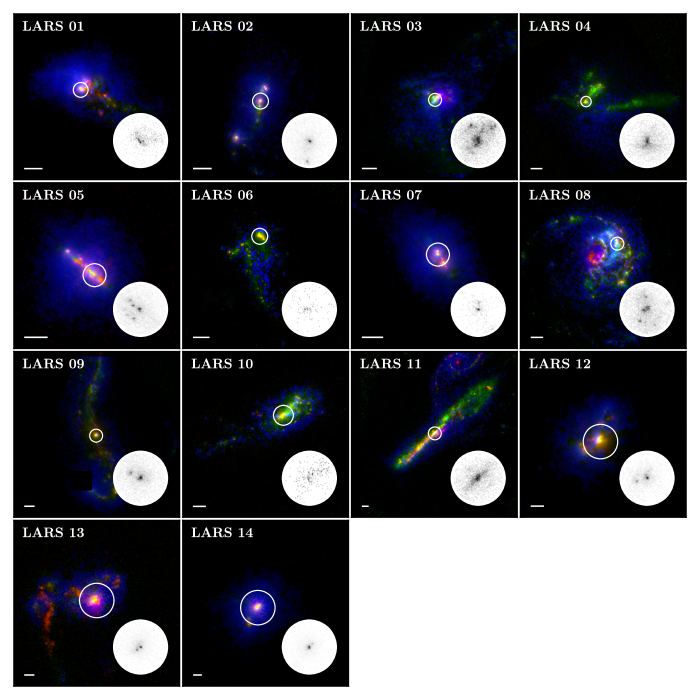
For illustration we show the position of the PSA (radius 1.25″) on each target in Figure 1. In each case this found the brightest star cluster in the FUV. Images are those of Hayes et al. (2014), encoding continuum-subtracted H in red, FUV continuum in green, and continuum-subtracted Ly in blue. The PSA is shown as a circle in each image. The lower right inset of each panel shows the corresponding COS/NUV acquisition frame, masked to match the aperture.
| ID | Prog. ID | Grating | Cenwave | Exp. time | |
|---|---|---|---|---|---|
| [Å] | [s] | [resel] | |||
| (1) | (2) | (3) | (4) | (5) | (6) |
| LARS 01 | 11522 | G130M | 1291,1318 | 1153.184 | 2.11 |
| LARS 02 | 12583 | G130M | 1327 | 763.168 | 1.64 |
| LARS 03 | 12583 | G130M | 1327 | 1005.216 | 2.57 |
| LARS 04 | 12583 | G130M | 1327 | 785.184 | 2.57 |
| LARS 05 | 12583 | G130M | 1327 | 722.176 | 1.40 |
| LARS 06 | 11522 | G130M | 1291,1318 | 1142.208 | 2.57 |
| LARS 07 | 11522 | G130M | 1291,1318 | 1111.168 | 2.11 |
| LARS 08 | 12583 | G130M | 1327 | 701.184 | 3.04 |
| LARS 09 | 12583 | G130M | 1309 | 618.176 | 1.64 |
| LARS 10 | 12027 | G130M | 1291,1318 | 1105.216 | 3.27 |
| LARS 11 | 12583 | G130M | 1300 | 698.208 | 3.04 |
| LARS 12 | 11727 | G130M,G160M | 1291,1600 aaSettings for gratings G130M and G160M, respectively. | 1140.192 | 1.40 |
| LARS 13 | 11727 | G130M,G160M | 1327,1623 aaSettings for gratings G130M and G160M, respectively. | 1800.192 | 1.17 |
| LARS 14 | 11727 | G130M,G160M | 1300,1611 aaSettings for gratings G130M and G160M, respectively. | 2550.208 | 0.70 |
Note. — Col. 6 lists effective resolutions in units of COS resolution elements as described in Sec. 3.2.
Data reduction was performed with CALCOS version 2.15.6 (2011-11-03) pipeline tools. Because our absorption features do not fall close to geocoronal emission lines we make no attempt to correct for O i lines near 1302 Å as done in James et al. (2014), instead collecting continuum photons obtained at all Earth-limb angles. Finally data were resampled onto a uniform wavelength grid using the corresponding to the coarsest value, and stacked rejecting any pixel for which the data quality flag was . We check for systematic offsets in the wavelength calibration by measuring the centroids of the geocoronal emission lines, using the wings of Ly and the O i line. For this we produced additional combinations of the extracted spectra, which permitted the inclusion of detector pixels with low pulse height amplitude and gain sag, so as to fully include the geocoronal emission. In no case did we measure the wavelength of geocoronal emission features to be offset from the systemic values by more than the resolution; even accounting for switching between mirrors B and A in target acquisition (LARS 05 and 09 only) we observe no reason to doubt the wavelength calibration within about 20 km s-1.
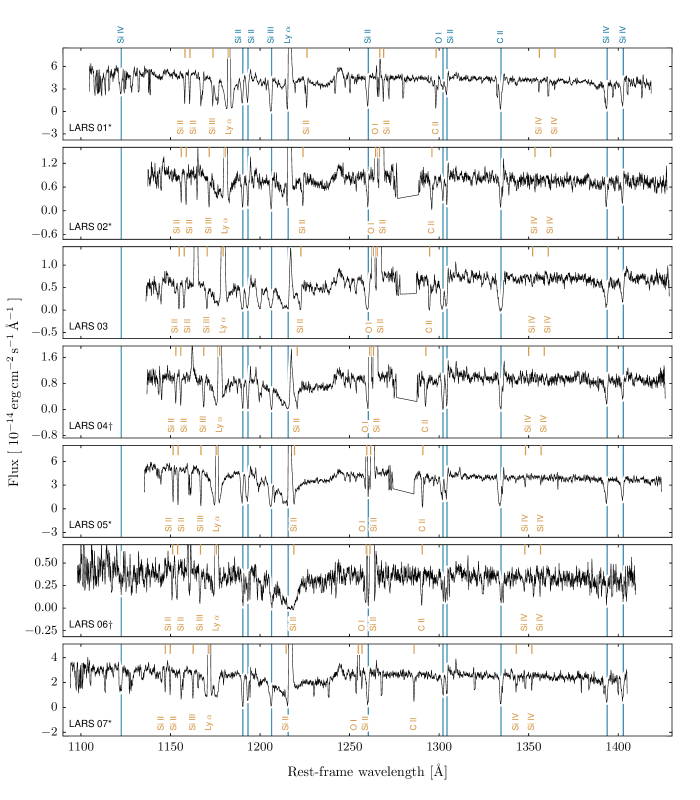
Figures 2 and 3 show the full spectra of all 14 galaxies in their rest frame. The transitions analyzed in this study are marked in blue; geocoronal and MW features are shown in orange. The spectra cover varying wavelength ranges; some spectra have been cut off where they did not contain any information included in this analysis. Galaxies with global Ly escape fraction in (Hayes et al., 2014) are marked with a , global Ly absorbers are marked with a .
3. Measurements
3.1. Systemic redshift
We base the systemic redshift determination on nebular emission lines in the hot regions surrounding the starbursts. We assume these lines originate from the same recombination processes as Ly and therefore can be expected to trace the intrinsic Ly well. While no strong nebular emission lines other than Ly are present in our COS spectra, such lines can be found in the SDSS archival spectra. Systemic redshifts were determined as described in Östlin et al. (2014) by aid of the lines H; [O i] , [O iii] , [N ii] and [S ii] .
The COS pointings of this sample are very close to those of SDSS; we do not report the numbers here but for the subsample included in Wofford et al. (2013), the offsets have been measured to 0.10, 0.08, 0.38 and for LARS 1, 6, 7 and 10, respectively. The aperture sizes are similar as well, for COS vs. for SDSS, so the systemic redshift derived from SDSS spectroscopy is believed to describe the same regions from which the Ly photons seen in the COS spectra originate. These redshifts were found by fitting each of the above mentioned lines in the SDSS data to a single Gaussian, inferring a redshift from each and since take a S/N-weighted average of these redshifts. SDSS-derived redshifts are listed in Table 1; other properties of the LARS galaxies measured and derived from SDSS spectroscopy can be found in Östlin et al. (2014). The computed redshifts all agree with those listed in the SDSS database to within .
In the case of LARS 01, 06, 07, and 10, (KISSR 1578, 2019, 242 and 178, respectively), the systemic redshifts were found to agree with those reached by Wofford et al. (2013) to within the precision reported there.
3.2. Effective resolution
The COS has a resolution of for a perfect point source, which corresponds to 6 detector pixels in the dispersion direction. We rebinned the data by a factor of 6 to reflect this, improving S/N without losing information.
The targets of this study are not point sources, so the effective resolution is somewhat lower than the instrument resolution, the amount depends on the extent and morphology of each target. We estimated the effective resolution for each target based on the reduced and cleaned UV continuum frames prepared by Hayes et al. (2014) in the following way:
We created a circular mask on the FUV frame corresponding to the COS aperture, rotated the part of the frame inside the mask to align with the COS acquisition image. Vignetting was taken into account by multiplying the flux in each aperture pixel with an interpolation of the aperture throughput grid in Figure 7 of Goudfrooij et al. (2010), and the flux then summed along the cross-dispersion direction. The half-light width of the resulting profile was found by linearly interpolating on a grid ten times finer than the actual pixel scale. The resulting width in pixel units was converted to arcsec, which again can be translated to COS resolution elements by the conversion factor arcsec/resel reported in the COS Instrument Handbook (Holland et al., 2014). The resulting widths are listed in Col. 6 of Table 2
3.3. Metal absorption line profiles
Key properties of the absorption lines selected for analysis in this work are tabularized in Table 3. Four Si ii absorption lines, one O i and one C II feature are together assumed to trace the neutral medium. The Si ii lines all arise from the ground state in Si II, allowing us to utilize their difference in line strength to evaluate Si ii column density and neutral gas covering factor.
Three Si iv lines are presented and briefly analyzed; they are believed to trace the interface between the hot, ionized medium in the regions around the starburst, and the surrounding neutral medium (Grimes et al., 2009; Strickland & Heckman, 2009). These lines may also contain a stellar component.
Finally, fluorescent emission lines connected to the fine structure splitting in the ground state of Si ii are included in the table, as they hold some significance to the discussion of our results. These lines arise when electrons in the excited state of a transition with significant fine-structure splitting of the ground state decay to the upper of these levels, which then quickly after decays into the lower fine structure level by emission of a long-wavelength photon. Since the upper level of the ground state is generally not populated, they are seen in emission only as a peak somewhat redwards of the main, resonant absorption feature - in case of the silicon lines treated here, the separation is Å. These lines are marked with a ∗ in Table 3.
| Transition | [Å] | [Å] | ||
|---|---|---|---|---|
| (1) | (2) | (3) | (4) | (5) |
| Si iv 1122 | 1122.48490 | 0.8190 | 45.142 | 919.3151 |
| Si ii 1190 | 1190.41580 | 0.2820 | 16.346 | 335.6973 |
| Si ii 1193 | 1193.28970 | 0.5850 | 16.346 | 698.0745 |
| Si ii* 1194 | 1194.500 | 0.7370 | 16.346 | 880.3465 |
| Si ii* 1197 | 1197.390 | 0.1500 | 16.346 | 179.6085 |
| Si ii 1260 | 1260.42210 | 1.2300 | 16.346 | 1550.3192 |
| O i 1302 | 1302.16848 | 0.0480 | 13.618 | 62.5041 |
| Si ii 1304 | 1304.37020 | 0.0925 | 16.346 | 120.6542 |
| C ii 1334 | 1334.53230 | 0.1280 | 24.383 | 170.8201 |
| Si iv 1393 | 1393.75460 | 0.5080 | 45.142 | 708.0273 |
| Si iv 1402 | 1402.76970 | 0.2520 | 45.142 | 353.4980 |
Note. — Column 2 holds the restframe wavelength of each transition. Column 3 holds the dimensionless oscillator strength of the transition. Column 4 holds the species’ ionisation energy in keV, and column 5 holds the product of oscillator strength and rest wavelength.
After reduction and resampling, the spectra were continuum-normalized around the absorption features of interest. This normalizing was performed by hand, as the continuum is generally not sufficiently well-behaved to be modeled. For each absorption feature, the surrounding wavelength ranges showing values which were deemed to make up the continuum were selected by hand, after which these values were fitted to a simple linear function, by which the data were then normalized. Several of the spectra show blending of the lines included in our analysis with MW and geocoronal features. Wavelength ranges affected by this were masked out and not included in the analysis.
The normalized lines and immediate surroundings were then interpolated linearly and evaluated on the coarsest grid in velocity space, i.e. the velocity step size of the line with lowest rest wavelength of each galaxy.
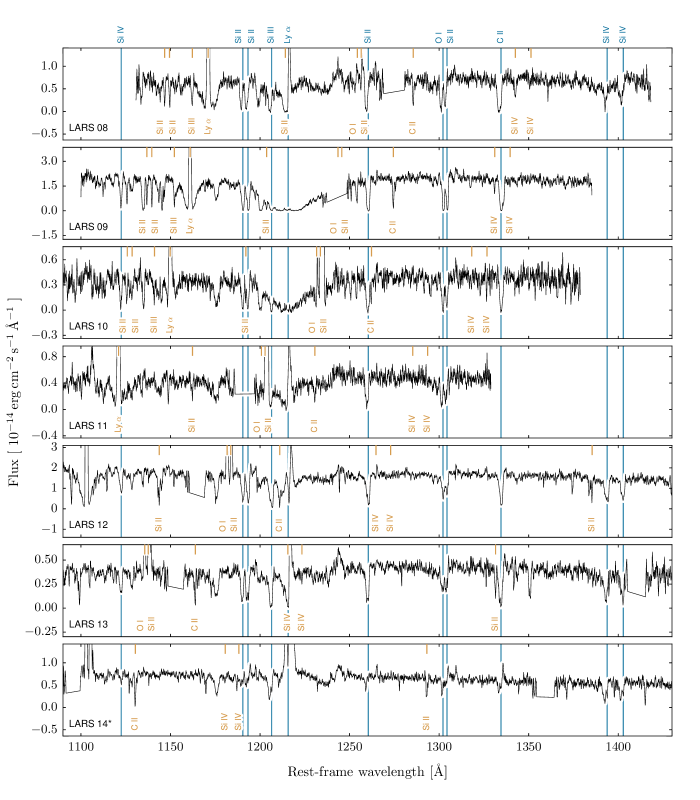
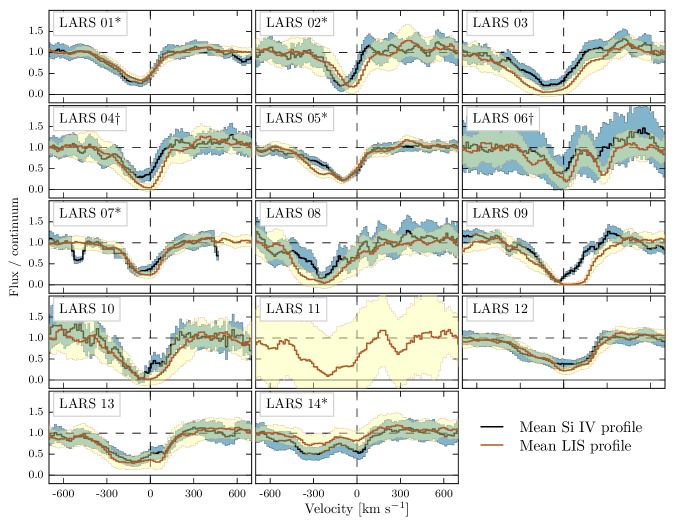
Figure 4 shows in the upper panel for each galaxy the normalized and resampled absorption profiles in velocity space of the Si II transitions at 1190, 1193, 1260 and 1334. Masked out wavelength ranges are not shown. The zero point value is the systemic velocity derived from SDSS spectroscopy of the nebular lines of the H ii regions surrounding galaxies’ star-forming regions. The profiles show a broad range of velocity shifts relative to systemic, as well as a variety of widths, depths and shapes. The lower panels of Figure 4 show, for reference, the profile of Si ii 1304 (the only one of the transitions present in all 14 LARS galaxies) along with the profiles of O i and C II . Also, in thick black, is shown the average of these and the Si ii lines or the subset hereof available in the given galaxy. Data shown in Figure 4 have been smoothed by a flat kernel 5 bins wide for clarity.
Despite their different oscillator strengths, there is a tendency for the lines to have almost equal depth and shape. This is usually an indicator that the profiles are the result of absorption in an optically thick medium with a less-than-unity covering fraction; For a fully covering but part transparent gas screen, transitions of different strengths would show a corresponding different in depth of their absorption features (see Sect. 3.4).
Like the LIS lines, the Si iv transitions were resampled in velocity space as described above and averaged for comparison with the LIS lines. These are shown in Figure 5 with their propagated standard errors as a surrounding shaded region.
3.4. Velocity binned neutral ISM covering
The presence of residual flux in a given velocity interval within an absorption feature can indicate either that the gas at these velocities is not completely opaque, or that this gas is opaque but only partly covering the background light source; or a combination hereof. In the presence of multiple lines arising from the same ground state, this can be disentangled by utilizing the differences in oscillator strengths of said lines in the apparent optical depth method described by Savage & Sembach (1991), used by e.g. Pettini et al. (2002) and Quider et al. (2009). The basic idea behind this method is that the different lines, in the case of an optically thin medium, will show different absorption depths depending on their oscillator strengths, while an optically thick system with partial covering will yield identical profiles for the different transitions. An extension of the method is employed in this work, which allows us to compute the column density and covering fraction of these lines as a function of velocity offset from the systemic zero-point (Jones et al., 2013). For want of any suitable transitions of H i to directly measure the covering fraction of the neutral ISM, we utilize the presence of four Si ii lines within the wavelength range of our spectra. The method is based on the following.
For a given velocity range, the column density and the covering fraction can be calculated from the ratio of residual intensity to continuum level by the following relation:
| (1) |
The optical depth is related to the column density and oscillator strength as:
| (2) |
where is the oscillator strength, the wavelength in , and the column density (in the given velocity range) in cm-2. In the presence of multiple absorption lines with different values of , arising from the same energy level in the same species, we can fit the data for and for each velocity bin. Our spectra cover the wavelengths of four lines arising from the ground state of Si ii with the wavelengths and 1304.
Practically, this computation was performed by formulating as a function of and finding the values of and that minimize the squared residuals of subtracting the measured from the theoretical ones. The procedure for the minimization was to create a simple grid of value pairs limited by the physically sensible, find the squared residuals in each point and then finding the combination that minimized this function. Confidence levels for the two parameters were found by projecting the contour (see below) onto the and axes.
It is important to note at this point that the values of found in this way is not what one would usually call the “covering fraction” of the neutral gas. The are the covering fractions of individual slices in velocity space of the gas, while covering fraction in the usual sense of this term, from here on denoted with a capital , is the covering factor of all neutral gas regardless of velocity. Since the individual velocity-space slices generally do not occupy the same projected physical space, it is entirely possible to have everywhere while still having a total ; the found values of provide only a lower limit for .
3.4.1 Fit quality indication
Due to contamination by Milky Way lines and geocoronal lines, lines falling outside of detectors at certain redshifts etc., not all transitions have usable data in all velocity bins for all galaxies. The minimum number of contributing lines required for our fitting procedure is 2. In this case, with two data points and two free parameters, there are zero degrees of freedom and thus the usual reduced is not defined. Instead, we report a pseudo-reduced , defined as . This goodness-of-fit indicator is defined everywhere, has the same minimum as the normal , and gives similar but not identical error estimates.
3.4.2 Averaged absorption profiles
Additionally, also in analogy with Jones et al. (2013), we have utilized a simple, complementary method to estimate the covering fractions by investigating saturated transitions. In the case where , equation 2 reduces to:
| (3) |
In this case, we would expect all reasonably strong lines to show the same absorption profile, and said profile will be a good proxy for the covering fraction. The Si ii absorption profiles in Figure 4 suggest that the four Si ii lines are indeed saturated, as does similar plots of the lines of O i and C II .
To minimize random variations, an inverse variance weighted average of the low-ionized absorption profiles is used for the further analysis; as usual, contaminated regions are masked out and not included in the final profile.
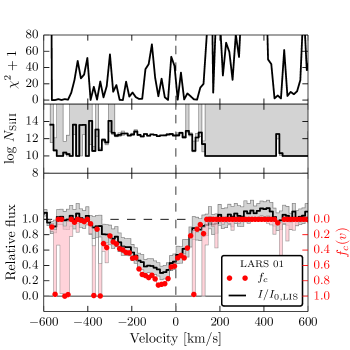
Figure 6 shows the averaged absorption profile of LARS 1 with the computed covering fraction overlaid, along with the computed column densities on logarithmic scale and the pseudo-reduced described in Section 3.4. It is apparent that the averaged line profile does indeed follow the computed covering fractions quite closely and thus is indeed a good proxy for the actual covering fraction. The other galaxies of the sample show similar behavior, as can be seen in Figures 8 through 10.
The same figures also show that these averaged profiles have considerably less scatter than the computed values of . Thus, after having shown that they do indeed follow the profiles well, we can benefit from adapting the averaged profiles as proxies for these in our further computations, although with some words of caution for a few of the galaxies (see Appendix A).
3.5. Velocities
When describing the kinematics of the neutral gas, a good set of characteristic velocities is needed. The approach usually taken for simple line profiles is to approximate them to a simple or possibly skewed Gaussian or Voigt profile and describe these by their centroid and FWHM or, for the Voigt profile, the broadening parameter . However, our profiles generally are too complex and asymmetric to be well approximated by a single profile. Instead, we characterize the profiles by a set of velocities based on their integrated area as follows:
- Integrated central velocity ()
-
The velocity which has 50% of the integrated absorption on each side and so acts as a figurative balancing point for the profile. This is more accurate for irregular line shapes than the centroid of an approximated Gaussian or Voigt profile, which will be misleading for an asymmetrically shaped feature. Error bars are found through Monte Carlo simulation by perturbing the measured profile with random errors drawn from a Gaussian fit to the measured error distribution and repeating the above computations through 100 iterations, after which the standard deviation of the distribution of obtained values is reported as the uncertainty.
- Velocity width ()
-
The distance on the velocity axis from 5% to 95% integrated absorption. This description of the line width is more robust to irregular line shapes than the more common FWHM, yet also robust to uncertainty determining the exact border between what is considered continuum and what is considered absorption feature. It should, however, be kept in mind when comparing to other results, that this width encompases a larger fraction of the total velocity distribution than the FWHM. Error bars found through the Monte Carlo method described above.
- Full Width at Half Maximum
-
Standard FWHM in velocity space. This is found using the Python package statsmodels to fit the observed profile to a Local Linear Estimator (LLE) with a kernel width found through cross validation. Error bars are found through Monte Carlo simulation. The FWHM is not very sensitive to choice of kernel width.
- Velocity at 95% integrated obsorption ()
-
The absolute value of the velocity which has 95% of the integrated absorption on its red side. This velocity gives a tracer of the far end of the velocity distribution relative to the systemic zero point.
- Velocity at minimum intensity ()
-
The velocity at which the intensity of the line has its minimum. In a perfectly symmetric absorption feature, this will be coincident with .
- Ly peak velocity ()
-
For the galaxies that show Ly emission in the COS aperture, we also report the velocity of the peak of this emission line. Like the FWHM, this is found fitting it to an LLE with a kernel width found by cross validation.
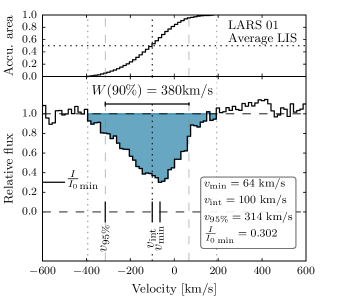
Figure 7 shows an illustration of the quantities mentioned above, except for FWHM which was measured separately and is assumed to be well known. The averaged absorption profile is drawn in black steps, the absorbed area in shaded green. The velocities , , and are shown along with the residual intensity at maximum absorption.
Besides these quantities, we have performed preliminary computations of the continuum-subtracted Ly flux within the COS aperture to evaluate how well the global Ly properties reflect the Ly properties that arise as direct consequence of the configuration and kinematic properties of the neutral gas.
4. Results
| ID | |||||||
|---|---|---|---|---|---|---|---|
| [km s-1] | [km s-1] | [km s-1] | [km s-1] | [km s-1] | [km s-1] | ||
| (1) | (2) | (3) | (4) | (5) | (6) | (7) | (8) |
| LARS 01 | 381 34 | -100 12 | -314 24 | -65 21 | 0.70 0.03 | 270 33 | 160 10 |
| LARS 02 | 351 102 | -48 33 | -258 80 | -24 25 | 0.86 0.07 | 168 66 | 140 4**From VLA 21 cm interferometry. The remaining figures are measured from GBT single-dish observations. |
| LARS 03 | 628 51 | -117 73 | -462 42 | -112 53 | 0.97 0.05 | 517 22 | 170 20**From VLA 21 cm interferometry. The remaining figures are measured from GBT single-dish observations. |
| LARS 04 | 365 61 | -31 152 | -261 46 | -13 31 | 0.99 0.07 | 311 42 | 180 4**From VLA 21 cm interferometry. The remaining figures are measured from GBT single-dish observations. |
| LARS 05 | 466 47 | -138 14 | -390 22 | -84 24 | 0.81 0.03 | 347 17 | 160 28 |
| LARS 06 | 553 43 | 68 28 | -244 38 | 4 93 | 0.84 0.06 | 475 197 | 370 3$\ddagger$$\ddagger$From GMRT interferometry (J. M. Cannon et al, in prep.) |
| LARS 07 | 392 68 | -38 18 | -267 63 | 9 35 | 0.80 0.03 | 153 59 | 100 32 |
| LARS 08 | 522 85 | -240 55 | -442 70 | -225 53 | 0.98 0.07 | 410 65 | 240 4**From VLA 21 cm interferometry. The remaining figures are measured from GBT single-dish observations. |
| LARS 09 | 503 34 | 40 140 | -263 27 | 82 50 | 1.00 0.05 | 463 19 | 310 18**From VLA 21 cm interferometry. The remaining figures are measured from GBT single-dish observations. |
| LARS 10 | 484 51 | -27 187 | -287 38 | -3 49 | 1.03 0.08 | 446 27 | 280 140 |
| LARS 11 | 433 176 | -194 87 | -398 68 | -175 56 | 1.04 0.09 | 517 184 | 260 11 |
| LARS 12 | 503 56 | -3 43 | -289 54 | -21 37 | 0.82 0.03 | 375 26 | |
| LARS 13 | 484 43 | -105 22 | -359 36 | -85 105 | 0.76 0.04 | 373 52 | |
| LARS 14 | 485 122 | -226 65 | -461 110 | -336 66 | 0.40 0.05 | 129 59 |
| ID | ||||
|---|---|---|---|---|
| [Å] | [km s-1] | |||
| (1) | (2) | (3) | (4) | (5) |
| LARS 01 | 33.0 | 125 7 | 0.119 | 0.028 |
| LARS 02 | 81.7 | 150 7 | 0.521 | 0.093 |
| LARS 03 | 16.3 | 347 8 | 0.003 | 0.000 |
| LARS 04 | 0.00 | 443 7 | 0.000 | 0.003 |
| LARS 05 | 35.9 | 166 7 | 0.174 | 0.032 |
| LARS 06 | 0.00 | 0.000 | 0.000 | |
| LARS 07 | 40.9 | 178 7 | 0.100 | 0.037 |
| LARS 08 | 22.3 | 114 7 | 0.025 | 0.005 |
| LARS 09 | 3.31 | 0.007 | 0.000 | |
| LARS 10 | 8.90 | 0.026 | 0.000 | |
| LARS 11 | 7.38 | 0.036 | 0.000 | |
| LARS 12 | 8.49 | 415 8 | 0.009 | 0.006 |
| LARS 13 | 6.06 | 276 9 | 0.010 | 0.003 |
| LARS 14 | 39.4 | 254 8 | 0.163 | 0.119 |
Note. — Col. 2 shows global Ly equivalent width, Col. 3 shows (where present) the Ly peak velocity computed as described in Sect. 3.5, Col. 4 lists global, imaging-derived Ly escape fractions; Col. 5 lists fraction of intrinsic Ly emitted into the COS aperture. Values of Cols. 2 and 4 were first reported in Hayes et al. (2014).
4.1. Line profiles
4.1.1 Low-ionized state
LIS absorption profiles, as shown in Figure 4, show a variety of shapes, depths, complexity and blueshift compared to the nebular zero point. Line widths span almost a factor of two, with FWHM ranging from km s-1 as the lowest and km s-1 as the highest.
In most of the galaxies, all four Si ii profiles show almost identical shape and depth. There are exceptions; most notably, Si ii 1304 is somewhat shallower than the other transitions in LARS 01, 05, 07, 11, 12 and 13. Likewise, but less notably, Si ii 1260 in several cases dips below the other lines, especially in the blue wing, as seen most clearly in e.g. LARS 03, 04, 09 and 10. But considering the differences in transition strengths , which are up to a factor of ten, the lines have very similar shapes and depths, in some cases practically identical. This is usually a sign that the system is fully optically thick in all the involved transitions, with the cases in which there is residual emission at maximum absorption being due to partial covering. However, Prochaska et al. (2011) and Scarlata & Panagia (2015) have shown that this effect can in some cases be mimicked by the effect of scattered light re-emitted into the line of sight; see Section 5.
Yet other possible causes of residual intensity at line bottom exist. For one, the systems can be part transparent; but this usually will show stronger difference in line strengths for different transitions of the same species, depending on for each transition.
Residual emission can also be due to resolution effects. The COS aperture is centered on the strongest star-forming knot of each galaxy. As seen in Table 4 col. 2, these knots have an effective resolution quite close to the COS resolution of . But the less luminous parts of the galaxies generally give some emission across the aperture. Spatially extended emission within the aperture is more poorly resolved, and so emission from neighboring velocity ranges may bleed into line center and give a false impression of a perforated medium. Judging from the aperture maps, this could mainly be a concern for LARS 3, 4, 5, 8, 9, 11 and 12, and possibly 10. Of these, LARS 3, 4, 8, 9, 10 and 11 have no or almost no residual intensity at maximum absorption, in which cases this effect evidently is not strong enough to cause false impressions of a perforated medium. LARS 5 and 12 have quite flat profiles around line minimum, implying that this effect should be quite strong to account for the residual intensity at line center. The uncertainties caused by the effect of reemission in the absorption trough described above are likely to dominate over this one in these cases.
Looking at Figure 4, two other tendencies stand out. For one, Si ii 1304 is in some cases more shallow than the other lines. This is often, though not consistently, in conjunction with a generally larger spread in the depths of the Si ii profiles. This could possibly be of interest to the discussion of Section 5.4.
The other trend is the profile of C II 1334 generally having a tendency to be deeper than the other lines; in particular, there seems to be what could be a weaker, contaminating line in the red wing. This could possibly be due to the higher ionization potential of C II (see Table 3), meaning it could survive not only in the warm neutral medium but also in a warmer state, which could add to its absorption feature. This would affect the averaged profile by making it deeper in this velocity range than actually warranted by the strength of C II 1334. However, as is seen on the figure, the emission of O i* 1305, where present, tends to counteract this in the computation of the averaged profile, and in general, being one out of six lines included, it only has a slight impact on the averaged profile. One should however keep in mind that it could have a slight impact on quantities like , which would be artificially lowered by this, and on which could be slightly elevated. However, this is most likely negligible compared to the uncertainties due to measurements errors as listed in Table 4.
The line of Si ii 1304 often shows some blending in its red wing with the fluorescent emission companion at 1305 Å to the O i 1302 line. In most cases this only has a slight effect on the far red wing of the profile, but as seen in Figure 4, it could be responsible for the red wing discrepancies between the 1304 Å and the other Si ii lines in LARS 3, 4, 7 and 12.
4.1.2 High-ionized state
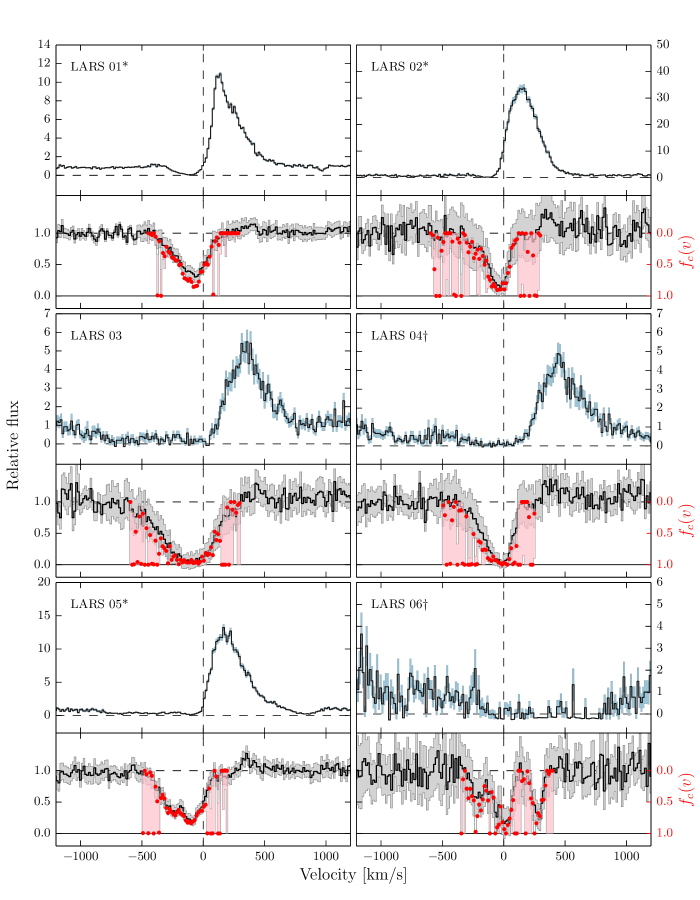
The averaged profile of the three Si iv lines found in our spectra (or the available subset hereof) was found for each galaxy and are shown in Figure 5 together with the stacked LIS profile. The majority of Si iv is expected to be found in gas from hot winds from the regions surrounding the starbursts, ramming into the neutral medium, which is heated and then gradually cools again, while driving the outflow (see e.g. Grimes et al., 2009; Strickland & Heckman, 2009). The Si iv profiles are therefore expected to more or less follow the morphology of the LIS profile, although with slightly higher outward velocity. Looking at the plots, this is evidently the case for many galaxies, like e.g. LARS 2, 4, 6, and 7; but the effect is less obviously present in others.
An in-depth analysis of the Si iv profiles is outside the scope of this work, but it is interesting to note that 1) The red wing of the LIS profile in LARS 9 is significantly deeper than the Si iv profile, and 2) that LARS 14 has a significantly deeper Si iv than LIS profile, which confirms that this galaxy is highly ionized.
The spectrum of LARS 11 has no available Si iv features, they all fell outside the detector range except which was coincident with geocoronal Ly.
4.2. Neutral gas covering
Neutral gas covering in narrow velocity ranges were computed for all 14 LARS galaxies based on the method described in Section 3.4. The results are visualized in Figures 8, 9 and 10, with black steps showing the averaged LIS profile and propagated one errorbands in shaded gray. Red dots indicate, on a reversed scale marked in red on the right, the computed neutral covering fractions for each velocity step. The pink shades show confidence levels of the covering fractions, cut off at zero and one as subzero and above-one fractions are unphysical.
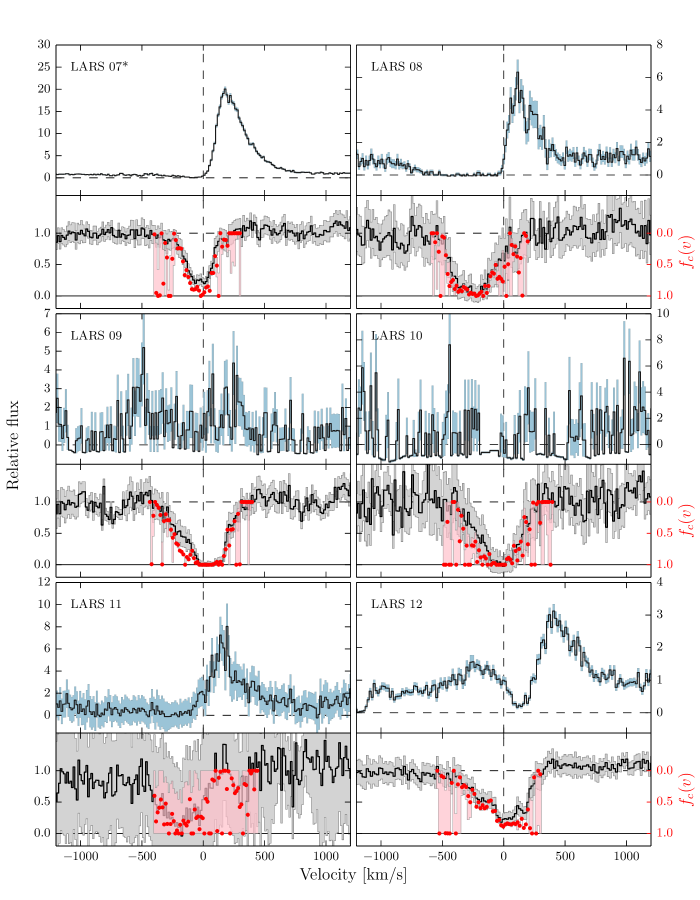
We find that while there is a certain scatter in the computed covering fractions, they generally coincide very well with of the averaged low ionized absorption profile. In some galaxies, there is a tendency for the covering fraction plots to dip a bit below the stacked profiles, especially in the velocity ranges close to maximum absorption. These ranges are generally coincident with ranges in which either the Si II transition profile lying visibly above the other lines, or the Si ii line profile lying significantly below the others. If these are due to polluting features or other systematics, this would cause the stacked profile to slightly misrepresent the actual physical system, and could also cause minor systematics in the fits for . This effect introduces uncertainties about the presence of residual emission at maximum absorption for LARS 7 only; in general the assumption of complete optical thickness seems well justified. We therefore from this point have adopted as a proxy for the velocity-binned covering fractions, and we shall report the maximum fractional depth of the profile as the maximum velocity-binned covering factor, (see e.g. Table 4).
About half of these stacked profiles are saturated in absorption, while the rest show some residual intensity. Eight of these galaxies: LARS 01, 02, 05, 06, 07, 12, 13 & 14, show residual intensity at maximum absorption. All the strong Ly emitters from (Hayes et al., 2014) - LARS 01, 02, 05, 07 and 14 - are found within this group.
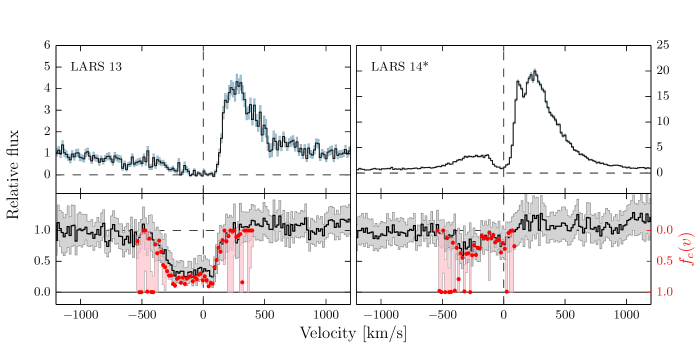
Three galaxies - LARS 6, 9 and 10 - show deep, damped Ly absorption features in the aperture. Their LIS lines have in common a relatively deep, static component of the neutral medium, as discussed in the introduction. This component is completely black at line center for LARS 9 and 10, but not for LARS 6. Interestingly, only LARS 6 is also a global absorber in Ly. This points at LARS 9 and 10 emitting the majority of their Ly in extended halos, consistent with what is visible in Figure 1. LARS 4, which is a global absorber, shows some weak emission in the aperture, although not enough to outweigh what is absorbed in the outer regions.
The average LIS profiles and the Ly profiles of LARS 6, 9 and 10 are shown for comparison in Figure 11. Especially LARS 9 and 10 show a quite striking contrast in width between the metal and the H i profiles.
4.3. Local and large scale Ly transfer
One major objective of this work is to compare detailed knowledge about conditions close to the hot, star-forming regions that give rise to the large majority of intrinsic Ly photons, obtained through SDSS and COS spectroscopy, with the strength and morphology of global Ly output, which is believed to depend strongly on these central conditions. However, an important requirement for this to bear any physical significance is that the conditions of these sight lines be representative of general conditions in the galaxies studied. As a test of this, we have computed the Ly flux emitted into the aperture as a fraction of the intrinsic Ly emission in the aperture, inferred from the above fluxes and H measured from SDSS spectroscopy (Östlin et al., 2014).
Radiative transfer of Ly is, due to its strong resonance, a global phenomenon for a galaxy. Photons interacting along the line of sight, seemingly absorbed, may escape the galaxy eventually, while photons originating from regions outside the aperture may scatter into it. We define the local emitted Lyman alpha fraction, as the Ly flux emitted into the aperture in units of the intrinsic Ly flux within the aperture; this is listed in Col. 5 of Table 5. This is not exactly an escape fraction, but the closest comparable quantity that can be meaningfully defined in a local region of a galaxy.
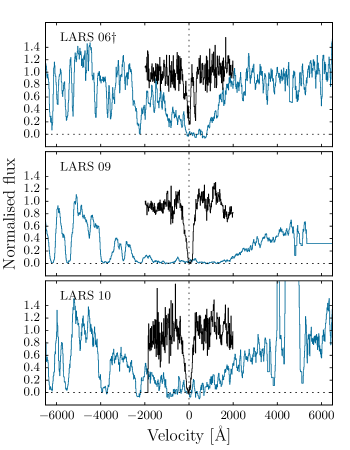
Figure 12 sees these locally emitted fractions plotted against the global Ly escape fractions from Hayes et al. (2014). The data show a clear correlation, with LARS 2 and 14 as a outliers, 14 lying just outside the 95% prediction band while LARS 2 is falling somewhere between the 68% and 95% curve (see discussion below). LARS 14 shows a noticeably stronger local emission relative to the global output than the remainder of the sample, while on the other hand LARS 2 has a stronger global and weaker local Ly output than usual. The full sample shows a Pearson- for these two quantities of . Evidently, the aperture regions are well representing the Ly RT conditions in the galaxies of the LARS sample. This also means that in all subsequent figures showing relations involving , the in-aperture version of the same would look essentially the same, except for LARS 2 and 14 which would have lower and higher local escape, respectively.
4.4. Importance of outflows
4.4.1 Lyman escape
Previous studies of nearby galaxies (Kunth et al., 1998; Wofford et al., 2013) conclude that an outflowing bulk motion of the neutral medium is necessary for Ly to escape: Kunth et al. (1998) analyzed observations of 8 galaxies and found velocity offsets of up to 200 km s-1 between O i/Si ii absorption lines and emission from the hot, ionized gas in the emitting galaxies, while galaxies with a (near-) static ISM showed deep, damped absorption features in Ly.
Our findings from the LARS sample are consistent with this picture (see Table 4). Like Wofford et al. (2013) we also stress, however, that other mechanisms must be in play; with a Pearson’s , there is no statistical correlation between and in general, and we do see cases of galaxies with outflowing winds and yet almost no emission in Ly, although no emission through a static medium is observed.
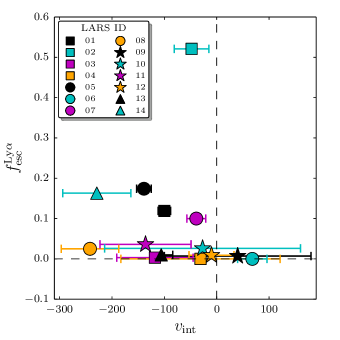
Outflowing winds must be present to allow for Ly escape, but as can be seen in Figure 13, it is not sufficient to guarantee this: LARS 03, 08, 11 and 13 show significant outflow velocities, but still very low Ly escape fractions. Evidently, other, competing effects must have significance.
4.4.2 Lyman alpha peak velocity
From current models of Ly radiative transfer (e.g. Verhamme et al., 2006), it is predicted that in an environment of a spherically symmetric outflowing medium of high H i column density, the emission feature will be dominated by a redshifted peak with a maximum around , a component which is backscattered on the far, inner, receding surface of the expanding shell, while the component emitted directly towards the aperture in these models is predicted to be largely suppressed while traversing the medium. According to these models, we would expect to see a correlation between outflow speed and Ly emission peak velocity.
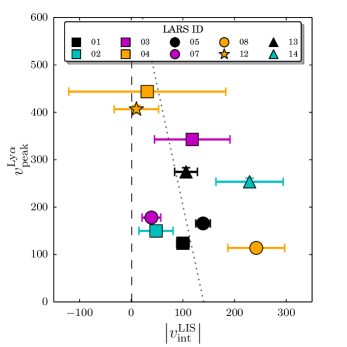
It is therefore a bit surprising that we find no such correlation in our sample. In Figure 14, these quantities are plotted against each other for the 10 spectra in LARS with Ly emission. In the figure is also shown, in dotted dark gray, the least squares regression line weighted by the uncertainties in . Uncertainties on are negligible in comparison and were not included in the fit.
The figure clearly shows that the expected correlation is not there. There is in fact a weak anticorrelation between these velocities; the direct opposite of the expected result, although with a Pearson- it is not a strong correlation and should be taken with a grain of salt. What we observe is more akin to the simpler model discussed in e.g. Mas-Hesse et al. (2003) of an emission feature overlaid by a multiplicative absorption profile.
4.5. Effect of on Ly escape fraction
One should be careful when interpreting the covering fractions presented in Sect. 3.4. The measured maximum velocity-binned covering fraction (see e.g. Fig. 7) constitutes only a lower limit to the total covering fraction (Jones et al., 2013): A system at velocity other than may cover a projected area with only partial or no overlap with the area covered by gas at . Such a system will add to the total covering fraction, increasing it beyond the minimum set by - unless, of course, is unity.
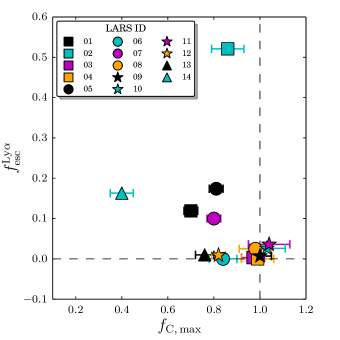
Figure 15 shows a plot of Ly escape fraction vs. maximum velocity-binned covering fraction as described above. A negative residual intensity is of course unphysical and would be interpreted as zero. It is immediately clear that at a covering fraction of 1, very little Ly radiation escapes. This physically corresponds to a full sheet of neutral gas screening off the emitting star clusters. All Ly emitters of the sample have .
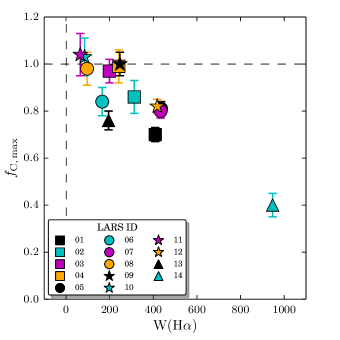
4.6. Star formation and perforation: a possible clue
One quite surprising finding of this work came from comparing Figure 15 to Figure 5 in Hayes et al. (2014), panel 3 in the lower row, comparing W(H) to . The similarity is quite striking, pointing at a possible relation between EW(H) and . Figure 16 shows that this is indeed the case, the two are - with all due reservations regarding sample size - strongly correlated. This is, to our knowledge, the first time such a correlation has been observed.
4.7. Interpretation
4.7.1 Kinematics and geometry
Our results suggest a picture of a neutral medium consisting of multiple dense clouds flowing predominantly outwards at a range of velocities, although also contributions redwards of line center are found in some of our sample galaxies. Considering the width and morphology of the line profiles, it seems clear that they consist of multiple contributions from separate subsystems which move outwards at a range of velocities and therefore must be physically disjoint. These clumps are generally optically thick near the centers of the Si ii lines, but each may only partially cover the starburst region and hence leave residual flux even at the central wavelength of the absorption line for each subsystem. Together, the absorption features will blend into one line of complicated morphology, as observed. At each velocity, a part of the starburst is covered by a completely opaque cloud, while others are unblocked.
Consider a toy system of two clouds which each cover 50% of the starburst. If these move at the same velocity, they will block all light shifted into the line center in that frame. If, however, they have a velocity difference large enough to completely deblend the line contributions, the resulting profile would show two separate dips in flux density down to 50%, while at least 50% of photons at any given wavelength would encounter no opacity at all when traversing the system.
The model is illustrated in Figure 17, which should be read as a radial beam cut out of a spherically symmetric system. The stars to the left signify the background sources, including the H ii regions in which the recombination lines like Ly are emitted. Next to these, optically thick clumps of the neutral medium are shown as gray disks, moving outwards at different velocities. FUV continuum shining through the clumps is shown as green arrows and Ly radiation is shown in blue, in accordance with the coloring scheme in Fig. 1. Fractions of the FUV pass through the clouds, which each leave saturated absorption features in parts of the light. If the difference in velocities surpasses the line widths of the individual systems, the absorption feature of each clump will fall at different wavelengths in the spectrum, and the line will show residual flux everywhere, even though it consists of overlapping, saturated clumps which combined cover the source completely. The three green absorption profiles shown in the middle are the line imprints left by the individual clumps, and the larger green profile in the upper right shows the resulting profile when the light from the three different projected regions is integrated over the aperture: the simple, saturated contributions of each clump can, even when the clumps are together fully covering the background source, add up to a quite complex line profile with residual flux everywhere. In the lower right, in blue, is shown a typical P Cygni-shaped Ly profile as it would often look from a system with unity combined covering fraction like this one.
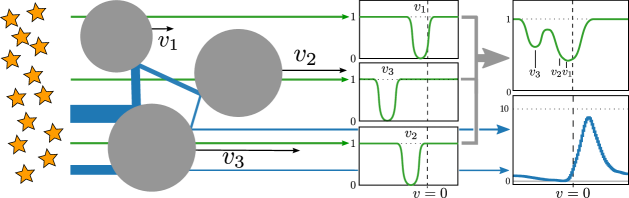
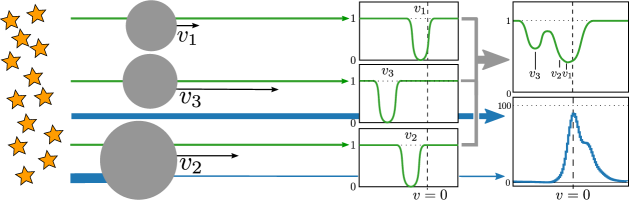
In Figure 18 we show for comparison a sketch of the “Picket Fence” model of Heckman et al. (2011). It is very similar to Figure 17, except the clumps are now only partly covering, leaving holes in the neutral medium allowing for direct escape of Ly and hence also LyC. The individual clumps still leave saturated absorption lines in parts of the FUV light, which add up to a more complex line profile with residual intensity everywhere. Here, the residual intensity is only in part due to the velocity offsets between the clumps, while a contribution comes directly through holes in the neutral medium. The combined metal absorption feature of such a system is difficult to distinguish from the one seen in the case above. The Ly feature will, however, have a nonzero flux in the line center and, depending on the size of the holes, maybe even be dominated by the narrow, undistorted component directly leaking through. We therefore argue that a well resolved Ly spectrum and precise systemic velocity zero points are necessary in order to distinguish between these two similar, but not identical cases.
4.7.2 ISM evolution
By combining column 9 in Table 1 of Hayes et al. (2014) with columns 5 and 11 in Table 2 in same, we find that is well correlated with SSFR with a Pearson-, so that is a good proxy for specific star formation. This suggests that star formation feedback could be driving the fragmentation and perforation of the neutral medium; rather than uniformly pushing the LIS medium outward, the feedback would cause growing Rayleigh-Taylor instabilities in the outflowing medium, which would fragment into clumps of different sizes and velocities (Mac Low et al., 1989; Tenorio-Tagle et al., 1999).
This we propose to be a final stage of an evolution similar in nature to and inspired by the one presented in Tenorio-Tagle et al. (1999) and elaborated by Mas-Hesse et al. (2003). In this picture, initially, a starburst is enclosed in a uniform H i halo. As star formation proceeds, SN feedback causes the H i halo to expand, although unlike in the scenario of Tenorio-Tagle, not perfectly uniformly. Growing density and temperature perturbations in the neutral gas shell cause Rayleigh-Taylor instabilities to arise in the expanding shell, which in time breaks up into clumps of varying velocities, embedded in a matrix of ionized gas. These clumps, in the LARS galaxies, have a projected covering fraction of unity (but of course in general need not to), thus blocking all ionizing radiation; but compared to Tenorio-Tagle’s expanding shell scenario, the overlapping clumps will allow for larger Ly escape, and higher dust content and metal column density in the warm neutral medium could still yield some residual intensity in the metal absorption lines, as described in e.g. Figure 17. Higher SSFR and thus W(H) will tend to push and perforate the neutral gas cover, while larger masses of H i will tend to suppress this.
5. Discussion
5.1. Comparison to 21 cm radio observations
A set of properties of the neutral medium of the LARS galaxies measured by single-dish and interferometric 21 cm-band observations are presented in Pardy et al. (2014). We shall now briefly compare this global description of the neutral medium to our own description of the local properties along the sight lines to the most luminous star-forming knots.
The most directly comparable quantities are the line width of the neutral medium as measured directly, but globally, from 21 cm observations of atomic hydrogen, and as inferred by using the low-ionization metal lines as a proxy. The numbers are shown in Table 4, which in column 8, FWHM, shows the line widths as measured from the metal lines, and in column 9, FWHM, shows the values from Pardy et al. (2014), in which FWHM is reported as .
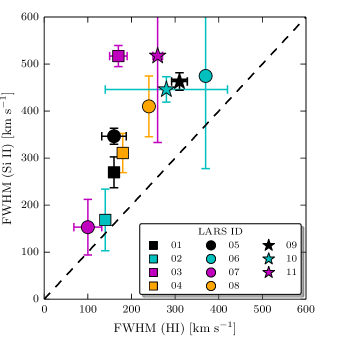
The 21 cm measurements, which include large amounts of cool gas in the interstellar and circumgalactic medium, show significantly lower line widths than the COS measurements, which only target the neutral medium along the sight lines towards the brightest and hence most energetic star-forming knot in each galaxy. While there is no one-to-one relation, it is evident from Figure 19 that there is a strong correlation: greater metal line widths within the aperture are also indicative of greater global line widths in H i. The 21 cm feature is dominated by the cool phase ISM, and its line width by large-scale motion like e.g. rotation. In contrast, the LIS lines are dominated by gas in the warm neutral medium in the central regions of our galaxies, which is heated and pushed by star formation feedback. It is therefore not surprising that the 21 cm lines are narrower than the LIS lines; on the other hand, given that the 21 cm lines are global and the LIS lines such a local phenomenon, it is interesting and a bit surprising to see them correlate so well.
5.2. Factors governing Lyman alpha escape
It has been established both theoretically (Neufeld, 1990; Verhamme et al., 2006) and observationally (e.g. Kunth et al., 1998; Mas-Hesse et al., 2003; Wofford et al., 2013) that outflows play an important role in regulating Ly escape, with outflowing gas being Doppler shifted out of resonance with the Ly photons emanating from the center as the main mechanism. It is still not clear, however, exactly how important this role is.
A number of surveys have consistently shown that stronger outflow velocities are correlated with higher Ly escape fractions. Kunth et al. (1998) observed a sample of 8 galaxies in the local Universe and concluded that gas kinematics, rather than dust content, is the dominant factor governing Ly escape. A similar conclusion is reached by Mas-Hesse et al. (2003) from a subsample of the galaxies from Kunth et al. (1998), expands upon these results and proposes a unifying scenario of expanding superbubbles as explanation for the different profiles observed. In Wofford et al. (2013), a similar conclusion about the role of outflows is reached from a considerably larger sample of local star-forming galaxies, with better data.
Our findings are consistent with outflows being of key importance, although we observe this relation as an upper envelope rather than a correlation: while stronger outflow velocity allows for a higher Ly escape fraction, we do observe galaxies (LARS 3, 8, 11, and 13) with high wind velocities and yet very low Ly escape fractions. These galaxies have in-aperture dust contents in the upper half of the sample, which in its entirety has spanning from for LARS 6 to for LARS 3 (Östlin et al., 2014). In addition, their ISM span wide ranges in velocity, further making it harder for Ly photons to be shifted out of resonance wavelengths.
Furthermore, as is discussed in Section 4.7, we suggest that the importance of the outflowing wind lies, not only in shifting Ly photons out of resonance, but also in creating the Raleigh-Taylor instabilities that introduce some clumpiness and porosity which will carve out escape routes for Ly photons through the neutral medium. We stress again that some fragmentation of the medium is sufficient for this to happen, no direct sight lines to the background sources are necessary and are indeed not likely to be present in our sample, with a possible exception in LARS 14.
For Ly photons to escape from a galaxy, they must traverse the neutral medium, undergo a number of scatterings, for each of which it suffers an increased chance of absorption in the meeting with a cosmic dust grain. In a medium of zero net velocity but an internal velocity distribution wider than the intrinsic line width of the Ly line and with a non-zero dust content, any photons will undergo a large number of scatterings and a resulting increase in path length to travel out of the system. Increased path length means increased optical depth due to dust and thus a higher probability of absorption of the photon. It is practically impossible for radiation to escape such a system (Neufeld, 1990).
A number of factors can drastically lower the absorption probability and thus raise the escape probability for a Ly photon:
- H i Mass
-
The mass of neutral gas in the system governs how many times a photon is likely to scatter and therefore has a strong impact on escape probability. Lower mass may significantly raise the escape fraction of intrinsic Ly.
- Neutral gas outflow
-
A bulk outflow of neutral gas will Doppler shift the atomic hydrogen out of resonance with the intrinsic Ly, moving the redder parts of the line out of resonance, from where it is free to escape.
- Velocity range
-
A higher internal velocity range causes the hydrogen absorption profile to broaden, requiring a larger (Doppler) redshift of the intrinsic Ly photons to grant them easy escape. Correspondingly, a lower velocity range will make it more likely for a photon to be redshifted sufficiently to escape afterwards, raising the escape fraction.
- Dust content
-
Interactions with dust grains is what destroys Ly photons, so it is no surprise that higher dust content will result in lower escape fraction, as is the case for any other optical and UV photons.
- ISM perforation
-
As mentioned in Section 4.7, galaxies in LARS with any Ly escape are all drawn from the part of the sample that have a maximum velocity-binned covering fraction . This value depends strongly on the bin width. For a bin width less than or equal to the resolution of the spectrograph, bin width should not affect velocity-binned covering fraction, but for larger bin widths, covering fraction will grow monotonically with bin width as more velocities will be allowed to contribute to each bin.
The interplay between these competing effects can be intricate and unpredictable. In Figure 13, one can see LARS 2 far above and LARS 3, 8, 11 and 13 falling far below what would otherwise have been a neat correlation between outflow velocity and global Ly escape fraction as predicted by e.g. Kunth et al. (1998) and concluded in Wofford et al. (2013). LARS 3, 8, 11 and 13 have the highest in-aperture dust contents of the sample (Östlin et al., 2014, table 3). LARS 2, on the other hand, has the third lowest dust content in the sample, only surpassed by LARS 5 and LARS 6. LARS 5 has a fairly high Ly escape fraction despite a high velocity range; the low dust content and high outflow velocity help counter this. The medium of LARS 6 has a strong static component, paired with the highest line width of the sample. These conspire, despite the low dust content, to yield a very low escape fraction. LARS 2 , on the other hand, shows the lowest of the sample. So for LARS 2, despite low outflow velocity, dust content and low velocity range conspire to aid in a larger Ly escape fraction, while for LARS 3, 8, 11 and 13, the relatively high wind velocities are counteracted by a combination of high dust content and relatively high line widths to impede Ly escape. These factors are certainly not the only ones to govern Ly escape, but they serve to illustrate that the problem is multi-faceted.
5.3. LyC leakage
The analysis of ISM covering and column density is interesting also for the question of Lyman Continuum escape, which is important to solve the question of which sources were responsible for reionizing the Universe. In the local Universe, almost no leaking galaxies are observed, and the ones that are detected show very low escape fractions. Yet we know that around the time of reionization, the ionizing escape fraction must have been (Robertson et al., 2013).
Heckman et al. (2011) analyzed a sample of 11 LBG analogs as possible leakers of Lyman Continuum radiation. They considered two different cases; one in which the UV sources are covered by a uniform shell with unit covering factor, and one in which they are covered by a number of optically thick clumps with openings between them. In the first model, any residual flux in the line would be the result of an optically thin medium. Since the optical depth at Lyman Continuum is significantly larger than in the metal lines included in their analysis, such a residual flux would be necessary but not sufficient for allowing escape of ionizing photons.
The second model they consider is the so called “picket fence model”, in which the residual flux is interpreted as the result of a medium consisting of optically thick clouds only partly covering the background source. In a different implementation of the Apparent Optical Depth method, they utilize the Si ii lines present in the COS spectra to determine which of these two cases is the more realistic. They conclude that where residual intensity is present in their spectra, the relative optical depths show that the picket fence model is the more plausible, and thus conclude that galaxies in which this residual intensity is found are likely candidates for LyC escape. They point out that these objects all show anomalously low H emission, another pointer that ionizing radiation is escaping. We note here that the latter finding seems to be in contradiction to the result of this work: that a lower is quite strongly correlated with a higher H equivalent width. However, this might be a selection effect, as the two samples are selected from different criteria. Observation of a local example of a galaxy with a Picket Fence type ISM was recently confirmed by Borthakur et al. (2014).
Jones et al. (2013) also find that their galaxies, this time at redshifts 3 and 4, generally show residual flux in the lines, but they are more cautious concluding that this implies any direct lines of sight (and thus escape) through the medium. They note as a caveat that line widths are in general much higher than the typical internal velocity dispersion of the gas, meaning that the line is a conglomerate of contributions from many separate subsystems. These systems do not in general occupy the same (projected) space, and thus a low measured covering fraction is still consistent with unit covering integrated across the line profile. However, a lower would raise the probability of the medium being perforated to some degree, and they point out that generally, their galaxies at show lower covering than at . Adding the fact that LyC escape is extremely rare in the local Universe and at low and extrapolating, this means that LyC escape could be even more common earlier and thus allow galaxies to be the main source of reionization of the early Universe.
The high resolution of the COS spectra and the accurate systemic velocity zero points of LARS allow for thorough analysis and modeling of the Ly line profile morphology (I. Orlitova et al., in prep.) Visual inspection of the LARS Ly profiles shows that, with the possible exception in LARS 2 and LARS 14 discussed above, we generally see no signs that lower covering factors coincide with emission at line center in Ly which is the signature of direct Ly and LyC escape (e.g. Verhamme et al., 2014). We should mention that the optical depth in Ly is higher than in LyC, so in cases where Ly is quenched by an attenuated interclump medium, this could possibly still be penetrated by LyC. Only LARS 14 shows any signatures of column densities that could possibly be low enough for this to happen, and that shows no signs of LyC escape as inferred from the Ly profile and the analysis of Heckman et al. (2011).
5.4. Scattered re-emission
One possible caveat to our results is radiative transfer effects in the metal lines of the neutral medium, in which light is reemitted into the absorption trough of the Si ii lines, as described by e.g. Prochaska et al. (2011) and Scarlata & Panagia (2015). The former work shows a more general model of how this effect can work, while the latter concerns itself more specifically with the Si ii lines within the COS spectral range.
In short, photons that are absorbed in the Si ii lines will be reemitted in random directions, meaning that there is a probability that a photon will be scattered back in to the aperture of the spectrograph, partly filling up the absorption trough. Prochaska et al. (2011) showed that this effect can in certain circumstances cause a partially transparent, fully covering system to appear as an optically thick, partly covering system by causing transitions of a given species with different line strengths to appear as having equal depth. Among factors that could inhibit this effect they list a) the aperture covering only a small fraction of the neutral medium of a galaxy, causing most of the reemission to be blocked by the aperture, or b) the presence of fine structure splitting of the ground state of the given transition. In the latter case, an absorbing electron can decay into the short lived upper fine-structure level of the ground state, at a wavelength slightly higher than the absorbing transition, to immediately after decay into the lower fine structure level by emitting an IR photon. The short life time of the upper fine structure layer ensures that no absorption happens at this wavelength, allowing a photon at this wavelength to leave the system without further atomic scattering events.
The strength of the latter effect is difficult to estimate, as it depends strongly on the typical number of scatterings a photon undergoes before escaping; for each scattering, there is a fixed fractional probability of reemission into the fluorescent channel, and the typical number of scatterings is not well known, and could well depend strongly on e.g. geometry and kinematics in the system.
Scarlata & Panagia (2015) show in more detail how this affects the Si ii lines specifically. While the effect predicted in this work is more modest than the ones predicted in Prochaska’s model, they do show that it is possible with an isotropic and fully covering outflow model to reproduce a stacked UV COS spectrum of 25 Ly emitters, which appears to have the characteristic Si ii absorption signatures of an optically thick, partly covering system. The Si ii transitions involved here arise from a fine structure split ground state, allowing a fraction unique for each transition to escape through the fluorescent channel. Given the assumptions in their paper, this provides a direct way to estimate the strength of the refilling. The resonant and fluorescent emission happens in the same regions and under the same physical conditions, and at a fixed ratio per scattering event. Thus, if no fluorescent emission is present, neither will any significant resonant emission be. If fluorescent emission is present, although there is no noticeable absorption in the resonant channel, this can indicate that a denser neutral clump is present inside the aperture, but off the LOS. In Jaskot & Oey (2014) is an interesting discussion of how this emission, in concert with the Ly line shape, can reveal information about the geometry of an object, in that the presence of such fluorescent emission combined with the absence of any significant absorption in the accompanying resonant line, reveals the presence of significant amounts of scattering neutral gas inside the aperture but off the LOS. Strong absorption but weak or absent fluorescent emission reveals that scattering is present, but happening mostly outside of the aperture. The presence of both absorption and fluorescent emission shows that absorbing gas is present, and most of the absorbing neutral gas is found inside the aperture. Strength and width of the Ly profile can show additional information about the LOS column density of neutral hydrogen.
The suppression of the refilling effect due to small aperture would be strong for some LARS galaxies, but not for all; and Scarlata & Panagia (2015) show that even with a reasonably placed and sized slit, the effect could still be strong enough to emulate a system of opaque clumps. The strength of suppression by escape through the fluorescent channel would depend strongly on how many scattering events one photon would on average undergo before escaping the system, which is not known. Furthermore, it is unknown how strongly these effects depend on the assumption of spherical symmetry and Sobolev approximation and how they would react to e.g. an anisotropic, clumpy medium.
One way to possibly assess how strong this effect would be is by looking at the blue wing of the absorption features in question. The four Si ii transitions in question span more than a factor of 10 in line strength; if they line up neatly even at wavelengths where reemission is expected to be weak, this would suggest that the absorbing systems truly are optically thick and only partially covering. Since reemission in the fluorescent channel happens from the same atoms as resonant reemission, the fluorescent lines could possibly be used to constrain whether resonant reemission would happen in the full width of the absorption feature and hence whether the blue line wing is clear of this self-contamination. Preliminary measurements on the LARS galaxies suggest that the blue wings of our absorption profiles are not behaving differently from other parts of the absorption features.
At the current time, however, more research is needed before we know how strong an effect, if any, this has on the line shape and the interpretation of metal absorption lines; so at present, we shall just mention this as a possible caveat.
6. Summary & Conclusions
Based on high resolution UV spectra obtained with the Cosmic Origins Spectrograph on the Hubble Space Telescope, we have analyzed Si ii absorption features originating in the neutral interstellar medium along the LOS to the strongest star-forming region of each of the galaxies in the Lyman Alpha Reference Sample. From these lines, we have computed kinematic properties and velocity-binned covering fractions of the medium and compared these quantities with global properties of the galaxies presented in Hayes et al. (2014), Östlin et al. (2014) and Pardy et al. (2014).
We find the following:
-
1.
Ly escape depends on several factors, including outflowing medium, dust content and line width. Outflows are, in our sample, a necessary but not sufficient condition for Ly escape. The conditions found to allow Ly escape are generally believed to be markers of young age.
-
2.
Of 14 galaxies, 9 show significant outflowing winds, one galaxy shows a generally infalling wind to more than one sigma, and four are consistent with a static medium. The latter show the highest uncertainties in outflow velocity. All galaxies with global escape fraction or local emitted fraction have outflowing winds.
-
3.
Ly happens in sample galaxies with a neutral gas outflow velocity of , consistent with the findings of e.g. Wofford et al. (2013) and Mas-Hesse et al. (2003). In the sample, we observe absorption-averaged wind velocities ranging from 68 to -250 km , with blue wings reaching up to a maximum of -450 km .
-
4.
Ly peak velocities for emitters in our sample do not correlate with the outflow speed of the wind as would otherwise be expected from back scattering models; in fact, we found a weak anticorrelation between the two. This stands in contrast to what was expected from backscattering models, but is consistent with the simpler model of an emission profile multiplied by an absorption feature, as seen in e.g. Mas-Hesse et al. (2003).
-
5.
Full Width at Half Maximum (FWHM) of the averaged, neutral metal lines correlates well with FWHM of H i as measured in 21 cm at GBT or VLA as reported in Pardy et al. (2014), although the correlation is best for the galaxies with lower FWHM, suggesting that the galaxies of the sample with a neutral medium spanning larger velocity ranges also are less well-ordered and predictable.
-
6.
Very little or no Ly escapes from galaxies with a maximum velocity-binned covering fraction of , although the total covering fraction is consistent with unity for all sample galaxies. Thus, a certain minimum of porosity seems to be necessary to allow Ly escape.
-
7.
Global Ly escape is observed to be well correlated with, and on average around 3 times higher than, the fraction of intrinsic Ly emitted within the aperture.
-
8.
A strong anticorrelation is found between global H EW and maximum velocity-binned covering fraction, suggesting that feedback from strong star formation helps fragmenting and perforating the neutral, probably expanding, medium.
-
9.
We suggest an explanatory model building on that proposed by Tenorio-Tagle et al. (1999) and elaborated by Mas-Hesse et al. (2003), in which feedback from central star-forming regions results in Raleigh-Taylor instabilities at the border region between the hot bubble and the neutral phase. These instabilities result in a clumpy neutral medium with hot, largely empty passageways through which Ly radiation can pass with significantly fewer interactions with dust grains than would be the case for a uniform H i screen or spherical shell, resulting in a higher escape probability for each Ly photon.
7. Acknowledgments
We thank the anonymous referee for a helpful suggestions leading to an improvement in the quality of this paper. We thank Tucker A. Jones, Claudia Scarlata and Aida Wofford for helpful advise and useful discussions. DK is funded by the Centre National d’Études Spatiales (CNES). HA is supported by the European Research Council (ERC) advanced grant “Light on the Dark” (LIDA) and the Centre National d’Etudes Spatiales (CNES). HOF was funded by a postdoctoral UNAM grant and is currently granted by a Cátedra CONACyT para Jóvenes Investigadores. IO was supported by the grant GACR 14-20666P of Czech Science Foundation and the long-term institutional grant RVO:67985815. MH acknowledges the support of the Swedish Research Council, Vetenskapsrådet, and the Swedish National Space Board (SNSB). PL acknowledges support from the ERC-StG grant EGGS-278202. Dark Cosmology Centre is funded by DNRF. We acknowledge the value of high-quality scientific software made freely available by a large community of scientists and engineers. Specifically, This project has made extensive use of the Python-based packages Numpy (Walt et al., 2011), SciPy (Jones et al., 2001–), Matplotlib (Hunter, 2007), Pandas (McKinney, 2010), Statsmodels (Seabold & Perktold, 2010), and others.
References
- Atek et al. (2009) Atek, H., Kunth, D., Schaerer, D., et al. 2009, A&A, 506, L1
- Borthakur et al. (2014) Borthakur, S., Heckman, T. M., Leitherer, C., & Overzier, R. A. 2014, Science, 346, 216
- Cardamone et al. (2009) Cardamone, C., Schawinski, K., Sarzi, M., et al. 2009, MNRAS, 399, 1191
- Dijkstra (2014) Dijkstra, M. 2014, Lyman Alpha Emitting Galaxies as a Probe of Reionization, arXiv:1406.7292
- Dijkstra et al. (2006) Dijkstra, M., Haiman, Z., & Spaans, M. 2006, ApJ, 649, 14
- Duval et al. (2014) Duval, F., Schaerer, D., Östlin, G., & Laursen, P. 2014, A&A, 562, A52
- Erb et al. (2012) Erb, D. K., Quider, A. M., Henry, A. L., & Martin, C. L. 2012, ApJ, 759, 26
- France et al. (2010) France, K., Nell, N., Green, J. C., & Leitherer, C. 2010, ApJ, 722, L80
- Goudfrooij et al. (2010) Goudfrooij, P., Burgh, E., Aloisi, A., Hartig, G., & Penton, S. 2010, SMOV: COS NUV Imaging Performance, Tech. rep.
- Grimes et al. (2009) Grimes, J. P., Heckman, T., Aloisi, A., et al. 2009, ApJS, 181, 272
- Hayes et al. (2013) Hayes, M., Östlin, G., Schaerer, D., et al. 2013, ApJ, 765, L27
- Hayes et al. (2014) Hayes, M., Östlin, G., Duval, F., et al. 2014, ApJ, 782, 6
- Heckman et al. (2011) Heckman, T. M., Borthakur, S., Overzier, R., et al. 2011, ApJ, 730, 5
- Holland et al. (2014) Holland, S. T., et al. 2014, Cosmic Origins Spectrograph Instrument Handbook, Baltimore: STScI
- Hunter (2007) Hunter, J. 2007, Computing in Science Engineering, 9, 90
- James et al. (2014) James, B. L., Aloisi, A., Heckman, T., Sohn, S. T., & Wolfe, M. A. 2014, ApJ, 795, 109
- Jaskot & Oey (2013) Jaskot, A. E., & Oey, M. S. 2013, ApJ, 766, 91
- Jaskot & Oey (2014) —. 2014, ArXiv e-prints, arXiv:1406.4413
- Jones et al. (2001–) Jones, E., Oliphant, T., Peterson, P., et al. 2001–, SciPy: Open source scientific tools for Python, [Online; accessed 2014-11-25]
- Jones et al. (2013) Jones, T. A., Ellis, R. S., Schenker, M. A., & Stark, D. P. 2013, ApJ, 779, 52
- Kunth et al. (1998) Kunth, D., Mas-Hesse, J. M., Terlevich, E., et al. 1998, A&A, 334, 11
- Laursen et al. (2013) Laursen, P., Duval, F., & Östlin, G. 2013, ApJ, 766, 124
- Laursen et al. (2009) Laursen, P., Sommer-Larsen, J., & Andersen, A. C. 2009, ApJ, 704, 1640
- Mac Low et al. (1989) Mac Low, M.-M., McCray, R., & Norman, M. L. 1989, ApJ, 337, 141
- Mas-Hesse et al. (2003) Mas-Hesse, J. M., Kunth, D., Tenorio-Tagle, G., et al. 2003, ApJ, 598, 858
- McKinney (2010) McKinney, W. 2010, in Proceedings of the 9th Python in Science Conference, ed. S. van der Walt & J. Millman, 51 – 56
- Nakajima & Ouchi (2014) Nakajima, K., & Ouchi, M. 2014, MNRAS, 442, 900
- Neufeld (1990) Neufeld, D. A. 1990, ApJ, 350, 216
- Neufeld (1991) —. 1991, ApJ, 370, L85
- Östlin et al. (2009) Östlin, G., Hayes, M., Kunth, D., et al. 2009, AJ, 138, 923
- Östlin et al. (2014) Östlin, G., Hayes, M., Duval, F., et al. 2014, ApJ
- Pardy et al. (2014) Pardy, S. A., Cannon, J. M., Östlin, G., et al. 2014, ApJ, 794, 101
- Pettini et al. (2002) Pettini, M., Rix, S. A., Steidel, C. C., et al. 2002, ApJ, 569, 742
- Prochaska et al. (2011) Prochaska, J. X., Kasen, D., & Rubin, K. 2011, ApJ, 734, 24
- Quider et al. (2009) Quider, A. M., Pettini, M., Shapley, A. E., & Steidel, C. C. 2009, MNRAS, 398, 1263
- Robertson et al. (2013) Robertson, B. E., Furlanetto, S. R., Schneider, E., et al. 2013, ApJ, 768, 71
- Sandberg et al. (2013) Sandberg, A., Östlin, G., Hayes, M., et al. 2013, A&A, 552, A95
- Savage & Sembach (1991) Savage, B. D., & Sembach, K. R. 1991, ApJ, 379, 245
- Scarlata & Panagia (2015) Scarlata, C., & Panagia, N. 2015, ArXiv e-prints, arXiv:1501.07282
- Seabold & Perktold (2010) Seabold, J., & Perktold, J. 2010, in Proceedings of the 9th Python in Science Conference
- Shapley et al. (2003) Shapley, A. E., Steidel, C. C., Pettini, M., & Adelberger, K. L. 2003, ApJ, 588, 65
- Spitzer (1978) Spitzer, L. 1978, Physical processes in the interstellar medium
- Steidel et al. (2011) Steidel, C. C., Bogosavljević, M., Shapley, A. E., et al. 2011, ApJ, 736, 160
- Strickland & Heckman (2009) Strickland, D. K., & Heckman, T. M. 2009, ApJ, 697, 2030
- Tenorio-Tagle et al. (1999) Tenorio-Tagle, G., Silich, S. A., Kunth, D., Terlevich, E., & Terlevich, R. 1999, MNRAS, 309, 332
- Verhamme et al. (2014) Verhamme, A., Orlitova, I., Schaerer, D., & Hayes, M. 2014, ArXiv e-prints, arXiv:1404.2958
- Verhamme et al. (2006) Verhamme, A., Schaerer, D., & Maselli, A. 2006, A&A, 460, 397
- Walt et al. (2011) Walt, S. v. d., Colbert, S. C., & Varoquaux, G. 2011, Computing in Science & Engineering, 13, 22
- Wofford et al. (2013) Wofford, A., Leitherer, C., & Salzer, J. 2013, ApJ, 765, 118
Appendix A Discussion of individual targets
A.1. LARS 1
LARS 1 is one of the five strong global emitters in the sample, “strong” being defined by an integrated (see Hayes et al., 2014). All four Si ii line profiles fall inside the detector ranges and do not seem to be polluted by other features. The strength of the absorption differs somewhat, especially for , which has the lowest resonator strength of them all, indicating that this system might not be completely optically thick. Nonetheless, as can be seen from Figure 4, the fitted covering fractions are still close to the absorbed fraction, indicating that complete optical thickness is still a good approximation.
The profiles of the lines at 1193, 1304 show smaller secondary spikes on the red side. The spike redwards of Si ii 1193 is emission in the fluorescent Si ii* 1194 line, which shares the upper energy level with Si ii 1190.
LARS 1 shows strong Lyman emission in a classic P Cygni profile, the absorption part of which coincides neatly with the metal absorption feature, confirming that we are tracing the same gas. While the computed from the metal absorption lines shows a covering for all velocities across the line feature, the Ly feature shows no sign of direct sight lines to the H ii regions.
A.2. LARS 2
LARS 2 is another strong global Ly emitter which also locally shows a strong emission profile in the COS aperture. Like LARS 1, it shows a classic P Cygni-like emission profile in Ly, the absorption part of which coincides neatly in velocities with the averaged metal line absorption profile.
The silicon absorption lines reveal a relatively narrow profile only slightly blueshifted from the systemic velocity. The four Si ii transitions line up very consistently around what resembles a symmetric Gaussian absorption feature with a shallow, secondary feature on the blue side, which is somewhat deeper for the 1260 transition. A quite strong fluorescent emission is present in these lines and in O i.
LARS 2 is peculiar because of its very high () global Ly escape fraction, more than twice that of nearest competitor, the Green Pea type galaxy LARS 14. This despite a high inferred metal line covering fraction and low outflow velocity; factors which are normally quenching Ly escape. The galaxy does however have low dust content and a narrow velocity range of the neutral medium, both of which ease the escape of Ly.
It is interesting to note that the minimum of the absorption in the Ly profile falls bluewards of line center, leaving a significant emission at systemic velocity. This could possibly be a directly escaping, non-scattered component finding its way through a hole in the medium. Such a contribution would only make up a minor fraction of the total escaping Ly, which generally shows the redshifts typical of having undergone radiative transfer, and thus not answer the puzzle of how such a large global escape fraction can co-exist with such a large local covering factor.
A.3. LARS 3
LARS 3 is a weak Ly emitter, both globally and in the aperture. The Ly line shows a weak P Cygni profile with a relatively broad blue absorption component, suggesting high H i column density.
All the Si ii transitions exhibit a deep, broad absorption profile, almost or completely saturated. The averaged profile is the widest in the sample, apart from LARS 6, centered at km s-1 but with significant absorption out to km s-1 on the blue side and km s-1 on the red side. The strong red wing means that the O I* fluorescent line stands out more conspicuously than on most other galaxies, giving rise to the large uncertainties on in the red wing shown in Figure 8, panel 3, as well as artificially slightly raising the residual intensity in the red wing of the averaged profile. The latter effect is counteracted by the C II line being deeper than the rest in the same velocity range.
A similar uncertainty is seen in the blue wing, probably due to the line being somewhat deeper than the others here. The reason for this is not known, as it follows the other lines very well at line center and redwards. The effect of this on the averaged profile is likely modest, since the 5 other lines all line up quite well in this velocity range, but it could possibly give rise to the large uncertainties in in the blue wing of the line. The 1260 line being deeper in the blue wing is a tendency which can also be seen in LARS 4, 9, 10, 12, 14 and less markedly so in LARS 8, leading to believe this could be contamination from an unidentified line at .
A.4. LARS 4
LARS 4 is one of the two global Ly absorbers of the sample. In the COS aperture, it shows weak but distinct emission, but even in-aperture, Ly absorption outweighs this. The line shape is very similar to the one of LARS 3, although the blue absorption component is narrower.
The averaged LIS metal line is likewise significantly narrower than that of LARS 3, but like LARS 3 completely black at line center for all Si ii lines except at , which does show a bit of residual intensity in the line center of LARS 4. This can partly be because this line, having the smallest oscillator strength, is not completely opaque, but at least part of it is likely to be due to emission in O i* - fluorescent emission is unusually strong in this spectrum, also for Si ii* 1194. Along with the 1190+93 doublet, both C II 1334 , and O i 1302 are black at line center and follow the profile of the Si ii doublet well. Si ii 1260 again follows nicely in the red wing, but is somewhat deeper in the blue wing. This could be the reason for the discrepancy between the profile and the average line profile in the blue wing; an artificially lowered residual flux for Si ii 1260 will mean a higher inferred covering fraction due to its high value of while having little effect on the inferred column density. At the same time, only four lines are included in the computations, while six are included in the average absorption profile, lending weaker significance to one outlier.
A.5. LARS 5
The average LIS metal profile of LARS 5 is broad, but relatively shallow, and shows a notable pair of minima at km s-1 and km s-1, probably representing at least two distinct subsystems.
Si ii is markedly shallower than the rest of the lines, possibly indicating that the medium is not completely opaque at this wavelength. However, the best fits at line center still agree very well with the hypothesis of full opacity and part covering, and the profile coincides remarkably well with the average line profile. Fluorescent emission at is present but is the weakest of the galaxies so far mentioned. LARS 5 is analyzed in depth in F. Duval et al. (in prep).
A.6. LARS 6
This is the second of the two global Ly absorbers, and locally in the aperture it shows a strong, damped absorption profile.
The metal absorption profile is the most complex of the LARS galaxies. It consists of three narrow components, one infalling at km s-1, one outflowing at km s-1, and one static. The static component is the strongest in metal absorption, but the Ly absorption profile seems to be centered around the infalling component.
The outflowing component is interesting as the depths of the 1190+1193 doublet suggests that this component is optically thin. The transition at 1304 follows the shape of the 1190+1193 doublet very well, but is significantly deeper than both of these, which is unexpected, considering that 1304 is by far the weaker of the three lines. This is due to to the center of the infalling component of the neighboring O i 1302 transition coinciding with the line center of the blue component of Si ii 1304, so that while looking like a single Gaussian absorption profile, it is actually the sum of two lines.
Pardy et al. (2014) show that LARS 6 is in fact interaction with another, neighboring system. One possible explanation for the double-dip absorption profile could be that one of the dips actually comes from a tidal tail of gas from this interacting system extending into the aperture.
A.7. LARS 7
LARS 7 is another one of the strong global Ly emitters and also shows relatively strong emission within the COS aperture. The emission profile is of P Cygni type with a narrow blue absorption component.
The strong emission in Ly is peculiar considering that the metal absorption line, like that of LARS 2, is deep and centered close to zero velocity, factors that should act to suppress Ly escape.
However, like for LARS 2, the velocity distribution in the neutral gas is narrow, allowing for the red wing of Ly emission to still escape. LARS 7 is also the faintest of the five strong global emitters, with a global Ly escape fraction of 0.14. The in-aperture peak Ly flux for LARS 7 is only around 1/3 that of LARS 2, while both its dust content (Hayes et al., 2014) and its line width are somewhat higher.
The Si ii lines of LARS 7 show some difference in depth. The feature is significantly shallower than the rest, some of which could be fluorescent emission from O i* 1305. The relative depths of the 1190+1193 doublet and clear emission in the corresponding fluorescent transitions suggests that some reemission effects are present. This is not straightforward to interpret, but it is at least worth a word of caution that the results of the analysis of this galaxy could be biased by these effects.
A.8. LARS 8
LARS 8 is noteworthy for its strongly outflowing neutral medium. The average metal absorption feature is black at line center, wide, and has the highest velocity of the sample.
Despite the strong outflow, the galaxy just barely qualifies as a Ly emitter. Globally, it has a Ly escape fraction of . In the aperture, it displays a P Cygni profile weak in emission and with a broad absorption component suggesting high H i column density in the outflowing medium.
The four Si ii lines agree well in depth, although the shape of the red wing is a bit ambiguous; the transitions at and 1260 both show a wing reaching across zero velocity and into infalling velocities, while the two other lines show no absorption at zero velocity but do show a minor feature on the red side, too. Some gas is present at line center, but it does not match the shape of the Ly profile quite as neatly as many other lines, This discrepancy could be due to a high column density of the outflowing neutral hydrogen, meaning that the low Ly flux at line center would be due to damping wings from the P Cygni absorption feature.
Other mechanisms that could possibly account for the low output is the fact that the neutral medium covers a large range of velocities, thus quenching escape at more different wavelengths, and the high dusts content of LARS 8, which is the third highest in the sample.
The computed show some scatter, but are generally in good agreement with the average LIS absorption profile, supporting that the absorbing system(s) are optically thick. Weak fluorescent emission is apparent at O i* 1305, while little or no fluorescent emission seems to be present at Si ii* 1194.
A.9. LARS 9
Globally a weak Ly emitter, LARS 9 is the strongest absorber in the sample measured in the COS aperture. The Ly profile is a broad, damped absorption feature, with significant absorption out to km s-1, as is illustrated in Figure 11.
The LIS average metal absorption profile consists of two components. A strong, saturated static or slowly infalling component centered at km s-1, and a shallower component centered at km s-1. This combination of no outflow, large velocity range and probably high column density (judging from the depth of the metal lines) efficiently suppresses Ly escape.
The Si ii lines generally coincide well across the entire velocity range, except for Si ii , which is significantly deeper on the blue side before merging with the other lines in the far blue wing. As mentioned above, a deep feature will lead to a fit that overestimates covering fraction and underestimates column density, which is probably what gives rise to the difference between absorption profile and computed covering fractions on the blue side of the profile.
It is unlikely that this apparent semi transparency is physical; Si ii 1260 is the strongest of the four lines and thus the least sensitive to changes in column density in the close to optically thick regime. Si ii 1304 would become shallower than the rest, then the 1190+1193 doublet. The fact that these three lines coincide so well suggests that some other effect is influencing the blue wing of Si ii 1260, probably a weak contaminating line.
A.10. LARS 10
Much of what was written of LARS 9 above also applies to LARS 10, although on a more moderate scale. This galaxy is also a weak emitter globally and a strong absorber in the COS aperture, although not as strong as LARS 9. The metal absorption lines, while black at line center and almost static, are not as broad and not quite as strong as those of LARS 9. Instead of a slow inflow, the line is centered at a weakly outflowing velocity, but the line is still black at systemic velocity, all of which efficiently blocks Ly escape.
Like for LARS 9, the Si ii lines follow each other except for 1260, which is deeper in the blue wing than the rest. Combined with the fact that the transitions at and 1304 are masked out in the blue wing due to contamination, this introduces some strong uncertainty in the computations of bluewards of the main line. However, this should not affect any of the main conclusions of this work, which primarily rests on the properties at and around line center.
A.11. LARS 11
LARS 11 is, along with LARS 8, notable for having a strongly outflowing neutral medium while still having a low global Ly escape fraction. In the COS aperture, Lyman emission is slightly more pronounced, forming a weak P Cygni profile. As for LARS 8, the width of the averaged LIS metal absorption profile is quite high, and the dust content of LARS 11 is the second highest of the sample, a combination that could possibly account for the missing Ly output.
The Si ii 1190+1193 doublet of LARS 11 falls between the detectors at COS and could not be included in the analysis, meaning that the uncertainties on inferred profile are large, and the assumption of this profile coinciding with the averaged absorption profile must in this case remain an assumption. This is further exacerbated by the spectrum being quite noisy and the estimated measuring errors being large. However, the Monte Carlo simulations show that at least the estimate of the center velocity is quite robust, and that the line persistently is completely opaque at line center.
The two Si ii lines present both show an inflowing dip at around 250 km s-1. However, for it could well be noise, and for it might be contamination. The feature has not been included in the analysis. This could of course have a significant impact, especially in . However, given the large uncertainties of the inferred values for this galaxy, these new values would most likely be consistent with the currently given ones within .
None of the three Si iv absorption lines could be observed for LARS 11; two fall redwards of the detector range, and one is blended with geocoronal Ly.
A.12. LARS 12
Globally, LARS 12 is another weak emitter, and its output in the COS aperture is modest as well. It shows something which in Figure 10 could look like a skewed double-peak profile,but which, when viewing a broader range of wavelengths, turns out to be a quite classic, weak P Cygni absorption profile.
The average LIS profile is relatively shallow and wide. Across most of the profile, Si ii seems slightly shallower than the rest and slightly deeper, indicating that the absorbing systems might not be completely opaque. The best fits for also seem to fall a bit below the averaged profile, although the difference is small and full opacity still a good approximation.
The difference in line depth gets stronger on the red side, mainly due to O i* 1305 adding its contribution to the flux of Si ii 1304. This leads to uncertain and probably erratic values for being reached in this region.
A.13. LARS 13
LARS 13 is another globally weak Ly emitter with a clear but modest P Cygni-like emission feature inside the COS aperture. The absorption component of this feature aligns particularly well with the averaged LIS absorption profile as seen on Figure 10. The averaged LIS absorption profile is relatively wide and everywhere well above zero, centered around km s-1.
The Si ii absorption profiles again align quite well, except , which is somewhat more shallow than the rest. Furthermore, this line and both have a small peak centered at zero velocity which is absent in the two other lines. These two lines are the ones most strongly affected by radiative transfer effects, but it is difficult to say exactly what creates this bump.
The transition at 1193 Å is slightly more shallow than its 1190 Å counterpart, which also indicates that some level of reemission of light in the absorption troughs is present, although probably not much. The shallower 1304 Å line could be due to refilling of the absorption line as well, or it could be due to the line actually being slightly transparent at this wavelength, since this is the weakest of these four transitions. This is reflected by the calculated values of consistently being slightly higher than the values inferred from the assumption of complete optical thickness. This effect is modest and not likely to differ by more than 5%, but it is difficult to say which cause is the more important.
A.14. LARS 14
LARS 14 is the second strong outlier in the sample. It is a Green Pea type galaxy (Cardamone et al., 2009), a class of compact, hot galaxies with low neutral gas column density. The Ly profile of LARS 14 shows strong emission in a double-peaked profile, the central absorption feature of which is remarkably shallow, with a minimum significantly above continuum level, indicating a low H i column density. This is further supported by the Si iv absorption profile being significantly deeper than the averaged LIS metal line, indicating an ionization degree unusually high for the sample.
The average LIS metal absorption profile consists of two shallow and narrow components. One is centered at close to zero and just barely significant, but persistent across all six LIS lines. The other is somewhat stronger but still very shallow, with a minimum residual intensity of around 40%. It is centered at km s-1. The central component sees its Si ii profiles lining up very well, although this, given the weakness of the feature and the measurement uncertainties, should be interpreted with caution. However, if this is in fact true, it indicates that the neutral medium at these velocities is optically thick but fragmented. The stronger, outflowing component shows a somewhat deeper feature at and a somewhat shallower feature at , consistent with a medium that is not fully opaque at these wavelengths, as is also apparent from the profile in Figure 10. This should, however, also be interpreted with caution, due to the uncertainties involved.
The uncertainties combined with the two shallow components of the profile also give a high uncertainty in the calculated dynamic velocities: when performing the Monte Carlo simulation, there is a relatively high probability that the uncertainties drawn can line up to shift the weight of the profile from one component to the other.
The Si ii profiles are peculiar in that they show very modest absorption/scattering along the line of sight, but still strong fluorescent emission in O i* 1305 and Si ii* 1194. We suggest the explanation that significant scattering and re-emission in a relatively dense neutral medium is happening inside the aperture, but off the line of sight to the central sources, as described in Jaskot & Oey (2014). We interpret this as further indication of a clumpy, fragmented neutral medium.
Green Peas have been suggested as candidates for Lyman Continuum leaking galaxies (e.g. Jaskot & Oey, 2013; Nakajima & Ouchi, 2014) due to their very H i column density. This would, in the case of LARS 14, be supported by the overall low values of , with a maximum value of 0.4. However, Heckman et al. (2011) ruled out that this galaxy should leak ionizing radiation along our line of sight, and we find no evidence against this claim.