SOFIA/EXES Observations of Water Absorption in the Protostar AFGL 2591 at High Spectral Resolution
Abstract
We present high spectral resolution (3 km s-1) observations of the ro-vibrational band of H2O in the 6.086–6.135 m range toward the massive protostar AFGL 2591 using the Echelon-Cross-Echelle Spectrograph (EXES) on the Stratospheric Observatory for Infrared Astronomy (SOFIA). Ten absorption features are detected in total, with seven caused by transitions in the band of H2O, two by transitions in the first vibrationally excited band of H2O, and one by a transition in the band of HO. Among the detected transitions is the 11,1–00,0 line which probes the lowest lying rotational level of para-H2O. The stronger transitions appear to be optically thick, but reach maximum absorption at a depth of about 25%, suggesting that the background source is only partially covered by the absorbing gas, or that the absorption arises within the 6 m emitting photosphere. Assuming a covering fraction of 25%, the H2O column density and rotational temperature that best fit the observed absorption lines are cm-2 and K.
I. Introduction
Water, despite being one of the most abundant species in the molecular interstellar medium (ISM), is difficult to observe in astrophysical objects due to its prevalence in the Earth’s atmosphere (see van Dishoeck et al., 2013, for a comprehensive review of astronomical water observations). Ground-based observations of H2O have primarily targeted maser emission, most frequently the –52,3 transition near 22 GHz that was utilized in the initial detection of interstellar water (Cheung et al., 1969), although some have also focused on rotational and ro-vibrational transitions out of high-lying rotational levels in the mid-IR (Pontoppidan et al., 2010) and near-IR (Najita et al., 2000; Carr et al., 2004; Salyk et al., 2008; Indriolo et al., 2013), respectively. These latter observations are possible because many high-lying rotational levels are not significantly populated in the Earth’s atmosphere, but their scope is limited to astrophysical sources with warm ( K), dense gas.
Observations of the lowest-lying rotational levels of water—those able to probe cold gas—have required space-based observatories. The Infrared Space Observatory-Short Wavelength Spectrometer (ISO-SWS; Kessler et al., 1996; de Graauw et al., 1996) covered the ro-vibrational band (symmetric bending mode) of H2O centered near 6 m, and absorption out of the lowest-lying levels of the ortho and para nuclear spin modifications (10,1 and 00,0, respectively) was detected toward several massive protostars (Boonman & van Dishoeck, 2003). Due to the low spectral resolution of the observing configuration though ( using SWS in AOT6 grating mode), these lines were significantly blended with absorption from other nearby H2O lines, making the determination of level-specific column densities impossible. Instead, the entire band was fit simultaneously assuming a single temperature to determine the total water column density, . The Submillimeter Wave Astronomy Satellite (SWAS; Melnick et al., 2000b) provided much higher spectral resolution ( km s-1) and covered the 11,0–10,1 pure rotational transition of H2O at 557 GHz. This line was observed in both emission and absorption in multiple sources (e.g., Melnick et al., 2000a; Snell et al., 2000), demonstrating the ability to probe cold water. More recently, the study of low-lying rotational levels at high spectral resolution ( km s-1) has been facilitated by the Heterodyne Instrument for the Far-Infrared (HIFI; de Graauw et al., 2010) on board the Herschel Space Observatory (Pilbratt et al., 2010). Water has been detected in both emission and absorption out of levels with K in several protostars (e.g., van Dishoeck et al., 2011; van der Tak et al., 2013), and in absorption out of the 00,0 and 10,1 levels in the molecular ISM (e.g., Sonnentrucker et al., 2010; Flagey et al., 2013). Observations that resolve the velocity structure of absorption lines are vital to both determining level-specific column densities, and understanding the dynamics of the absorbing/emitting regions. This is especially important for protostars as such objects contain multiple dynamical components (e.g., disk, envelope, jets, outflows, shocks).
AFGL 2591 is a region of ongoing high-mass star formation. The radio continuum source VLA 3 (for a description of sources see Torrelles et al., 2014, and references therein) is the brightest mid-IR source in the region and drives a bipolar outflow. It was previously observed at 5–7 m as part of the aforementioned ISO-SWS study, from which Boonman & van Dishoeck (2003) reported a best-fit water column density of cm-2 at K, assuming a Doppler line width of 5 km s-1. Known kinematic components associated with AFGL 2591 include: (1) the protostellar envelope with systemic velocity km s-1 in the local standard of rest (LSR) frame (van der Tak et al., 1999); (2) a blue-shifted outflow at km s km s-1 (Emprechtinger et al., 2012; van der Tak et al., 2013); (3) a red-shifted outflow at km s km s-1 (Lada et al., 1984); (4) material entrained in a jet or wind, indicated by absorption in the –0 band of 12CO that extends to km s-1 in the form of an asymmetric blue wing (van der Tak et al., 1999). There is also evidence for a rotating disk around VLA 3, although gas velocities in the disk match those of the envelope (van der Tak et al., 2006; Wang et al., 2012). The interested reader is referred to cartoon pictures (van der Tak et al., 1999, 2006; van der Wiel et al., 2011; Sanna et al., 2012; Wang et al., 2012) and multi-wavelength images (Johnston et al., 2013) of AFGL 2591 to gain a better understanding of the region. Because of the low spectral resolution of the ISO-SWS observations, it has been impossible to say with certainty which component gives rise to the H2O absorption. To do so—and to better constrain the water column density and rotational temperature—we have targeted multiple transitions in the band of H2O using the Echelon-Cross-Echelle Spectrograph (EXES; Richter et al., 2010) on board the Stratospheric Observatory for Infrared Astronomy (SOFIA; Young et al., 2012).
SOFIA operates at altitudes above 39,000 ft (11887 m), where the precipitable water vapor overburden is routinely less than 0.02 mm. Under these conditions the 6 m region of the Earth’s atmosphere is no longer opaque, as it is from the ground. EXES provides high spectral resolution ( km s-1) capabilities in the 4.5–28.3 m range, making it well-suited for velocity-resolved observations of individual ro-vibrational transitions of the band of H2O in astrophysical sources. We present here the first spectrally resolved detections of 10 absorption lines from transitions in the bands of H2O and HO, including a detection probing the ground para level, 00,0. This highlights the opportunity to further probe water in cold molecular clouds without the need for a space-based observatory by utilizing EXES on SOFIA.
II. Observations and Data Reduction
AFGL 2591 VLA 3 was observed using EXES on board SOFIA at an altitude of 43000 ft (13106 m) on 2014 Apr 10 (UT) as part of instrument commissioning observations. Spectra were acquired in cross-dispersed high-resolution mode with a central wavelength of 6.1125 m, using a slit length of 99, and a slit width of 19 to provide a resolving power (resolution) of 86,000 (3.5 km s-1), with the resolution element sampled by 8 pixels. The telescope was nodded after every 27 seconds of integration, enabling subtraction of telluric emission lines, and the total exposure time for AFGL 2591 was 1134 s. Prior to observing the target, a calibration sequence was taken using the same wavelength setting and slit width. This sequence consisted of observations of the internal blackbody unit set to 2600.1 K and of blank sky (Lacy et al., 2002). These calibration frames were used to correct for blaze efficiency, pixel-to-pixel sensitivity variations, and also to provide a first order flux calibration using the expected photon counts from the blackbody unit. The bright star Vega was observed during a flight leg 2 hr before the science observations at the same altitude and air mass as AFGL 2591 for use as a telluric standard star. The observing sequence was similar to that employed for AFGL 2591.
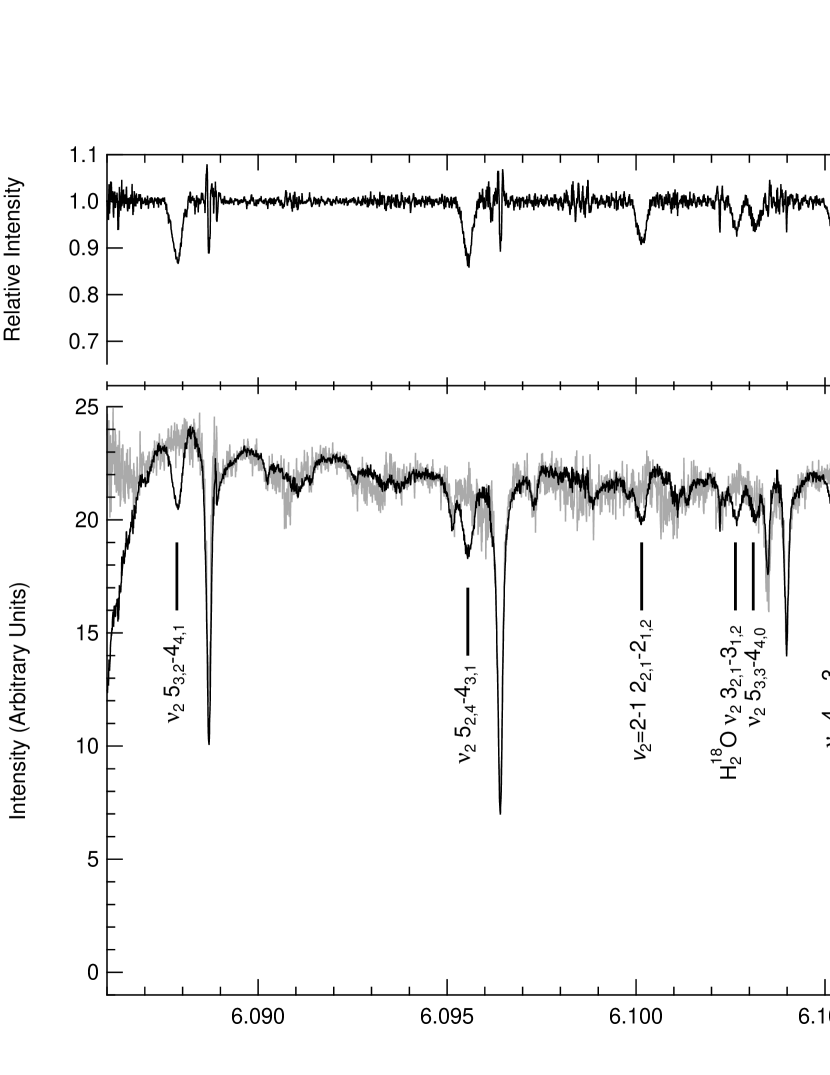
Data were processed using the Redux pipeline (Clarke et al., 2014) with the fspextool software package—a modification of the Spextool package (Cushing et al., 2004)—which performs source profile construction, extraction and background aperture definition, optimal extraction, and wavelength calibration for EXES data. The preliminary wavelength scale output from the pipeline was refined by shifting the wavelength solution so that telluric water absorption lines in the AFGL 2591 continuum best matched entries in the HITRAN database (Rothman et al., 2013). This wavelength calibration is accurate to within km s-1. Spectra extracted from individual orders of the echellogram were combined to form a single continuous spectrum in the wavelength range 6.085–6.135 m for both AFGL 2591 and Vega as shown in the bottom panel of Figure 1. To remove atmospheric features, the spectrum of AFGL 2591 was divided by a smoothed (11 point boxcar average) Vega spectrum. The resulting ratioed spectrum was then divided by a boxcar average to the continuum level extrapolated across absorption lines to produce the normalized spectrum in the top panel of Figure 1. Figure 2 shows the spectra for each transition shifted into the LSR frame following conversion from wavelength to line-of-sight velocity.
III. Analysis
Absorption lines in Figure 2 were fit using a function of the form
| (1) |
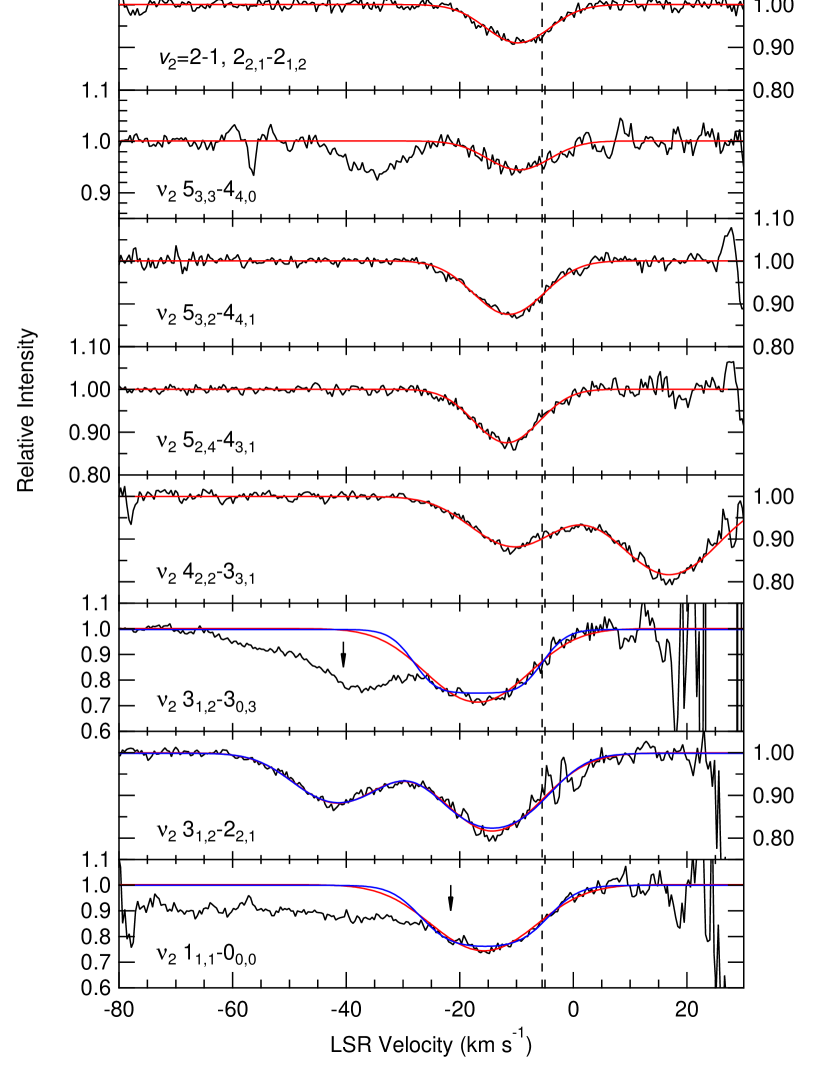
where is the continuum level, is the fraction of the background source covered by absorbing material, and the optical depth is assumed to have a Gaussian profile with optical depth at line center , LSR velocity at line center , and velocity dispersion . The 31,2–22,1 and 42,2–33,1 transitions were fit simultaneously (second and fourth panels from the bottom in Figure 2) using a version of this function modified for multiple lines. The 53,3–44,0 and HO 32,1–31,2 transitions (third-from-top and top panels) were fit separately despite their proximity to each other as there is no significant blending of the features. Due to interfering features near the 11,1–00,0 and 31,2–30,3 transitions (bottom and third-from-bottom panels; see figure caption for explanation of features) only data at km s-1 were used to constrain fits of these transitions. As the absorption features are broad with respect to the instrumental spectral resolution, we expect the lines to be resolved and convert the optical depth profile fit to a column density profile via
| (2) |
under the assumption that the absorption is unsaturated, where and are statistical weights in the lower and upper states respectively, is the spontaneous emission coefficient, and is the transition wavelength. We then integrate over the absorption feature in velocity space to determine the column density in the lower state of the observed transition.
| TransitionaaTransition labels are given as – –, where a single prime denotes the upper state and double prime denotes the lower state, and both the and vibrational quantum numbers are omitted as they are 0 in all cases. | Wavelength | |||||||
|---|---|---|---|---|---|---|---|---|
| (m) | (K) | (s-1) | (km s-1) | (km s-1) | ||||
| Fit Results for | ||||||||
| 1–0 53,2–44,1 | 6.0887005 | 702.3 | 27 | 0.35 | -11.4 | 6.0 | 0.13 | 35.20.3 |
| 1–0 52,4–43,1 | 6.0964081 | 552.3 | 9 | 0.73 | -11.7 | 5.5 | 0.13 | 35.50.3 |
| 2–1 22,1–21,2 | 6.1009690 | 2412.9 | 15 | 5.92 | -9.7 | 5.5 | 0.09 | 32.70.4 |
| HO 1–0 32,1–31,2 | 6.1034870 | 248.7 | 21 | 6.40 | -10.4 | 4.7 | 0.06 | 31.80.5 |
| 1–0 53,3–44,0 | 6.1039868 | 702.3 | 9 | 0.34 | -9.6 | 5.5 | 0.06 | 35.40.6 |
| 1–0 42,2–33,1 | 6.1061925 | 410.4 | 7 | 0.53 | -10.5 | 7.3 | 0.12 | 36.20.3 |
| 1–0 31,2–22,1 | 6.1068262 | 194.1 | 15 | 1.12 | -14.2 | 8.5 | 0.20 | 35.20.2 |
| 2–1 40,4–31,3 | 6.1131638 | 2502.7 | 7 | 15.8 | -8.4 | 4.4 | 0.12 | 32.20.3 |
| 1–0 31,2–30,3 | 6.1137707 | 196.8 | 21 | 6.24 | -16.9 | 8.5 | 0.34 | 34.00.1 |
| 1–0 11,1–00,0 | 6.1163311 | 0 | 1 | 7.46 | -15.7 | 8.7 | 0.30 | 35.70.1 |
| Fit Results for | ||||||||
| 1–0 53,2–44,1 | 6.0887005 | 702.3 | 27 | 0.35 | -11.4 | 5.6 | 0.68 | 35.4 |
| 1–0 52,4–43,1 | 6.0964081 | 552.3 | 9 | 0.73 | -11.8 | 5.2 | 0.68 | 35.6 |
| 2–1 22,1–21,2 | 6.1009690 | 2412.9 | 15 | 5.92 | -9.8 | 5.3 | 0.44 | 32.8 |
| HO 1–0 32,1–31,2 | 6.1034870 | 248.7 | 21 | 6.40 | -10.4 | 4.5 | 0.29 | 31.8 |
| 1–0 53,3–44,0 | 6.1039868 | 702.3 | 9 | 0.34 | -9.6 | 5.3 | 0.25 | 35.4 |
| 1–0 42,2–33,1 | 6.1061925 | 410.4 | 7 | 0.53 | -10.3 | 6.9 | 0.62 | 36.4 |
| 1–0 31,2–22,1 | 6.1068262 | 194.1 | 15 | 1.12 | -14.2 | 7.3 | 1.20 | 35.5 |
| 2–1 40,4–31,3 | 6.1131638 | 2502.7 | 7 | 15.8 | -8.4 | 4.1 | 0.57 | 32.4 |
| 1–0 31,2–30,3 | 6.1137707 | 196.8 | 21 | 6.24 | -16.8 | 5.7 | ||
| 1–0 11,1–00,0 | 6.1163311 | 0 | 1 | 7.46 | -15.6 | 6.5 | ||
Note. — Columns 2, 3, 4, and 5 give the transition wavelength, , lower state energy, , lower-state statistical weight, , and the spontaneous emission coefficient, , respectively. Columns 6, 7, and 8 give the best-fit parameters from equation (1), with covering fractions of 100% and 25% assumed in the top and bottom halves of the table, respectively. Uncertainties in and are estimated to be 0.3 km s-1 at the 1 level. Uncertainties in assume that the uncertainty in the absorption depth at line center is equal to the root mean square noise level of 0.03 in the continuum of the ratioed spectrum prior to the removal of baseline fluctuations. The Doppler parameter, , and line full width at half maximum, FWHM, are related to via the equations and .
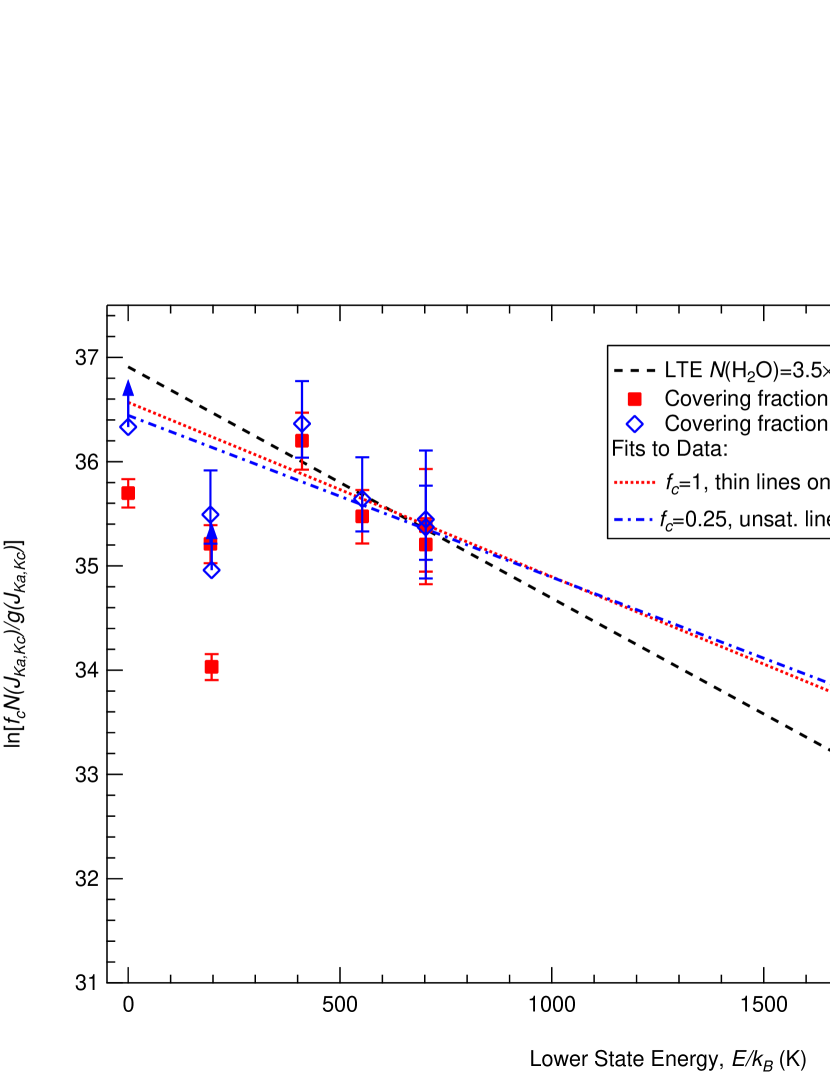
Initial fits were made assuming that the absorbing gas completely covers the background source (), and are shown as red curves in Figure 2. Resulting parameters for each transition are reported in Table 1. Inferred column densities are converted to and plotted versus lower state energy as red squares in Figure 3. The black dashed line shows the relationship expected for cm-2 in local thermodynamic equilibrium (LTE) at K (Boonman & van Dishoeck, 2003). Column densities in the 33,1, 43,1, 44,1, and 44,0 states are in agreement with predictions based on these values, but the states with K are below predicted values, while vibrationally excited states are above predicted values. No single temperature provides a good fit to all nine points, but if we exclude levels with K then we find cm-2 in LTE at K (marked by the red dotted line in Figure 3).
Assuming and from Boonman & van Dishoeck (2003) the 31,2–30,3 transition should be saturated at line center, which is not the case. If the background source is partially covered by absorbing material, or if the water absorption arises within the 6 m emitting photosphere, then it is possible for optically thick, saturated lines to cause only a fractional decrease in the continuum level. The minimum possible fractional coverage is equal to the depth of the strongest absorption line under consideration, in our case the 31,2–30,3 transition. However, the perceived astrophysical absorption from this transition is greatly affected by its telluric counterpart, and the line depth is highly dependent on the atmospheric division procedure. The same is true for the next strongest line, the 11,1–00,0 transition. We use both lines in estimating the minimum covering fraction, choosing , but caution that this is highly uncertain. Fits using are shown as blue curves in Figure 2, and resulting parameters are again in Table 1. Inferred column densities are plotted as open blue diamonds in Figure 3. Scaling by the covering fraction demonstrates that column densities inferred from optically thick transitions increase much more than those inferred from optically thin transitions as decreases, but at the saturated 31,2–30,3 and 11,1–00,0 transitions only provide lower limits on column densities. A fit to the 7 unsaturated transitions is shown by the blue dash-dot line in Figure 3, and corresponds to cm-2 in LTE at K.
IV. Discussion
The pure rotational 11,1–00,0 transition of H2O at 1113.343 GHz (269.3 m) is seen in both emission and absorption toward AFGL 2591 (van der Tak et al., 2013; Kaźmierczak-Barthel et al., 2014; Choi et al., 2015). The emission component arises in the protostellar envelope, and the absorption components in the blue-shifted outflow and foreground gas. This absorption probes the same quantum state as the 11,1–00,0 transition, but a direct comparison is hindered by several effects. The emitting regions at 6 m and 1.1 THz (270 m) are likely different, so that gas probed by one transition may not necessarily be probed by the other. Our EXES observations used a 99 by 19 slit centered on VLA 3, while HIFI observations at 1113 GHz have a roughly circular beam with FWHM ″, again meaning that different regions are being probed. Finally, emission from the ( =(000) 11,1 state (53.4 K above ground) is extremely strong and interferes with the absorption features at 1113 GHz, whereas emission from the (010) 11,1 state (2352 K above ground) is not observed, leaving the 6.1163311 m line unobscured. All of these effects must be considered when comparing any results from HIFI and EXES.
As described in Section I, different components of AFGL 2591 are distinguished by line-of-sight velocities, line profiles, and observed molecules. The H2O absorption lines are centered at roughly km s-1 with FWHM km s-1 for the three lowest-lying levels and shift to km s-1 with FWHM km s-1 for the higher-lying levels, best matching the blue-shifted outflow. These line profiles are most similar to absorption seen in HCN and C2H2 (Knez, 2006, observed at 13 m) as well as specific absorption components of 13CO and vibrationally excited 12CO (Mitchell et al., 1989; van der Tak et al., 1999, observed at 4.7 m), all of which are thought to arise in hot, dense gas close to the central protostar. Several 22 GHz H2O masers are observed throughout the region, with many concentrated in the walls of the blue-shifted outflow associated with VLA 3 (Trinidad et al., 2003; Sanna et al., 2012; Torrelles et al., 2014). Although maser velocities are primarily at km s-1, absorption by gas in small, shocked clumps could explain the small covering fraction required by our analysis. Given the above, we posit that the H2O absorption observed with EXES arises in hot, dense gas at the base of the blue-shifted outflow.
Water emission attributed to the outflow component is observed with HIFI in multiple transitions as a broad feature (van der Tak et al., 2013; Kaźmierczak-Barthel et al., 2014; Choi et al., 2015), but is centered closer to the systemic velocity of the envelope than the absorption we see. Analysis of the H2O outflow emission by Choi et al. (2015) indicates a temperature of –90 K and column density of cm-2, similar to results found by Karska et al. (2014) who analyzed unresolved H2O absorption observed with PACS on Herschel, finding K and cm-2. These values are significantly below what we find, suggesting that EXES and HIFI/PACS observations trace different components. Between the broad and narrow water emission observed with HIFI, the broad absorption observed with EXES, and the abundant maser spots, it is evident that the water-containing gas in AFGL 2591 is both spatially and kinematically complex. Interpreting the various observations of H2O in AFGL 2591 in unison will require utilizing a physical model that includes radiative transfer accounting for absorption, stimulated and spontaneous emission, and collisional (de-)excitation, as well as kinematic and geometric effects.
V. Summary
We have detected ten absorption features arising from warm gas in AFGL 2591 caused by ro-vibrational transitions of water, including seven from the band of H2O, two from the vibrationally excited band of H2O, and one from the band of HO. Among the detected absorption lines is the 11,1–00,0 transition at 6.1163311 m, which probes the ground state of para-H2O. Relative strengths of absorption features are suggestive of a covering fraction less than 1 (or absorption arising within the 6 m emitting photosphere), with a limit of set by the depth of the strongest absorption features. Analysis of the level populations assuming results in cm-2 for LTE at K. Line profiles best match the blue-shifted outflow component, and we ascribe the absorption to hot, dense gas at the base of the outflow. The temperature and column density inferred by our analysis are much larger than those reported by Choi et al. (2015) for the outflow component observed in H2O emission by HIFI. Uncertainty in whether the EXES and HIFI observations are probing the same gas makes the combined interpretation of both datasets difficult, and a physical model of AFGL 2591 that includes radiative transfer will be necessary for such an analysis. Clearly though, observations of the ro-vibrational band of H2O at high spectral resolution—observations uniquely achievable with EXES on SOFIA—add important information for interpreting this region and others.
MJR and CND acknowledge Collaborative Agreement NNX13AI85A between UCD and NASA Ames for its support and support of EXES development. Many thanks to the anonymous referee.
References
- Boonman & van Dishoeck (2003) Boonman, A. M. S., & van Dishoeck, E. F. 2003, A&A, 403, 1003
- Carr et al. (2004) Carr, J. S., Tokunaga, A. T., & Najita, J. 2004, ApJ, 603, 213
- Cheung et al. (1969) Cheung, A. C., Rank, D. M., Townes, C. H., Thornton, D. D., & Welch, W. J. 1969, Nature, 221, 626
- Choi et al. (2015) Choi, Y., van der Tak, F. F. S., van Dishoeck, E. F., Herpin, F., & Wyrowski, F. 2015, A&A, in press, (arXiv:1412.4818)
- Clarke et al. (2014) Clarke, M., Vacca, W. D., & Shuping, R. Y. 2014, in ADASS Conference Series, ADASS XXIV, (San Francisco, CA: ASP)
- Cushing et al. (2004) Cushing, M. C., Vacca, W. D., & Rayner, J. T. 2004, PASP, 116, 362
- de Graauw et al. (1996) de Graauw, T., Haser, L. N., Beintema, D. A., et al. 1996, A&A, 315, L49
- de Graauw et al. (2010) de Graauw, T., Helmich, F. P., Phillips, T. G., et al. 2010, A&A, 518, L6
- Emprechtinger et al. (2012) Emprechtinger, M., Monje, R. R., van der Tak, F. F. S., et al. 2012, ApJS, 756, 136
- Flagey et al. (2013) Flagey, N., Goldsmith, P. F., Lis, D. C., et al. 2013, ApJ, 762, 11
- Indriolo et al. (2013) Indriolo, N., Neufeld, D. A., Seifahrt, A., & Richter, M. J. 2013, ApJ, 776, 8
- Johnston et al. (2013) Johnston, K. G., Shepherd, D. S., Robitaille, T. P., & Wood, K. 2013, A&A, 551, A43
- Karska et al. (2014) Karska, A., Herpin, F., Bruderer, S., et al. 2014, A&A, 562, A45
- Kaźmierczak-Barthel et al. (2014) Kaźmierczak-Barthel, M., van der Tak, F. F. S., Helmich, F. P., et al. 2014, A&A, 567, A53
- Kessler et al. (1996) Kessler, M. F., Steinz, J. A., Anderegg, M. E., et al. 1996, A&A, 315, L27
- Knez (2006) Knez, C. 2006, PhD thesis, The University of Texas at Austin
- Lacy et al. (2002) Lacy, J. H., Richter, M. J., Greathouse, T. K., Jaffe, D. T., & Zhu, Q. 2002, PASP, 114, 153
- Lada et al. (1984) Lada, C. J., Thronson, Jr., H. A., Smith, H. A., Schwartz, P. R., & Glaccum, W. 1984, ApJ, 286, 302
- Melnick et al. (2000a) Melnick, G. J., Ashby, M. L. N., Plume, R., et al. 2000a, ApJ, 539, L87
- Melnick et al. (2000b) Melnick, G. J., Stauffer, J. R., Ashby, M. L. N., et al. 2000b, ApJ, 539, L77
- Mitchell et al. (1989) Mitchell, G. F., Curry, C., Maillard, J.-P., & Allen, M. 1989, ApJ, 341, 1020
- Najita et al. (2000) Najita, J. R., Edwards, S., Basri, G., & Carr, J. 2000, Protostars and Planets IV, 457
- Pilbratt et al. (2010) Pilbratt, G. L., Riedinger, J. R., Passvogel, T., et al. 2010, A&A, 518, L1
- Pontoppidan et al. (2010) Pontoppidan, K. M., Salyk, C., Blake, G. A., & Käufl, H. U. 2010, ApJ, 722, L173
- Richter et al. (2010) Richter, M. J., Ennico, K. A., McKelvey, M. E., & Seifahrt, A. 2010, in Society of Photo-Optical Instrumentation Engineers (SPIE) Conference Series, Vol. 7735, Society of Photo-Optical Instrumentation Engineers (SPIE) Conference Series
- Rothman et al. (2013) Rothman, L. S., Gordon, I. E., Babikov, Y., et al. 2013, J. Quant. Spec. Radiat. Transf., 130, 4
- Salyk et al. (2008) Salyk, C., Pontoppidan, K. M., Blake, G. A., et al. 2008, ApJ, 676, L49
- Sanna et al. (2012) Sanna, A., Reid, M. J., Carrasco-González, C., et al. 2012, ApJ, 745, 191
- Snell et al. (2000) Snell, R. L., Howe, J. E., Ashby, M. L. N., et al. 2000, ApJ, 539, L101
- Sonnentrucker et al. (2010) Sonnentrucker, P., Neufeld, D. A., Phillips, T. G., et al. 2010, A&A, 521, L12
- Torrelles et al. (2014) Torrelles, J. M., Trinidad, M. A., Curiel, S., et al. 2014, MNRAS, 437, 3803
- Trinidad et al. (2003) Trinidad, M. A., Curiel, S., Cantó, J., et al. 2003, ApJ, 589, 386
- van der Tak et al. (1999) van der Tak, F. F. S., van Dishoeck, E. F., Evans, II, N. J., Bakker, E. J., & Blake, G. A. 1999, ApJ, 522, 991
- van der Tak et al. (2006) van der Tak, F. F. S., Walmsley, C. M., Herpin, F., & Ceccarelli, C. 2006, A&A, 447, 1011
- van der Tak et al. (2013) van der Tak, F. F. S., Chavarría, L., Herpin, F., et al. 2013, A&A, 554, A83
- van der Wiel et al. (2011) van der Wiel, M. H. D., van der Tak, F. F. S., Spaans, M., et al. 2011, A&A, 532, A88
- van Dishoeck et al. (2013) van Dishoeck, E. F., Herbst, E., & Neufeld, D. A. 2013, Chemical Reviews, 113, 9043
- van Dishoeck et al. (2011) van Dishoeck, E. F., Kristensen, L. E., Benz, A. O., et al. 2011, PASP, 123, 138
- Wang et al. (2012) Wang, K.-S., van der Tak, F. F. S., & Hogerheijde, M. R. 2012, A&A, 543, A22
- Young et al. (2012) Young, E. T., Becklin, E. E., Marcum, P. M., et al. 2012, ApJ, 749, L17