Mapping the Dynamics of a Giant Ly Halo at z = 4.1 with MUSE: The Energetics of a Large Scale AGN-Driven Outflow around a Massive, High-Redshift Galaxy
Abstract
We present deep MUSE integral-field unit (IFU) spectroscopic observations of the 150 kpc Ly halo around the = 4.1 radio galaxy TNJ J13381942. This 9-hr observation maps the two-dimensional kinematics of the Ly emission across the halo. We identify two Hi absorbers which are seen against the Ly emission, both of which cover the full 150 80 kpc extent of the halo and so have covering fractions 1. The stronger and more blue-shifted absorber ( 1200 km s-1 from the systemic) has dynamics that mirror that of the underlying halo emission and we suggest that this high column material ((Hi) 1019.4 cm-2), which is also seen in Civ absorption, represents an out-flowing shell that has been driven by the AGN or the star formation within the galaxy. The weaker ((Hi) 1014 cm-2) and less blue shifted ( 500 km s-1) absorber most likely represents material in the cavity between the out-flowing shell and the Ly halo. We estimate that the mass in the shell must be of order 1010 M⊙ – a significant fraction of the ISM from a galaxy at = 4. The large scales of these coherent structures illustrate the potentially powerful influence of AGN feedback on the distribution and energetics of material in their surroundings. Indeed, the discovery of high-velocity ( 1000 km s-1), group-halo-scale (i.e. 150kpc) and mass-loaded winds in the vicinity of the central radio source are broadly in agreement with the requirements of models that invoke AGN-driven outflows to regulate star formation and black-hole growth in massive galaxies.
keywords:
galaxies: evolution — galaxies: high-redshift — radio1 Introduction
Theoretical models of galaxy formation are increasingly successful in their ability to predict the observed properties of galaxies across cosmic time. The most successful models invoke a dramatic form of energy injection from the central active galactic nuclei (AGN) and from star-formation and supernovae to drive high-velocity (100’s km s-1), galaxy-wide (i.e. 10kpc) and mass-loaded energetic outflows. These winds expel significant amounts of gas from the host galaxy and consequently this shuts down future star formation and black hole growth. This process should also enrich the larger scale environment with metals (e.g. Silk & Rees, 1998; Fabian, 1999; Benson et al., 2003; Granato et al., 2004; Di Matteo et al., 2005; Springel & Hernquist, 2003; Springel et al., 2005; Hopkins et al., 2006, 2008; Booth & Schaye, 2010; Debuhr et al., 2012). In the models, this feedback mechanism is required to prevent the run-away cooling of gas in massive halos and so match the galaxy luminosity function at = 0 (e.g. Bower et al., 2006; Croton et al., 2006).
If this feedback mechanism is the dominant route by which massive galaxies terminate their star formation, then it is critical that the AGN feedback is at its maximum efficiency at the epoch where the bulk of the stars in the most luminous elliptical galaxies appear to be formed, 3–5 (Nelan et al., 2005). This is therefore the era to search for evidence of AGN feedback in massive galaxies. High-redshift radio galaxies are one potential laboratory to search for evidence of this feedback “in action”, as they appear to be amongst the most evolved and most massive galaxies in the early Universe, host energetic AGN, and have the properties expected for the progenitors of today’s central cluster galaxies (De Breuck et al., 2002).
Potential evidence for such “AGN feedback” may come from the discovery of very extended Ly halos with spatial extents of 100–200 kpc which are being found in increasing numbers in the high-redshift Universe, including around high-redshift radio galaxies (van Ojik et al., 1997; Venemans et al., 2007). Many of these appear to be associated with young, massive galaxies which display high-levels of starburst and AGN activity (e.g. van Breugel et al., 1998; Matsuda et al., 2011). One simple interpretation is that these Ly halos represent gas reservoirs which are being ionised by UV emission, shocks and outflows from the active galaxies within the halos (e.g. Taniguchi et al., 2001; Geach et al., 2009; Smail & Blundell, 2013). However, theoretical models have also suggested that these halos may instead be powered by cooling from gas in so-called “cold-flows” (e.g. Fardal et al., 2001; Dekel et al., 2009). The spatially resolved dynamics and line profiles of these Ly halos, as well as their chemical enrichment should be able to differentiate which mechanism is responsible for their formation (Bower et al., 2004; Smail & Blundell, 2013).
The two-dimensional Ly surface brightness distributions (e.g. Matsuda et al., 2012) or one-dimensional kinematics of high-redshift radio galaxies (e.g. van Ojik et al., 1997; Binette et al., 2000; Villar-Martín et al., 2003; Ohyama & Taniguchi, 2004; Matsuda et al., 2006; Humphrey et al., 2007, 2009; Yang et al., 2011, 2014) suggest that the central AGN plays an important role in shaping the environments around massive, high redshift galaxies on 10’s of kilo-parsec scales. For example, observations have reveals that the spatial extent of the Ly-emitting gas is correlated with the spatial scales of the jets, whilst the distortion seen in the Ly morphology is also typically correlated with the distortion in the radio emission (the extended emission line region morphology always appears to be brightest on the side of the radio lobes that is closer to the nucleus; McCarthy et al. 1991; Tadhunter et al. 2000), suggesting that powerful radio sources are (at least partly) responsible for environmental effects on large scales. In terms of the large scale environment, van Ojik et al. (1997) showed that the galaxies with radio jets that are extended on scales smaller than 50 kpc have the strongest strong Hi absorption seen against Ly (and likewise, those with radio extents 50 kpc do not show strong absorbers). One explanation is that when radio sources growth they destroy the Hi. However, this model also requires a duty cycle in which the “feedback” expels gas, which cools then to form a shell of Hi. A subsequent “feedback” event then ionises the gas. This model may also explain why the dynamics of the gas in the inner halo (located within the radio source) tend to be turbulent ( 700–1500 km s-1) whilst the out halo is more quiescent ( 300 km s-1; van Ojik et al. 1996).
To measure the energetics of the Ly emission, search for and place dynamical constraints on the out-flowing material requires resolved spectroscopy. However, relatively few galaxies have been studied using their two-dimensional Ly velocity field, as required to truly understand their origin. The first attempt to derive the morphologies and dynamics of extended Ly halos were made by Hippelein & Meisenheimer (1993) who found a coherent and spatially extended (100 kpc2) and moderate column, (Hi)1015 cm2, Hi absorber in front of a 4C radio galaxy at = 3.8 (see also Adam et al., 1997). However, relatively few galaxies have been studied using their two-dimensional Ly velocity field, as required to truly understand their origin (e.g. see Bower et al., 2004; Wilman et al., 2005; Villar-Martín et al., 2007b; Sánchez & Humphrey, 2009; Weijmans et al., 2010; Martin et al., 2014, for a few examples). In part, this is due to the high redshift and hence large luminosity distances required to redshift Ly into the optical band, which means that spatially resolving the low surface brightness features in the outer halo have, until now, been beyond the sensitivity limits of most instruments (even on 8-meter telescopes). However, with the commissioning of the sensitive Multi-Unit Spectroscopic Explorer (MUSE) on the ESO / VLT, it is now possible to carry out these observations and so determine the nature of extended Ly halos.
In this paper, we exploit MUSE observations to determine the nature of extended Ly halo around a powerful radio galaxy, TNJ J13381942 at = 4.1 (hereafter TNJ J1338). TNJ 1338 was identified as hosting a giant Ly halo by Venemans et al. (2002). In a subsequent paper, Venemans et al. (2007) (see also Miley et al., 2004) identified twenty Ly emitters within a projected distance of 1.3 Mpc and 600 km s-1 of the radio galaxy (an over-density of 4–15 compared to the average field at this redshift), suggesting a mass for the structure of M5 1014M⊙ which makes structure a likely ancestor of a massive galaxy cluster at the present day (with the radio galaxy likely to be a brightest cluster galaxy in formation). This high-redshift radio galaxy remains one of the the brightest and most luminous known in Ly ( 5 1044 erg s-1). Both its Ly profile and radio structure are very asymmetric (De Breuck et al., 1999; Wilman et al., 2004), which indicates strong interaction with dense gas, and the rest-frame radio luminosity is comparable to that of the most luminous 3C radio sources (P 4 1035 erg s-1 Hz-1 sr-1). The MUSE observations presented here allow us to map the emission within the 150-kpc long Ly halo, matching the sensitivity of previous narrow-band Ly imaging of this structure, but with the crucial advantage of high spectral resolution kinematics, necessary to differentiate the signatures of infall or outflow (Adams et al., 2009; Bower et al., 2004; Wilman et al., 2005).
The structure of this paper is as follows: in § 2 we present the MUSE observations and data-reduction. In § 3 we discuss the morphology and energetics of the Ly halo and those of the Hi absorbers seen against the underlying emission. In §4 we present our conclusions. Throughout this paper, we adopt a cosmology with = 0.27, = 0.73 and = 71 km s-1 Mpc-1 giving an angular scale of 7.0 kpc arcsec-1 at = 4.1.
2 Observations and Data Reduction
We observed TNJ J1338 with MUSE for a total of 9.0 hours between 2014 April 30 and 2014 June 30 during a combination of commission and Science Verification time. The MUSE IFU provides full spectral coverage spanning 4770–9300Å, a contiguous field of view of 60 60 ′′, with a spatial sampling of 0.2′′ pixel-1 and a spectral resolution of = 3000 at = 6200Å (the wavelength of the Ly at = 4.1). The observations were carried out in dark time, good sky transparency and 0.7′′ -band seeing. Each 1 hr observation was split in to 1800 second exposures with a small (2′′) dither. We obtained two overlapping pointings; the first centered at : 13 38 28.0 : 19 42 24 and a second, offset by approximately 30′′ at : 13 38 25.0 : 19 42 32. Both pointings cover the = 4.1 radio galaxy and the final field of view is 1.5 1.0′ (Fig. 1).
To reduce the data, we use the MUSE pipeline through esorex which wavelength calibrates, flat-fields the spectra and forms the datacube (Weilbacher et al., 2014). Due to the excellent flat-field stability of MUSE, sky subtraction was performed on each individual cube by identifying and subtracting the sky emission using blank areas of sky at each wavelength slice (i.e. no additional sky-only observations are required), and the final mosaic was then constructed using an average with a 3- clip to reject cosmic rays after registering the stars in continuum images from each individual cube.
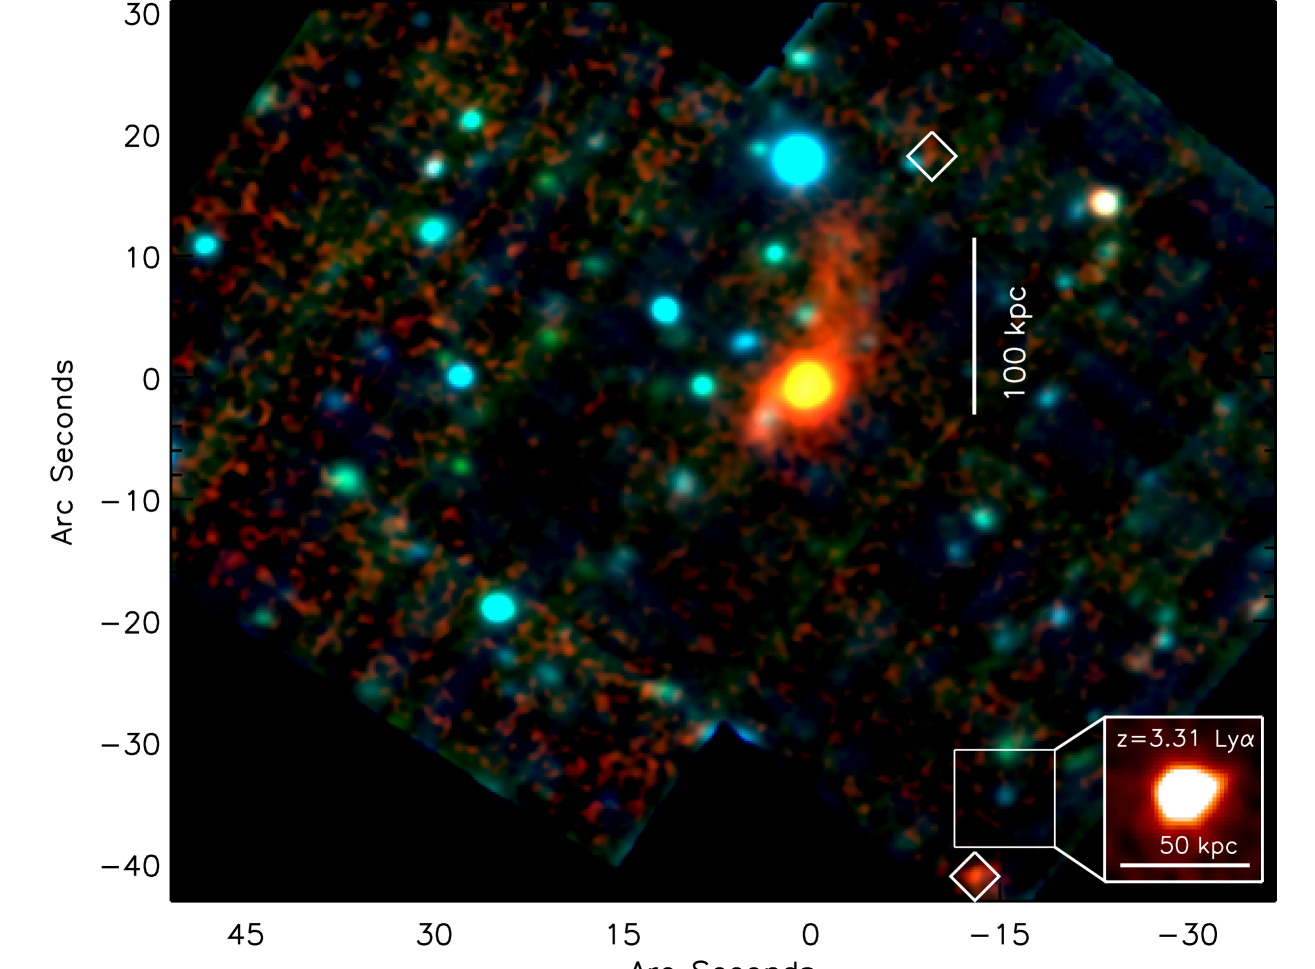
A visual inspection of the final datacube reveals a very strong detection of the extended Ly emission from the = 4.1 halo at 6200Å as well as Ly emission from a number of galaxies at the same redshift. In Fig. 1 we show a colour image of the field generated from the MUSE cube. In this image, we use the continuum from the wavelength ranges 4900–6900Å and 6900–9000Å as the blue and green images respectively, whilst the red image is generated by collapsing the cube over the wavelength range 6100–6200Å (which covers the Ly from the = 4.1 radio galaxy). The strong, extended Ly emission can clearly be seen, with a spatial extent of 150 80 kpc.
We note that a search for line emitters within the cube also detects a second strong, spatially-extended Ly halo around a red = 3.31 galaxy located approximately 30′′ to the south west of TNJ J1338 (Fig. 1) which appears to lie in an over-density comprising a number of other star-forming galaxies and AGN at this redshift. In addition, a large number of foreground [Oii], [Oiii] and Ly emitters are detected in this volume. These will be discussed in a subsequent paper (Urrutia et al. in prep).
3 Analysis & Discussion
3.1 Morphology and Energetics of the Ly Halo
The morphology of the Ly emission (Fig. 1) is very similar to that seen in the FORS 2 narrow-band imaging from Venemans et al. (2007), which has similar surface brightness limits as the Ly narrow-band image created from the MUSE cube (collapsing the cube over 120Å around the Ly yields an image with a 5- line flux detection in a 1.2′′ aperture of = 8 10-18 erg s-1 cm-2 which is similar to that of the narrow-band image from Venemans et al. 2007; = 6 10-18 erg s-1 cm-2). Indeed, the morphology of the source shows a strong, spatially extended core which has a diameter of approximately 5′′ with a lower surface brightness halo which is extended along a roughly North–South direction which extends over a 20′′ (150 kpc) in extent. The elongated Ly morphology is also consistent with the direction of the radio jets (Fig. 1), although the strongest jet emission is contained within the central 10 kpc, which may be indicative of previous AGN activity (which ionised the extended halo and which is now seen in Ly emission as the gas cools). We note that the elongated morphology of the Ly – in the same direction as the radio emission – is consistent with that seen in a number of other high-redshift radio galaxies (Röttgering & Pentericci, 1999).
As an order-of-magnitude estimate of the total Hii mass responsible for the Ly emitting halo, we can assume case B recombination and that the gas is at a temperature of 104 K, and following De Breuck et al. (1999), using the total Ly emission intensity (corrected for absorption, see § 3.3), the total Hii mass is approximately M(Hii) 109( )0.5 M⊙, where is the volume filling factor of 10-5 (McCarthy et al., 1990), is the Ly luminosity in units of 1044 erg s-1 and is the volume of the region in units of 1070 cm3. Adopting a size of 150 80 80 kpc we derive M(Hii) 4 109 M⊙.
The spatial extent of the Ly halo in TNJ J1338 is comparable to that seen in a number of other high-redshift radio galaxies (van Ojik et al., 1997; Humphrey et al., 2007). Indeed, extended Ly halos are common around high-redshift radio galaxies, extending up to 250 kpc – far beyond the continuum structures revealed by HST images (e.g. Villar-Martín et al., 2003). Moreover, the spatial extent of the Ly emitting halo around high-redshift radio galaxies also appear to correlate with the size of the radio emission (van Ojik et al., 1997) (although of course, this is likely to be a selection effect since the larger halos are likely to be more easily detectable around powerful active galaxies since the active nucleus provides a more intense supply of ionising photons). Blind narrow-band surveys have also identified giant Ly emitting halos around star-forming galaxies with (relatively) low luminosity AGNs (Matsuda et al., 2011) as well as in structures containing multiple radio-quiet quasars (e.g. Cantalupo et al., 2014), suggesting that while an AGN may play an important role in providing the ionising source of radiation to ionise the halo, it is not a requirement. Indeed, the Ly blobs (LABs) also have spatial extents up to 180 kpc and the Ly emission can be attributed to either photoionisation from the AGN or star-formation from the host galaxies (Geach et al., 2009).
What powers the Ly emission in the extended halo of TNJ 1338 is unclear. As Fig. 1 shows, the Ly halo extends over 10 that of the radio jets detectable at GHz radio frequencies, which are contained within the central 10 kpc. One possible interpretation is that the emission in the extended halo is powered by the cooling of pristine gas within a dark matter halo (Fardal et al., 2001; Nilsson et al., 2006). However, the far-infrared luminosity of TNJ 1338 implied from Herschel / SPIRE and JCMT / SCUBA-850m observations is = 7 1 1012 L⊙ (SFR = 700 M⊙ yr-1; Drouart et al. 2014) which gives a ratio of total Ly / IR luminosity of 1 1045 / 4 1046 = 0.03. This luminosity ratio is similar to that from the AGN luminosity (L 2 1046 erg s-1; Drouart et al. 2014) which gives LLyα / LAGN = 0.05. Thus, only a small fraction of either the infrared (star-formation) or AGN luminosity is required to power the Ly emission. However, we note that the high Ly / Heii ratio averaged over the halo is Ly / Heii1640 = 18.7 0.5 (see § 3.2) which is difficult to explain with AGN photo-ionisation only (Villar-Martín et al., 2007a), and suggests we are likely to be observing a combination of energy sources that are heating the halo.
3.2 Spatially Resolved Structure
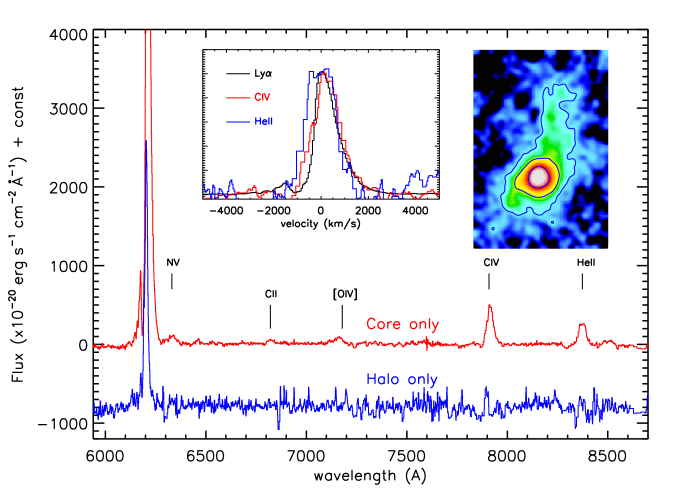
Before determining the velocity structure of the halo, we first define the systemic redshift of the galaxy by extracting a spectrum from a 1 1′′ region centered on the UV (and radio) continuum counterpart. Unfortunately, no strong photospheric absorption features are present, but there are strong detections of Ly, Civ 1549 and Heii 1640 (see Fig. 2). Since the Ly and Civ are resonant lines, we use the Heii emission line and fit a single Gaussian profile, deriving a redshift of = 4.1057 0.0004 and a FWHM of 35 3 Å (or 1250 100 km s-1). In all following sections, we adopt = 4.1057 as the systemic redshift when comparing velocities or velocity differences.
To investigate the spectral properties of the core and halo, we begin by extracting two spectra, one from a circular 3 3′′ region centered on the continuum counterpart (the core of the galaxy), and a second from the extended halo (excluding the core region), and we show these two spectra in Fig. 2. The core spectrum shows strong emission lines associated with the AGN (e.g. Nv, [Oiv], Civ and Heii). The emission from the halo (which should exclude any seeing-related contamination from the core, but will not exclude scattered emission within the halo) also shows weak Civ emission. The detection of heavy elements (in particular Civ) in the extended halo suggests that the halo is already metal-enriched (see also Binette et al., 2006; Villar-Martín et al., 2003).
The line ratios from Carbon, Nitrogen or Helium compared to Hydrogen can be used to infer the physical conditions within the diffuse halo. Although the Civ and Heii emission lines lie in regions of high atmospheric OH emission, we derive line ratios (or limits) of [Civ] / Ly = 0.082 0.003 and 0.064 0.013 for the “core” and “halo” respectively. For the Heii / Ly ratio, we derive Heii / Ly = 0.044 0.003 and 0.075 for the “core” and “halo” respectively – consistent with stellar or power-law photo-ionisation models with metallicities ranging from 0.05–1 Z / Z⊙ (Binette et al., 2006; Villar-Martín et al., 2007a).
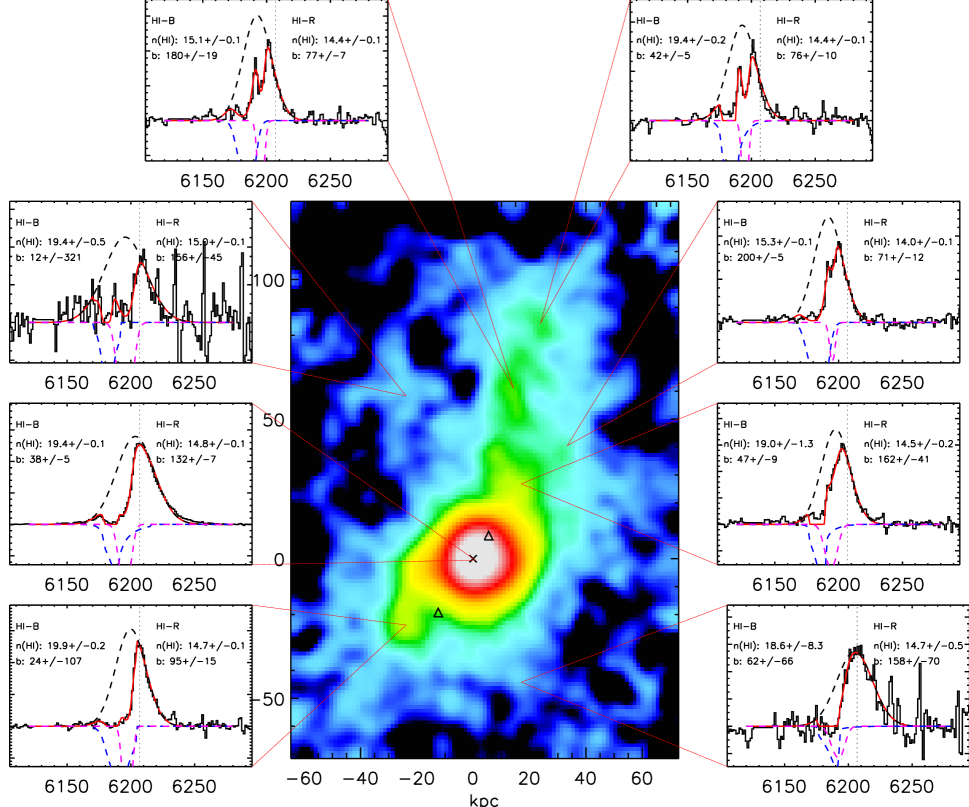
Next we extract a number of spectra across the halo by integrating 2′′ 2′′ regions and show these in Fig. 3. Whilst the strong Ly emission is clearly evident, it is also apparent that the emission line is asymmetric. One possible interpretation of the Ly emission line profile is that it naturally arises from the transfer of Ly radiation through a neutral screen. If the Ly photons have to travel through a region of neutral hydrogen, they will resonantly scatter until they Doppler shift into the wings where the opacity is lower. Such a phenomenon will give rise to either a double-peaked profile (Adams, 1975; Dijkstra et al., 2006), or, depending on the geometry and kinematics of the neutral gas, an asymmetric profile in which one of the peaks is stronger. However, for this to be a viable explanation of the observed line profile in TNJ 1338, we require the Ly to be embedded in a (partial) cocoon of neutral hydrogen of large optical depth. On the other hand, the asymmetry of the emission line, and the sharpness of the deep trough(s) suggest that Hi absorption is far more probable (e.g. Rottgering et al., 1995; van Ojik et al., 1997; Wilman et al., 2004).
Within the central regions of the halo, the asymmetric Ly profile was first studied using high-resolution UVES spectroscopy by (Wilman et al., 2004) who showed that the line emission is best fit with an underlying Gaussian profile with two Hi absorbers with column densities (Hi) 1015.0 cm-2 and n(Hi) 1019.7 cm-2 for Hi-B and Hi-R respectively. As we shall see, a similar combination of absorbers is required to reproduce our spectra across all of the halo.
To describe the line profile, we begin by fitting a Gaussian profile emission line with a Hi absorber (which is described by a Voigt-profile). However, in all of the regions shown in Fig. 3, this fit fails to provide an adequate description of the line, and instead two Hi absorbers are required to adequately describe the line profile (see also Wilman et al., 2004). The first of these absorbers, which we label Hi-R (the most redshifted) is typically offset from the central (underlying) Gaussian profile by 270 km s-1, has a column density of (Hi) 1014.5 cm-2 and Doppler parameter of = 100 4 km s-1 whilst the second absorber, Hi-B (the most blue-shifted) is typically offset from the underlying Gaussian profile by 1200 km s-1 but with a much higher column density, (Hi) 1019.3 cm-2 and = 170 5 km s-1. Within the halo, the underlying Gaussian profile has an average velocity dispersion of = 570 13 km s-1, in agreement with the velocity dispersions of the Heii emission line, and much broader than the two absorbers. The velocity dispersion of the underlying emission is peaked at the position of the radio galaxy (and the radio-jets), with = 750 20 km s-1. This may reflect two components of the halo: the inner halo where there is a strong interaction between the radio plasma and the gas, and the outer (more quiescent) halo, located outside the radio source (van Ojik et al., 1996). In contrast, the much smaller velocity dispersion of the absorbing gas is more readily explained if these absorbers lie at relatively large distances from the parent galaxy. We will discuss the spatially resolved properties of these absorbers in § 3.3.
Finally, we note that van Ojik et al. (1997) showed that most high redshift radio sources with radio jets within 50 kpc of the central galaxies show strong Hi absorption against their Ly emission. This may suggest that when the radio sources grow, they destroy the Hi. Since the radio emission in TNJ 1338 is located within 10 kpc of the galaxy, this radio source clearly falls into first category. Within this scenario, there must be a duty cycle with the feedback expelling Ly-emitting gas, which cools to form a shell of Hi around it, and a subsequent feedback event ionises the gas.
3.3 Dynamics of the Hi Absorbers
As can be seen from Fig. 3, one of the striking results from our MUSE observations is the coherence and spatial extent of both absorbers. The most blue-shifted absorber, Hi-B, which has (Hi) 1019.3 cm-2 appears to be spatially extended across the entire 150 80 kpc structure. The second absorber, Hi-R, which has a significantly lower column density, (Hi) 1014.5 cm-2 also appears to be extended over the same area. Thus, the covering factor of both absorbers appears to be close to unity. Evidence for extended reservoirs of neutral gas have been seen in a number of giant Ly halos around high-redshift radio galaxies (van Ojik et al., 1997; Binette et al., 2000; Villar-Martín et al., 2003; Wilman et al., 2004) as well as star-forming galaxies (Bower et al., 2004; Wilman et al., 2005; Weijmans et al., 2010).
To examine whether the Hi absorbers are “pristine” – as suggested by the cold-flow model, in Fig. 2 we compare the Ly, Civ and Heii emission line profiles (transformed to the same rest-frame velocity scale). Although the Civ emission is lower signal-to-noise, it is clear that the Ly and Civ share the same characteristic (asymmetric) line profile, implying the presence of Civ in the absorbing material (without other species, it is difficult to derive the ionisation of the absorbing material, but it appears that this absorbing gas must be metal enriched, arguing against a model in which the Ly results from the cooling of pristine material).
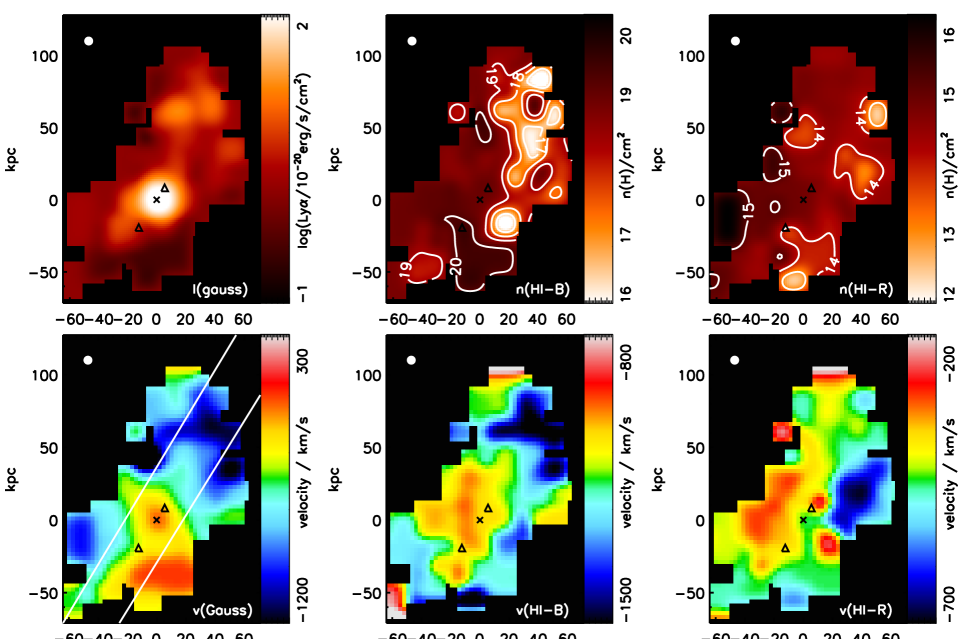
With the two dimensional data provided by MUSE, next, we construct a spatially resolved map of the dynamics and column density across the halo. To achieve this, at each spatial pixel, we average the surrounding 1′′ 1′′ region, and measure the signal-to-noise (S / N). If the S / N 50, we then we attempt to fit the emission line profile with an underlying Gaussian profile with two Hi absorbers, allowing the centroid, intensity and line-width (FWHM in the case of the Gaussian profile and Doppler -parameter in the Voigt-profile) to be free parameters. If the S / N is not sufficiently high to allow a fit, we adaptively bin up to 3 3′′ (in steps of 0.2′′) and re-fit.
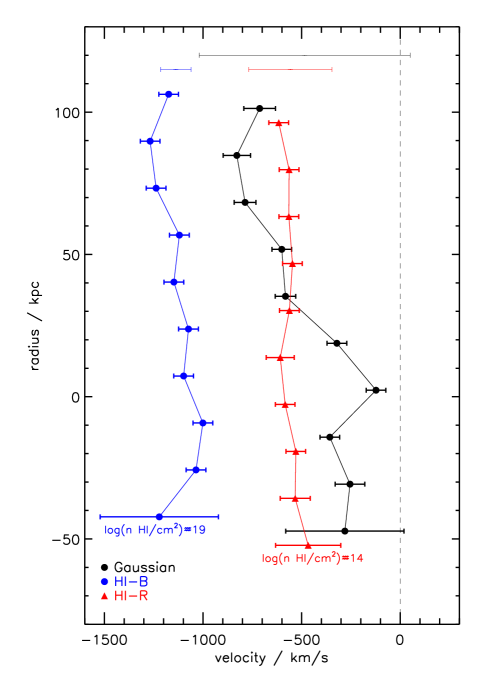
In Fig. 3 we show the velocity field of the underlying Gaussian emission, as well as that of the two Hi absorbers. The underlying emission has a strong velocity gradient ( 700 km s-1) across the 150 kpc in projection. At the position of the galaxy, the Ly is blue-shifted by 150 km s-1 from the systemic, and this velocity offset decreases up to 1200 km s-1 towards to North-West. The Hi absorber which has a velocity closest to the underlying emission, Hi-R, does not have a strong velocity gradient across the major axis. However, the most blue shifted absorber, Hi-B is blue-shifted from the underlying emission by 700 km s-1 with a velocity field that apparently mirrors that of the underlying Gaussian profile. To highlight these differences, we extract the dynamics through a pseudo-slit from the major kinematic axis of the halo and show this in Fig. 5.
Turning to the column density maps, Fig. 4 shows that both of the Hi columns are remarkably uniform (although at two distinct velocities), with both remaining as single systems of the full extent of the Ly emission. The spatial and kinematic coherence of the absorbers suggest they may be physically distinct from the background source. Using the column densities and sizes, the total neutral mass of Hi-B and Hi-R are M 109 M⊙ and M 105 M⊙. The total hydrogen mass of the absorber depends on the ionisation state. Photoionisation models of absorption systems with column densities in the range (Hi) = 1019-20 cm-2 suggest average IGM neutral fractions at = 4 of 1.5–10 (McQuinn et al., 2011). Of course, these values may represent upper limits in an over-dense region which self-shields from UV radiation. Nevertheless, this suggests a total mass for the most massive absorber, Hi-B of 1010 M⊙.
3.3.1 Inflow or Outflow?
Previous observations of high-redshift radio galaxies have identified very strong (high column density) absorbers seen against the Ly profiles (Hippelein & Meisenheimer, 1993; van Ojik et al., 1997; Humphrey et al., 2007). The interpretation of this absorption is the fortuitous alignment with the intervening Ly forest absorption, which may be enhanced in the biased regions around massive, high-redshift galaxies. Whilst the properties of absorbing halos around radio galaxies have been studied in detail, most studies have been limited to (either) low resolution spectra and / or integrated spectra, but where it has been possible to spatially resolve the absorption, the implied covering factor is close to unity – on scales from 10–50 kpc – and the inferred mass of the neutral phase is 107–108 M⊙. The absorbers also appear to be ubiquitous when seen against radio quiet galaxies, such as the giant “Ly blobs” (LABs) at = 3.1 which have also been studied in detail (Matsuda et al., 2011) (we note that the other absorber in this field also shows a strong, spatially extended absorber in the MUSE data; Urrutia et al. in prep). For example, Matsuda et al. (2006) find that the fraction of LABs with absorbers seen against the Ly emission is 83%. However, the nature of the absorbing gas remains poorly understood even when two-dimensional spectra are available. In particular, two-dimensional spectra are required to test whether the neutral gas is likely to be in-falling or out-flowing. With sufficient signal to noise and spectral (and spatial) resolution the spatially resolved dynamics of the neutral gas provided by MUSE, and its relation to the (underlying) emission should allow us to distinguish between infall and outflow, and we consider both possibilities here.
In a scenario in which the absorber(s) around TNJ 1338 arise due to foreground material, the giant Ly halo only provides the background (illuminating) screen from which the absorbers are decoupled. In this case, the coherence of absorbers may suggest we are seeing a sheet (or filament) with a projected separations from the radio galaxy of 4 Mpc and 1Mpc (assuming a Hubble constant at = 4.1 of H() = 423 km s-1 Mpc). The low column density absorber, Hi-R is presumably within the virial radius of the halo associated with the radio galaxy since the velocity offset places it within 1 Mpc of the galaxy.
Whilst this interpretation is appealing since high density IGM is expected to be seen around massive galaxies, there are a number of problems with this inflow model. First, the Hi appear to be enriched, although this does not preclude them being unassociated with the radio galaxy, especially in an over-dense (biased) region. Second, the velocity structure of the underlying Ly emission (which has an average velocity gradient across the halo of dv / dR 4 km s-1 kpc-1) is mirrored by Hi-B (dv / dR 3 km s-1 kpc-1) strongly suggesting that the material associated with Hi-B originated in the Ly halo (which would then naturally explain the similarity in the Ly and Civ line profiles). Third, across the halo, the low density absorber, Hi-R, has a median Doppler -parameter of = 170 3 km s-1. We can test if this is “typical” of Ly absorbers by using quasar sight lines. Fechner & Reimers (2007) and Schaye et al. (2000) derive column density and Doppler parameters for neutral hydrogen in the Ly forest at = 2–4.5. In total, they detect 1500 absorbers with columns between log (Hi / cm-2) = 12–17 and = 5–200 km s-2. Cutting their sample to the same median column density as seen in Hi-R, log (Hi / cm-2) = 14.5, the median Doppler parameter is = 30 1 km s-1, a factor 5.5 0.4 lower (for the same median column density) as that seen in Hi-R. Thus, it appears that the low column density absorber seen against the halo of TNJ 1338 does not have the properties expected for simply being “average” IGM, but instead has a much higher velocity width.
A more natural explanation for the absorbers is therefore that Hi-B represents the out-flowing material swept up in a wind shell ejected from the host galaxy and Hi-R is the low density material between this shell and the host. Galactic scale outflows from high-redshift galaxies, driven by the collective effects of star-formation and supernovae winds (e.g. Pettini et al., 2002; Bower et al., 2004; Erb et al., 2006; Swinbank et al., 2007, 2009; Steidel et al., 2010; Martin et al., 2012; Newman et al., 2012) and / or AGN (e.g. Nesvadba et al., 2007; Alexander et al., 2010; Martin et al., 2012; Harrison et al., 2012, 2014; Genzel et al., 2014) have been studied for some time and outflow velocities reaching 1000 km s-1 in the ionised gas spread over tens of kilo-parsecs.
Can we explain the properties of the absorbers in such a model? Numerical models can be used to trace the evolution of the ISM following the energy injection into an ambient medium, thus making predictions for the effect of a starburst or AGN-driven wind on the ISM. For example, Krause (2005) use a hydro-dynamic code to model a galactic wind (due to star formation and supernova) on the ISM of a host galaxy and superimpose an AGN-driven jet. Assuming the wind starts long before the jet activity, the starburst first drives the wind in to a radiative bow shock, which then cools and is seen in Ly absorption. When the jet reaches the shell, it may destroys it (at least partially) so that the larger sources are no longer absorbed (the shell eventually cools and fragments to form globular clusters). In this model, the power required to drive the wind is approximately L 5 1043 erg / s ( / 200 km s-1)4 ( / 25 kpc). For the outflow in TNJ 1338, with 1000 km s-1 and 200 kpc, L 1 1046 erg s-1. Although this calculation should be considered approximate, the luminosity required to drive the shell is consistent with the AGN luminosity of TNJ 1338, L 2 1046 erg s-1 (Drouart et al., 2014).
Another approach is to consider the energy of the AGN (or star formation) and the likely time-scales involved. Assuming the outflow in TNJ 1338 is a coherent structure, the mass swept up in the shell must be of order 1010 M⊙ (for a neutral fraction of 10%) and it will have a kinetic energy of 1059 erg (assuming a spherical shell with mass 1010 M⊙ moving at 1200 km s-1 with respect to the galaxy). If the shell is located a minimum of 200 kpc from the radio galaxy (this minimum being set by the spatial extent of the Ly halo and coherence of the absorber), then the minimum lifetime of the outflow is 100 Myr. Considering the AGN luminosity of this source, L 2 1046 erg s-1 and a minimum timescale of 100 Myr, the total energy available is 5 1061 erg. Alternatively, considering star formation as the energy injection mechanism and assuming supernovae provide 1049 erg per solar mass of stars formed, the energy provided by SNe will be 1060 erg. Thus energetically, this star-formation or AGN could drive the wind if they are able to couple 10% of their energy to the wind (and the energy in the wind should be considered a lower limit since the galaxy–shell distance is a lower limit).
We can also compare the mass in the absorber to the total ISM mass of the host galaxy. Fitting a modified black-body to the Herschel 250–500m, SCUBA 850m and MAMBO 1.2 mm photometry of this galaxy (De Breuck et al., 2004; Drouart et al., 2014), adopting a dust emissivity of of = 1.5–2.0 (Magnelli et al., 2012) and dust mass absorption coefficient of = 0.15 m2 kg-1 (Weingartner & Draine, 2001), we estimate a cold dust mass of M 3 108 M⊙. For a dust-to-gas ratio of = 90 (Bothwell et al., 2013; Swinbank et al., 2014), this suggests a H2 mass of M 3 1010 M⊙, which is comparable to that estimated for other HzRGs (Emonts et al., 2014; Miley & De Breuck, 2008). We caution that there is a factor 3–4 uncertainty on this value due to the (moderately low) signal-to-noise of the 850 m and 1.2 mm detections (and upper limits on the 250, 350 and 500 m photometry), the choice of dust model parameters, and the uncertainty in the adopted dust-to-gas ratio. Nevertheless, the H2 mass of the ISM in the radio galaxy is similar to that estimated for the total mass of the two structures we see in absorption against the halo.
Will the gas escape the halo potential? If we consider a 1011 M⊙ galaxy inside a dark halo with mass 1013–1014 with NFW (Navarro et al., 1997) density profile, the gas would require a velocity greater than 1000 km s-1 to escape the halo (see also the calculation in Harrison et al. 2012). This is similar to the velocity seen in Hi-B. However, some models have suggested that even massive outflows may stall in the galaxy halo (or in this case, the “group” halo), and re-collapse and cool at later times (along with new fuel supplies), resulting in re-ignition of star formation and further black-hole growth (e.g. Lagos et al., 2008; Gabor et al., 2011; Hopkins et al., 2013), especially in group/cluster (or proto-cluster) environments (McCarthy et al., 2011).
In summary, while it is not possible to constrain definitively whether the AGN or star-formation have driven the outflow, or the ultimate fate of out-flowing gas, it appears that the Hi absorbers are associated with activity occurring within the galaxy, and with outflow properties (high velocity, spatially extended, and mass loaded) in broad agreement with the requirements of models that invoke AGN-driven outflows to regulate star formation and black-hole growth in luminous AGN (Di Matteo et al., 2005; Hopkins & Elvis, 2010; Debuhr et al., 2012). Even if the outflow does not escape the galaxy halos, it may have sufficient energy to heat the halo and control the level of cooling in massive halos at later times (e.g. Churazov et al., 2005; Gabor et al., 2011; McCarthy et al., 2011; Bower et al., 2012).
4 Conclusions
We have used the MUSE integral field spectrograph to study the giant Ly has around the high-redshift radio galaxy TNJ 1338 at = 4.11. Our main observations reveal the following:
Our observations map the intensity distribution and dynamics of the Ly halo which is extended over a region approximately 150 80 kpc. In comparison, the radio jets are confined to the central 10 kpc of the halo, although the alignment of the extended Ly halo and radio jets may be indicative of previous AGN activity (which ionised the extended halo and which is now seen in Ly emission as the gas cools).
The spatial extent of the Ly halo in TNJ J1338 is one of the largest seen in high-redshift radio galaxies. We clearly detect the Civ emission in the extended halo suggesting that the gas in the extended is enriched.
Across the entire halo, the Ly emission line appears asymmetric. The line profile is best-fit by two H-i absorbers superimposed on an underlying Gaussian emission profile. One of the striking results from our MUSE observations is the coherence and spatial extent of both absorbers. Indeed, both absorbers have a covering factor of unity. The first absorber, Hi-B appears blue-shifted from the (underlying) Gaussian emission line profile by 700 km s-1 and has a column density of (Hi) 1019.3 cm-2. Since the velocity structure of this absorber follows that of the underlying emission, this material is most likely associated with an out-flowing shell of material, and we estimate the mass in the shell must be of order 1010 M⊙. By comparison to the AGN luminosity or star-formation rate of the galaxy, we find that both could trivially drive the wind if they are able to couple 10% of their energy to the wind. The second absorber, Hi-R is much closer to the underlying halo emission, 200 km s-1 but has a much lower column density, (Hi) 1014.5 cm-2. The Doppler parameter for this absorber is 6 higher than expected for the low-density IGM (at the same column density), suggesting that this is not just a typical intergalactic absorber, but instead that this material represents the low-density IGM between the out-flowing shell and the Ly halo. We show that the energetics of the star-formation or AGN could drive the outflow if it is able to couple a small fraction of the energy to the gas.
The underlying Gaussian emission line profile shows a velocity gradient of 700 km s-1 across the 150 kpc in projection. At the position of the galaxy, the Ly is blue-shifted by 150 km s-1 from the systemic. The velocity dispersion profile of the underlying emission (which has an average value of = 570 13 km s-1) is peaked at the position of the radio galaxy and the radio-jets, which may reflect the interaction of the radio plasma and the gas.
We identify two other = 4.1 emitters in the field of the radio galaxy which are presumably associated with the group/cluster within this over-density. We also serendipitously identify a new giant Ly halo at = 3.31 approximately 30′′ to the south west of TNJ J1338 which appears to be associated with a number of other star-forming galaxies and AGN at this redshift.
Finally, we can consider how the galaxy and outflow may evolve towards the present day. The out-flowing shell will be both thermally and gravitationally unstable, and will eventually fragment. At this point, the covering factor will decrease and the absorption will vanish (which would explain why no absorbers are seen in the halos of radio galaxies with jet activity 50 kpc scales; Röttgering & Pentericci 1999). The Jeans mass in the shell will be of order 106 M⊙ (Krause, 2002). Hence the shell will fragment and form stars in globular clusters of this mass. Of course, at this point the shell should become visible in the rest-frame UV / optical as young stars form (which will also increase the ionisation of the remaining parts of the shell). Assuming an efficiency of 10%, this shell will contain a 1000 globular clusters of this mass – in reasonable agreement with the number of clusters found in nearby brightest cluster galaxies (Harris et al., 1998) which show excess of globular clusters systems compared to non-BCGs of comparable luminosity.
In summary, the most successful models of galaxy formation increasingly require outflows of gas to expel gas from galaxies at early times. In the most massive galaxies, most of the energy injection is believed to arise from the central AGN, making high-redshift radio galaxies, which have many of the characteristics expected for the progenitors of todays massive Ellipticals, strong candidates to empirically constrain the properties of outflows which can be used to test the models. The discovery of high-velocity ( 1000 km s-1), halo-scale (i.e. 150kpc) and mass loaded winds in the vicinity of the central radio source are broadly in agreement with the requirements of models that invoke AGN-driven outflows to regulate star formation and black-hole growth in luminous AGN (Di Matteo et al., 2005; Hopkins & Elvis, 2010; Debuhr et al., 2012).
Acknowledgments
We thank the referee for the constructive report on this paper and Yuichi Matsuda, Michele Fumagalli and Tom Theuns for useful discussions. We would also like to thank the pipeline developers for the data reduction package. AMS gratefully acknowledges an STFC Advanced Fellowship through grant number ST/H005234/1 and the Leverhume foundation. IRS acknowledges support from STFC (ST/I001573/1), the ERC Advanced Investigator programme DUSTYGAL 321334 and a Royal Society/Wolfson Merit Award. RB acknowledges support from the ERC advanced grant 339659-MUSICOS. BPV acknowledges funding through ERC grant “Cosmic Dawn”. This publication uses data taken from the MUSE science verification programme 60.A-9318 and commissioning run 060.A-9100. All of the data used in this paper is available through the ESO science archive.
References
- Adam et al. (1997) Adam, G., Rocca-Volmerange, B., Gerard, S., Ferruit, P., & Bacon, R. 1997, A&A, 326, 501
- Adams et al. (2009) Adams, J. J., Hill, G. J., & MacQueen, P. J. 2009, ApJ, 694, 314
- Adams (1975) Adams, T. F. 1975, ApJ, 201, 350
- Alexander et al. (2010) Alexander, D. M., Swinbank, A. M., Smail, I., McDermid, R., & Nesvadba, N. P. H. 2010, MNRAS, 402, 2211
- Benson et al. (2003) Benson, A. J., Bower, R. G., Frenk, C. S., Lacey, C. G., Baugh, C. M., & Cole, S. 2003, ApJ, 599, 38
- Binette et al. (2000) Binette, L., Kurk, J. D., Villar-Martín, M., & Röttgering, H. J. A. 2000, A&A, 356, 23
- Binette et al. (2006) Binette, L., Wilman, R. J., Villar-Martín, M., Fosbury, R. A. E., Jarvis, M. J., & Röttgering, H. J. A. 2006, A&A, 459, 31
- Booth & Schaye (2010) Booth, C. M. & Schaye, J. 2010, MNRAS, 405, L1
- Bothwell et al. (2013) Bothwell, M. S., Smail, I., Chapman, S. C., Genzel, R., Ivison, R. J., Tacconi, L. J., Alaghband-Zadeh, S., & Bertoldi, F. et al. 2013, MNRAS, 429, 3047
- Bower et al. (2012) Bower, R. G., Benson, A. J., & Crain, R. A. 2012, MNRAS, 422, 2816
- Bower et al. (2006) Bower, R. G., Benson, A. J., Malbon, R., Helly, J. C., Frenk, C. S., Baugh, C. M., Cole, S., & Lacey, C. G. 2006, MNRAS, 370, 645
- Bower et al. (2004) Bower, R. G., Morris, S. L., Bacon, R., Wilman, R. J., Sullivan, M., Chapman, S., Davies, R. L., de Zeeuw, P. T., & Emsellem, E. 2004, MNRAS, 351, 63
- Cantalupo et al. (2014) Cantalupo, S., Arrigoni-Battaia, F., Prochaska, J. X., Hennawi, J. F., & Madau, P. 2014, Nature, 506, 63
- Churazov et al. (2005) Churazov, E., Sazonov, S., Sunyaev, R., Forman, W., Jones, C., & Böhringer, H. 2005, MNRAS, 363, L91
- Croton et al. (2006) Croton, D. J., Springel, V., White, S. D. M., De Lucia, G., Frenk, C. S., Gao, L., Jenkins, A., Kauffmann, G., Navarro, J. F., & Yoshida, N. 2006, MNRAS, 365, 11
- De Breuck et al. (2004) De Breuck, C., Bertoldi, F., Carilli, C., Omont, A., Venemans, B., Röttgering, H., Overzier, R., Reuland, M., Miley, G., Ivison, R., & van Breugel, W. 2004, A&A, 424, 1
- De Breuck et al. (1999) De Breuck, C., van Breugel, W., Minniti, D., Miley, G., Röttgering, H., Stanford, S. A., & Carilli, C. 1999, A&A, 352, L51
- De Breuck et al. (2002) De Breuck, C., van Breugel, W., Stanford, S. A., Röttgering, H., Miley, G., & Stern, D. 2002, AJ, 123, 637
- Debuhr et al. (2012) Debuhr, J., Quataert, E., & Ma, C.-P. 2012, MNRAS, 420, 2221
- Dekel et al. (2009) Dekel, A., Birnboim, Y., Engel, G., Freundlich, J., Goerdt, T., Mumcuoglu, M., Neistein, A., & Pichon, C et al. 2009, Nature, 457, 451
- Di Matteo et al. (2005) Di Matteo, T., Springel, V., & Hernquist, L. 2005, Nature, 433, 604
- Dijkstra et al. (2006) Dijkstra, M., Haiman, Z., & Spaans, M. 2006, ApJ, 649, 14
- Drouart et al. (2014) Drouart, G., De Breuck, C., Vernet, J., Seymour, N., Lehnert, M., Barthel, P., Bauer, F. E., Ibar, E., Galametz, A., Haas, M., Hatch, N., Mullaney, J. R., Nesvadba, N., Rocca-Volmerange, B., Röttgering, H. J. A., Stern, D., & Wylezalek, D. 2014, A&A, 566, A53
- Emonts et al. (2014) Emonts, B. H. C., Norris, R. P., Feain, I., Mao, M. Y., Ekers, R. D., Miley, G., Seymour, N., Röttgering, H. J. A., Villar-Martín, M., Sadler, E. M., Carilli, C. L., Mahony, E. K., de Breuck, C., Stroe, A., Pentericci, L., van Moorsel, G. A., Drouart, G., Ivison, R. J., Greve, T. R., Humphrey, A., Wylezalek, D., & Tadhunter, C. N. 2014, MNRAS, 438, 2898
- Erb et al. (2006) Erb, D. K., Steidel, C. C., Shapley, A. E., Pettini, M., Reddy, N. A., & Adelberger, K. L. 2006, ApJ, 647, 128
- Fabian (1999) Fabian, A. C. 1999, MNRAS, 308, L39
- Fardal et al. (2001) Fardal, M. A., Katz, N., Gardner, J. P., Hernquist, L., Weinberg, D. H., & Davé, R. 2001, ApJ, 562, 605
- Fechner & Reimers (2007) Fechner, C. & Reimers, D. 2007, A&A, 461, 847
- Gabor et al. (2011) Gabor, J. M., Davé, R., Oppenheimer, B. D., & Finlator, K. 2011, MNRAS, 417, 2676
- Geach et al. (2009) Geach, J. E., Alexander, D. M., Lehmer, B. D., Smail, I., Matsuda, Y., Chapman, S. C., Scharf, C. A., Ivison, R. J., Volonteri, M., Yamada, T., Blain, A. W., Bower, R. G., Bauer, F. E., & Basu-Zych, A. 2009, ApJ, 700, 1
- Genzel et al. (2014) Genzel, R., Förster Schreiber, N. M., Rosario, D., Lang, P., Lutz, D., Wisnioski, E., Wuyts, E., & et al., W. 2014, ApJ, 796, 7
- Granato et al. (2004) Granato, G. L., De Zotti, G., Silva, L., Bressan, A., & Danese, L. 2004, ApJ, 600, 580
- Harris et al. (1998) Harris, W. E., Harris, G. L. H., & McLaughlin, D. E. 1998, AJ, 115, 1801
- Harrison et al. (2014) Harrison, C. M., Alexander, D. M., Mullaney, J. R., & Swinbank, A. M. 2014, MNRAS, 441, 3306
- Harrison et al. (2012) Harrison, C. M., Alexander, D. M., Swinbank, A. M., Smail, I., Alaghband-Zadeh, S., Bauer, F. E., Chapman, S. C., Del Moro, A., Hickox, R. C., Ivison, R. J., Menéndez-Delmestre, K., Mullaney, J. R., & Nesvadba, N. P. H. 2012, MNRAS, 426, 1073
- Hippelein & Meisenheimer (1993) Hippelein, H. & Meisenheimer, K. 1993, Nature, 362, 224
- Hopkins et al. (2008) Hopkins, P. F., Cox, T. J., Kereš, D., & Hernquist, L. 2008, ApJS, 175, 390
- Hopkins & Elvis (2010) Hopkins, P. F. & Elvis, M. 2010, MNRAS, 401, 7
- Hopkins et al. (2006) Hopkins, P. F., Hernquist, L., Cox, T. J., Robertson, B., & Springel, V. 2006, ApJS, 163, 50
- Hopkins et al. (2013) Hopkins, P. F., Kereš, D., Murray, N., Hernquist, L., Narayanan, D., & Hayward, C. C. 2013, MNRAS, 433, 78
- Humphrey et al. (2009) Humphrey, A., Iwamuro, F., Villar-Martín, M., Binette, L., & Sung, E. C. 2009, MNRAS, 399, L34
- Humphrey et al. (2007) Humphrey, A., Villar-Martín, M., Fosbury, R., Binette, L., Vernet, J., De Breuck, C., & di Serego Alighieri, S. 2007, MNRAS, 375, 705
- Krause (2002) Krause, M. 2002, A&A, 386, L1
- Krause (2005) —. 2005, A&A, 436, 845
- Lagos et al. (2008) Lagos, C. D. P., Cora, S. A., & Padilla, N. D. 2008, MNRAS, 388, 587
- Magnelli et al. (2012) Magnelli, B., Lutz, D., Santini, P., Saintonge, A., Berta, S., Albrecht, M., Altieri, B., & Andreani, P. et al. 2012, A&A, 539, A155
- Martin et al. (2012) Martin, C. L., Shapley, A. E., Coil, A. L., Kornei, K. A., Bundy, K., Weiner, B. J., Noeske, K. G., & Schiminovich, D. 2012, ApJ, 760, 127
- Martin et al. (2014) Martin, D. C., Chang, D., Matuszewski, M., Morrissey, P., Rahman, S., Moore, A., Steidel, C. C., & Matsuda, Y. 2014, ApJ, 786, 107
- Matsuda et al. (2006) Matsuda, Y., Yamada, T., Hayashino, T., Yamauchi, R., & Nakamura, Y. 2006, ApJL, 640, L123
- Matsuda et al. (2011) Matsuda, Y., Yamada, T., Hayashino, T., Yamauchi, R., Nakamura, Y., Morimoto, N., Ouchi, M., Ono, Y., Kousai, K., Nakamura, E., Horie, M., Fujii, T., Umemura, M., & Mori, M. 2011, MNRAS, 410, L13
- Matsuda et al. (2012) Matsuda, Y., Yamada, T., Hayashino, T., Yamauchi, R., Nakamura, Y., Morimoto, N., Ouchi, M., Ono, Y., Umemura, M., & Mori, M. 2012, MNRAS, 425, 878
- McCarthy et al. (2011) McCarthy, I. G., Schaye, J., Bower, R. G., Ponman, T. J., Booth, C. M., Dalla Vecchia, C., & Springel, V. 2011, MNRAS, 412, 1965
- McCarthy et al. (1990) McCarthy, P. J., Spinrad, H., Dickinson, M., van Breugel, W., Liebert, J., Djorgovski, S., & Eisenhardt, P. 1990, ApJ, 365, 487
- McCarthy et al. (1991) McCarthy, P. J., van Breugel, W., & Kapahi, V. K. 1991, ApJ, 371, 478
- McQuinn et al. (2011) McQuinn, M., Oh, S. P., & Faucher-Giguère, C.-A. 2011, ApJ, 743, 82
- Miley & De Breuck (2008) Miley, G. & De Breuck, C. 2008, A&Arev, 15, 67
- Miley et al. (2004) Miley, G. K., Overzier, R. A., Tsvetanov, Z. I., Bouwens, R. J., Benítez, N., Blakeslee, J. P., Ford, H. C., Illingworth, G. D., Postman, M., Rosati, P., Clampin, M., Hartig, G. F., Zirm, A. W., Röttgering, H. J. A., Venemans, B. P., Ardila, D. R., Bartko, F., Broadhurst, T. J., Brown, R. A., Burrows, C. J., Cheng, E. S., Cross, N. J. G., De Breuck, C., Feldman, P. D., Franx, M., Golimowski, D. A., Gronwall, C., Infante, L., Martel, A. R., Menanteau, F., Meurer, G. R., Sirianni, M., Kimble, R. A., Krist, J. E., Sparks, W. B., Tran, H. D., White, R. L., & Zheng, W. 2004, Nature, 427, 47
- Navarro et al. (1997) Navarro, J. F., Frenk, C. S., & White, S. D. M. 1997, ApJ, 490, 493
- Nelan et al. (2005) Nelan, J. E., Smith, R. J., Hudson, M. J., Wegner, G. A., Lucey, J. R., Moore, S. A. W., Quinney, S. J., & Suntzeff, N. B. 2005, ApJ, 632, 137
- Nesvadba et al. (2007) Nesvadba, N. P. H., Lehnert, M. D., De Breuck, C., Gilbert, A., & van Breugel, W. 2007, A&A, 475, 145
- Newman et al. (2012) Newman, S. F., Genzel, R., Förster-Schreiber, N. M., Shapiro Griffin, K., Mancini, C., Lilly, S. J., Renzini, A., & Bouché, N. et al. 2012, ApJ, 761, 43
- Nilsson et al. (2006) Nilsson, K. K., Fynbo, J. P. U., Møller, P., Sommer-Larsen, J., & Ledoux, C. 2006, A&A, 452, L23
- Ohyama & Taniguchi (2004) Ohyama, Y. & Taniguchi, Y. 2004, AJ, 127, 1313
- Pettini et al. (2002) Pettini, M., Rix, S. A., Steidel, C. C., Hunt, M. P., Shapley, A. E., & Adelberger, K. L. 2002, APSS, 281, 461
- Röttgering & Pentericci (1999) Röttgering, H. & Pentericci, L. 1999, in The Most Distant Radio Galaxies, ed. H. J. A. Röttgering, P. N. Best, & M. D. Lehnert, 85
- Rottgering et al. (1995) Rottgering, H. J. A., Hunstead, R. W., Miley, G. K., van Ojik, R., & Wieringa, M. H. 1995, MNRAS, 277, 389
- Sánchez & Humphrey (2009) Sánchez, S. F. & Humphrey, A. 2009, A&A, 495, 471
- Schaye et al. (2000) Schaye, J., Theuns, T., Rauch, M., Efstathiou, G., & Sargent, W. L. W. 2000, MNRAS, 318, 817
- Silk & Rees (1998) Silk, J. & Rees, M. J. 1998, A&A, 331, L1
- Smail & Blundell (2013) Smail, I. & Blundell, K. M. 2013, MNRAS, 434, 3246
- Springel et al. (2005) Springel, V., Di Matteo, T., & Hernquist, L. 2005, MNRAS, 361, 776
- Springel & Hernquist (2003) Springel, V. & Hernquist, L. 2003, MNRAS, 339, 312
- Steidel et al. (2010) Steidel, C. C., Erb, D. K., Shapley, A. E., Pettini, M., Reddy, N., Bogosavljević, M., Rudie, G. C., & Rakic, O. 2010, ApJ, 717, 289
- Swinbank et al. (2007) Swinbank, A. M., Bower, R. G., Smith, G. P., Wilman, R. J., Smail, I., Ellis, R. S., Morris, S. L., & Kneib, J.-P. 2007, MNRAS, 376, 479
- Swinbank et al. (2014) Swinbank, A. M., Simpson, J. M., Smail, I., Harrison, C. M., Hodge, J. A., Karim, A., Walter, F., & Alexander, D. M. et al. 2014, MNRAS, 438, 1267
- Swinbank et al. (2009) Swinbank, A. M., Webb, T. M., Richard, J., Bower, R. G., Ellis, R. S., Illingworth, G., Jones, T., & Kriek, M. et al. 2009, MNRAS, 400, 1121
- Tadhunter et al. (2000) Tadhunter, C. N., Villar-Martin, M., Morganti, R., Bland-Hawthorn, J., & Axon, D. 2000, MNRAS, 314, 849
- Taniguchi et al. (2001) Taniguchi, Y., Shioya, Y., & Kakazu, Y. 2001, ApJL, 562, L15
- van Breugel et al. (1998) van Breugel, W. J. M., Stanford, S. A., Spinrad, H., Stern, D., & Graham, J. R. 1998, ApJ, 502, 614
- van Ojik et al. (1996) van Ojik, R., Roettgering, H. J. A., Carilli, C. L., Miley, G. K., Bremer, M. N., & Macchetto, F. 1996, A&A, 313, 25
- van Ojik et al. (1997) van Ojik, R., Roettgering, H. J. A., Miley, G. K., & Hunstead, R. W. 1997, A&A, 317, 358
- Venemans et al. (2002) Venemans, B. P., Kurk, J. D., Miley, G. K., Röttgering, H. J. A., van Breugel, W., Carilli, C. L., De Breuck, C., Ford, H., Heckman, T., McCarthy, P., & Pentericci, L. 2002, ApJL, 569, L11
- Venemans et al. (2007) Venemans, B. P., Röttgering, H. J. A., Miley, G. K., van Breugel, W. J. M., de Breuck, C., Kurk, J. D., Pentericci, L., Stanford, S. A., Overzier, R. A., Croft, S., & Ford, H. 2007, A&A, 461, 823
- Villar-Martín et al. (2007a) Villar-Martín, M., Humphrey, A., De Breuck, C., Fosbury, R., Binette, L., & Vernet, J. 2007a, MNRAS, 375, 1299
- Villar-Martín et al. (2007b) Villar-Martín, M., Sánchez, S. F., Humphrey, A., Dijkstra, M., di Serego Alighieri, S., De Breuck, C., & González Delgado, R. 2007b, MNRAS, 378, 416
- Villar-Martín et al. (2003) Villar-Martín, M., Vernet, J., di Serego Alighieri, S., Fosbury, R., Humphrey, A., & Pentericci, L. 2003, MNRAS, 346, 273
- Weijmans et al. (2010) Weijmans, A.-M., Bower, R. G., Geach, J. E., Swinbank, A. M., Wilman, R. J., de Zeeuw, P. T., & Morris, S. L. 2010, MNRAS, 402, 2245
- Weilbacher et al. (2014) Weilbacher, P. M., Streicher, O., Urrutia, T., Pécontal-Rousset, A., Jarno, A., & Bacon, R. 2014, in Astronomical Society of the Pacific Conference Series, Vol. 485, Astronomical Data Analysis Software and Systems XXIII, ed. N. Manset & P. Forshay, 451
- Weingartner & Draine (2001) Weingartner, J. C. & Draine, B. T. 2001, ApJ, 548, 296
- Wilman et al. (2005) Wilman, R. J., Gerssen, J., Bower, R. G., Morris, S. L., Bacon, R., de Zeeuw, P. T., & Davies, R. L. 2005, Nature, 436, 227
- Wilman et al. (2004) Wilman, R. J., Jarvis, M. J., Röttgering, H. J. A., & Binette, L. 2004, MNRAS, 351, 1109
- Yang et al. (2014) Yang, Y., Zabludoff, A., Jahnke, K., & Davé, R. 2014, ApJ, 793, 114
- Yang et al. (2011) Yang, Y., Zabludoff, A., Jahnke, K., Eisenstein, D., Davé, R., Shectman, S. A., & Kelson, D. D. 2011, ApJ, 735, 87