11email: oskari@phy.hr 22institutetext: Núcleo de Astronomía, Facultad de Ingeniería, Universidad Diego Portales, Av. Ejército 441, Santiago, Chile 33institutetext: Argelander-Institut für Astronomie, Universität Bonn, Auf dem Hügel 71, D-53121 Bonn, Germany 44institutetext: Spitzer Science Center, 314-6 Caltech, Pasadena, CA 91125, USA 55institutetext: Astronomy Department, Cornell University, 220 Space Sciences Building, Ithaca, NY 14853, USA 66institutetext: Institute d’Astrophysique de Paris, UMR7095 CNRS, Université Pierre et Marie Curie, 98 bis Boulevard Arago, 75014 Paris, France 77institutetext: Aix Marseille Université, CNRS, LAM (Laboratoire d’Astrophysique de Marseille) UMR 7326, 13388, Marseille, France 88institutetext: Institut de RadioAstronomie Millimétrique, 300 rue de la Piscine, Domaine Universitaire, 38406 Saint Martin d’Hères, France 99institutetext: Scuola Normale Superiore, Piazza dei Cavalieri 7, I-56126 Pisa, Italy 1010institutetext: 23, rue d’Yerres, 91230 Montgeron, France 1111institutetext: National Optical Astronomy Observatory, 950 North Cherry Avenue, Tucson, AZ 85719, USA 1212institutetext: Max-Planck-Institut für extraterrestrische Physik, Giessenbachstrasse 1, D-85748 Garching bei München, Germany 1313institutetext: Institute for Astronomy, University of Hawaii, 2680 Woddlawn Drive, Honolulu, HI, 96822 1414institutetext: Max-Planck-Institut für Astronomie, Königstuhl 17, 69117 Heidelberg, Germany 1515institutetext: National Radio Astronomy Observatory/NAASC, 520 Edgemont Road, Charlottesville, VA 22903, USA
(Sub)millimetre interferometric imaging of a sample of COSMOS/AzTEC submillimetre galaxies – I. Multiwavelength identifications and redshift distribution††thanks: Based on observations carried out with the IRAM Plateau de Bure Interferometer. IRAM is supported by INSU/CNRS (France), MPG (Germany), and IGN (Spain).
We used the Plateau de Bure Interferometer (PdBI) to map a sample of 15 submillimetre galaxies (SMGs) in the COSMOS field at the wavelength of 1.3 mm. The target SMGs were originally discovered in the James Clerk Maxwell Telescope (JCMT)/AzTEC 1.1 mm continuum survey at . This paper presents, for the first time, interferometric millimetre-wavelength observations of these sources. The angular resolution of our observations, , allowed us to accurately determine the positions of the target SMGs. Using a detection threshold of regardless of multiwavelength counterpart association, and if a multiwavelength counterpart within is also present, the total number of detections in our survey is 22. The most significant PdBI detection of is towards AzTEC19. Three of our detected SMGs (AzTEC21, 27, and 28; which corresponds to ) are marginally resolved at our angular resolution, and these sources are found to have elongated or clumpy morphologies and/or multiple components. Using optical to near-infrared photometric redshifts, available spectroscopic redshifts, and redshifts estimated from the radio-to-submm spectral index we infer a median redshift of for our sample. To study the overall multiplicity and redshift distribution of flux-limited samples of SMGs we combined these sources with the 15 brightest JCMT/AzTEC SMGs detected at 1.1 mm, AzTEC1–15, and studied previously. This constitutes a complete, flux- and S/N-limited 1.1-mm selected sample. We find that the median redshift for the 15 brightest JCMT/AzTEC SMGs () is consistent with that for AzTEC16–30. This conforms to recent observational findings that SMGs do not exhibit any significant trend between the redshift and (sub)mm flux density. For the combined AzTEC1–30 sample we derive a median redshift of , consistent with previous results based on mm-selected samples. We further infer that within the combined AzTEC1–30 sample of sources separate into multiple components.
Key Words.:
Galaxies: evolution – Galaxies: formation – Galaxies: starburst – Galaxies: star formation – Submillimetre: galaxies1 Introduction
When the first extragalactic submillimetre continuum surveys were carried out at the end of the 1990s, a population of heavily dust-obscured (i.e. optically faint) galaxies at high redshift was discovered (Smail et al. (1997); Hughes et al. (1998); Barger et al. (1998)). These sources are generally referred to as submillimetre galaxies or SMGs (see Blain et al. (2002); Casey et al. (2014) for reviews).
The bulk of SMGs are observed at redshifts (e.g. Chapman et al. (2005); Wardlow et al. (2011); Lindner et al. (2011); Casey et al. (2013); Simpson et al. (2014); Umehata et al. (2014)). However, the number of known high-redshift () SMGs has increased considerably in the past few years (e.g. Schinnerer et al. (2008); Daddi et al. 2009a ,b; Coppin et al. (2009); Riechers et al. (2010); Capak et al. (2011); Smolčić et al. (2011); Cox et al. (2011); Combes et al. (2012); Walter et al. (2012); Swinbank et al. (2012); Weiß et al. (2013); Smolčić et al. (2015)). The SMG with the highest spectroscopically confirmed redshift currently known is HFLS3 at (Riechers et al. (2013)), which demonstrates that these sources were already present when the universe was only Myr old (see the end of this section for our adopted cosmology).
Submillimetre galaxies have parent dark matter haloes – i.e. the sites of galaxy formation originating in the dark-matter-dominated density perturbations in the early universe (e.g. Benson (2010)) – with characteristic masses of M☉ (Blain et al. (2004); Swinbank et al. (2008); Hickox et al. (2012)). The physical properties of SMGs are found to be extreme. In particular, their very high infrared (IR; 8–1 000 m) luminosities of L☉ are indicative of extreme star formation rates (SFRs) of M☉ yr-1, making SMGs the most intense known starbursts in the universe. Observations of CO rotational transitions with upper rotational-energy levels of suggest H2 gas masses of M☉ in SMGs (e.g. Greve et al. (2005); Tacconi et al. (2006); Bothwell et al. (2013)), while CO() observations yield gas masses up to several times M☉ (Ivison et al. (2011); Riechers et al. (2011)). Submillimetre galaxies are therefore among the most gas-rich systems in the universe. For instance, the median value of M☉ (within a kpc radius) derived for SMGs studied by Greve et al. (2005) is about four times higher than in the most luminous local ultraluminous IR galaxies or ULIRGs (Solomon et al. (1997)). These authors also estimated that the typical gas-consumption timescale in SMGs is Myr, but they noted that if feedback processes slow down the star formation activity (i.e. negative feedback such as radiation pressure acting on dust, stellar winds, outflows, supernovae, and the associated turbulence), the above timescale can be significantly longer. The derived stellar masses in SMGs are typically in the range M☉ (e.g. Borys et al. (2005); Dye et al. (2008); Wardlow et al. (2011); Hainline et al. (2011); Michałowski et al. (2012); Simpson et al. (2014)). While some authors suggest that SMGs might predominantly constitute the high-mass end of the star-forming galaxies’ main sequence (the –SFR relationship) at (Michałowski et al. (2012)), a fair fraction certainly lies above it (e.g. Daddi et al. 2009a ).
Since SMGs are found to have very high SFRs, the question then arises as to which physical process(es) are responsible for these rates. It has been suggested that galaxy mergers can trigger a significant burst of star formation (e.g. Barnes & Hernquist (1991)). The basic idea behind this is that, when dynamical friction within a parent halo causes galaxies to collide, the dissipation of angular momentum during the process allows the gas to be funneled to the central region of the system. Numerical simulations have also demonstrated how gas inflows associated with gas-rich or “wet” mergers can feed vigorous star formation (Mihos & Hernquist (1996); Chakrabarti et al. (2008)). More recently, hydrodynamic simulations by Narayanan et al. (2010) uggested that SMGs can naturally form via galaxy mergers. From an observational point of view, this is supported by the clumpy or disturbed morphologies of SMGs and their complex kinematic signatures (e.g. Smail et al. (1998); Tacconi et al. (2008); Engel et al. (2010); Swinbank et al. 2011 ; Sharon et al. (2013); Riechers et al. (2013); Hung et al. (2013); Toft et al. (2014); Neri et al. (2014); Riechers et al. (2014); Chen et al. (2015)). Engel et al. (2010) concluded that most of the SMGs with IR luminosities of L☉ are probably major-merger systems [i.e. systems where the interacting galaxies have a mass ratio of (e.g. Casey et al. (2014))]. An alternative mechanism behind galaxy formation and the fuelling of their star formation is the accretion of gas from the intergalactic medium through filamentary structures (the so-called cold-mode accretion; Kereš et al. (2005), 2009; Dekel et al. (2009)). Cosmological hydrodynamic simulations performed by Davé et al. (2010) suggest that SMGs could generally obtain their gas reservoirs via such accretion processes (rather than through mergers). In these simulations, the galaxies often had complex morphologies and gas kinematics – signatures often interpreted as evidence of an ongoing merger. However, as a result of cold-mode accretion, an extended disk-like gas structure undergoing rotation is also expected, and some SMGs are indeed found to show such signatures (e.g. Carilli et al. (2010); Hodge et al. (2012); De Breuck et al. (2014)). Finally, we note that simulations suggest that during the course of their evolution, SMGs can exhibit properties that are reminiscent of both normal star-forming galaxies and vigorous starbursts (see Hayward et al. 2013a ,b)111When a galaxy is on the main sequence, it is often said to be a “normal” star-forming galaxy. In contrast, if the galaxy has a clearly enhanced SFR with respect to its stellar mass (i.e. outlier above the main sequence), it is defined to be a starburst galaxy (e.g. Magdis et al. (2011)).. For example, numerical simulations (Springel & Hernquist (2005)) have demonstrated that a disk-like structure can form soon after the merging of gas-rich galaxies because of the rapid cooling (see also Hopkins et al. (2009)). This conforms to the idea that SMGs are a heterogeneous galaxy population, probably caught at different stages of evolution.
As an SMG increases its gas reservoir (through whatever mechanism), its central supermassive black hole (SMBH) can accrete increasing amounts of gas, which is driven to the nuclear region (e.g. Granato et al. (2006)). Some SMGs can therefore host an active galactic nucleus (AGN) as revealed by deep X-ray observations (Alexander et al. (2003), 2005; Wang et al. (2013)). For example, Chapman et al. (2005) concluded that about 20–30% of radio-identified SMGs display AGN activity, and radio-detected SMGs indeed appear to have a higher AGN fraction than the general SMG population (Wang et al. (2013)). However, most of the bolometric IR luminosity of SMGs is found to originate in star formation activity (dust-reprocessed radiation) and not gas accretion onto the SMBH of an AGN. An important characteristic of these accreting central black holes is that they can influence the properties of their host galaxies through radiative and mechanical feedback. In particular, besides the exhaustion of the gas reservoir, AGN feedback can lead to the “quenching” or shut down of the star formation (e.g. Springel et al. (2005); Di Matteo et al. (2005); Hopkins et al. (2006)).
Another intriguing question is the role played by SMGs in galaxy evolution over cosmic time. It has been found that SMGs are promising candidates for the progenitors of the most massive, passive (i.e. with little or no ongoing star formation) elliptical galaxies seen in the present-day universe (e.g. Lilly et al. (1999); Swinbank et al. (2006); Fu et al. (2013); Toft et al. (2014); Simpson et al. (2014)). The existence of quiescent, red massive galaxies already at with old stellar populations indicates that these galaxies have experienced a short-lived starburst phase in their past (e.g. Renzini (2006); Capak et al. (2008); Coppin et al. (2010)). High-redshift () SMGs could well represent these galaxy precursors. Besides their physical characteristics, the strong clustering of SMGs is consistent with this evolutionary picture (Blain et al. (2004); Aravena et al. 2010a ). Toft et al. (2014) found compelling evidence that the evolution of the giant red-and-dead ellipticals observed in the nearby universe, starting from SMGs, goes through a transition stage manifested as compact quiescent galaxies at .
Before the physical properties of SMGs can be studied in detail, the position of the source giving rise to the (sub)mm continuum emission must be accurately determined. The source counterparts at other wavelengths can only be correctly identified if the exact location of the FIR/(sub)mm emission is known, which in practice requires the analysis of FIR or (sub)mm interferometric observations to achieve this goal (e.g. Frayer et al. (2000); Younger et al. (2007), 2008, 2009; Dannerbauer et al. (2008); Aravena et al. 2010b ; Smolčić et al. 2012a ,b; Karim et al. (2013); Hodge et al. (2013)). To date, however, only a few flux-limited SMG samples have been followed up with interferometers (Younger et al. (2007), 2009; Smolčić et al. 2012b ; Barger et al. (2012); Karim et al. (2013); Hodge et al. (2013)).
In this paper, we present the results of our intermediate-resolution () Plateau de Bure Interferometer (PdBI; Guilloteau et al. (1992)) 1.3 mm continuum imaging of a sample of 15 SMGs discovered by Scott et al. (2008) in the Cosmic Evolution Survey (COSMOS; Scoville et al. 2007a ) field. The good angular resolution of the present data allows us to accurately pinpoint source positions and match them with correct multiwavelength counterparts. Accurate SMG positions are needed for their targeted spectroscopic redshift measurements, and knowing the proper multiwavelength counterparts allows us to determine the photometric redshifts of the sources – a prerequisite for a rigorous analysis of the physical properties. After describing the source sample, observations, data reduction, and ancillary data in Sect. 2, the direct observational results and analysis are presented in Sect. 3. In Sect. 4, we present our analysis of the redshifts of our SMGs. We then discuss our results in Sect. 5, and a summary is given in Sect. 6.
In the present paper, we adopt a concordance cold dark matter (CDM) cosmology, with the Hubble constant km s-1 Mpc-1 [i.e. the reduced Hubble constant ], total (dark+luminous baryonic) matter density , and dark energy density (Spergel et al. (2007); Larson et al. (2011)). In this spatially flat universe, corresponds to a physical spatial scale of 8.04, 8.48, and 7.83 kpc at redshifts of , 2, and 3, respectively. The corresponding cosmic times are 5.94, 3.34, and 2.19 Gyr. Magnitudes in the present paper refer to the AB magnitude system (see Oke (1974)).
2 Observations, data, and data reduction
2.1 Source sample
Our new PdBI 1.3 mm observations, described in the next subsection, were made towards the SMGs listed in Table 1. These SMGs were originally discovered in the 1.1 mm continuum survey of a north-west subfield (0.15 deg2 in size) of the 2 deg2 COSMOS field by Scott et al. (2008). The survey was carried out with the Aztronomical Thermal Emission Camera, or the AzTEC bolometer array (Wilson et al. (2008)), on the 15 m James Clerk Maxwell Telescope (JCMT), and the target field was centred on a prominent large-scale structure traced by the galaxy overdensity (Scoville et al. 2007b ) that includes a massive ( M☉) galaxy cluster at a redshift of (Guzzo et al. (2007)). In total, Scott et al. (2008) reported 50 candidate SMGs with a detection signal-to-noise ratio S/N (see their Table 1).
While our PdBI observations targeted the COSMOS/AzTEC SMGs AzTEC16–30, the 15 brightest SMGs detected by Scott et al. (2008), i.e. AzTEC1–15 (S/N), had previously been imaged (and detected) with the Submillimetre Array (SMA) at 890 m ( angular resolution) by Younger et al. (2007, 2009). Spectroscopic and/or photometric redshifts have been assigned to them by Younger et al. (2007, 2009), Riechers et al. (2010), Capak et al. (2011), Smolčić et al. (2011, 2012b), and M. S. Yun et al. (in prep.). Combining these data with the present observations towards AzTEC16–30 provides us with a flux-limited sample of 30 SMGs (S/N), which have all been followed up with intermediate-resolution interferometric observations. This allows us to carry out a statistically meaningful study of their redshift distribution.
| Source | JCMT/AzTEC ID | S/N | |
|---|---|---|---|
| [mJy] | |||
| AzTEC16 | AzTEC-J095950.29+024416.1 | 4.5 | |
| AzTEC17 | AzTEC-J095939.30+023408.0 | 4.4 | |
| AzTEC18 | AzTEC-J095943.04+023540.2 | 4.3 | |
| AzTEC19 | AzTEC-J100028.94+023200.3 | 4.3 | |
| AzTEC20 | AzTEC-J100020.14+024116.0 | 4.3 | |
| AzTEC21 | AzTEC-J100002.74+024645.0 | 4.2 | |
| AzTEC22 | AzTEC-J095950.69+022829.5 | 4.2 | |
| AzTEC23 | AzTEC-J095931.57+023601.5 | 4.1 | |
| AzTEC24 | AzTEC-J100038.72+023843.8 | 4.1 | |
| AzTEC25 | AzTEC-J095950.41+024758.3 | 4.1 | |
| AzTEC26 | AzTEC-J095959.59+023818.5 | 4.0 | |
| AzTEC27 | AzTEC-J100039.12+024052.5 | 4.0 | |
| AzTEC28 | AzTEC-J100004.54+023040.1 | 4.0 | |
| AzTEC29 | AzTEC-J100026.68+023753.7 | 4.0 | |
| AzTEC30 | AzTEC-J100003.95+023253.8 | 4.0 |
2.2 Intermediate-resolution 1.3 mm imaging
The PdBI 1.3 mm (230.5 GHz) continuum observations towards AzTEC16–30 (project W0AE) were carried out between January and November 2013. The array of six antennas was mostly in its C configuration, i.e. the second most-compact configuration with 15 baselines ranging from 24 to 176 m (which corresponds to 18.5–135.4 k). On 16 April, however, antenna station E04 was not available, resulting in only ten baselines. On 12 October, when part of the observations towards AzTEC16–22 were performed, the array was in its most compact D configuration (baselines in the range 24–97 m or 18.5–74.6 k). The lower-sideband (LSB) system temperature was typically K, except on 16 April and 3 May when it was 300–350 K. The atmospheric precipitable water vapour (PWV) was typically in the range 2–4 mm, except on 16 April when it was 6 mm. The best weather conditions were on 30 October, when the PWV value was only about 1 mm. The phase centres used were the AzTEC 1.1 mm peak positions of the sources detected by Scott et al. (2008), and the on-source observing time per source was hr.
The backend used was the WideX correlator, which is composed of four units [two for both orthogonal linear (horizontal and vertical) polarisation modes], each being 2 GHz wide and split into 1 024 channels (corresponding to a channel width of about 1.95 MHz). The total effective bandwidth is about 1.8 GHz for each unit or about 3.6 GHz for both polarisations. The correlator bandpass calibration was achieved by observing 3C84 (NGC 1275), 3C279, and B0923+392. Gain phases and amplitudes were calibrated by observing B0906+015 and 1005+066. The standard source 3C84 was used the most often as a flux calibrator, with the adopted 230 GHz flux density of Jy depending on the observing day. The other flux calibrators used were 3C279 (10.68 Jy), 0851+202 (3.04 Jy), and 0923+392 (2.5–3.16 Jy). The absolute flux-calibration uncertainty was estimated to be about 20%, which is based on the observed scatter in the calibrators’ flux densities. The primary beam (PB) of the PdBI at the observing frequency is (Half-Power Beam Width or HPBW). At , this corresponds to about 180.5 physical kpc.
Calibration and imaging were performed using the CLIC (Continuum and Line Interferometer Calibration) and MAPPING programs of the GILDAS software package333Grenoble Image and Line Data Analysis Software is provided and actively developed by IRAM, and is available at http://www.iram.fr/IRAMFR/GILDAS, respectively. When creating the maps, natural weighting was applied to the calibrated visibilities (i.e. weighting according to the number of measurements within a given region of the -plane). The CLEAN algorithm was used for deconvolution, and applied in regions centred on the strongest emission features. The typical resulting synthesised beam size (Full Width at Half Maximum or FWHM) is , and the restored continuum maps (dual polarisation) have root mean square (rms) noise values of mJy beam-1. Hence, the statistical positional error, (where and are the major and minor axes of the beam; Reid et al. (1988); Younger et al. (2007)), can be estimated to be about , which is about for a typical source. We note that merging the C and D configuration visibilities together for AzTEC16–22 improved the coverage and produced maps of higher spatial dynamic-range than those of AzTEC23–30. The phase centres, both the synthesised beam sizes and position angles, and the rms noises of the final cleaned, continuum maps are listed in Table 2.
2.3 The COSMOS field – ancillary data
Since our target sources lie within the COSMOS field, they have been observed with several ground- and space-based telescopes at wavelengths spanning from the X-rays to the radio regime.
Observations at X-ray wavelengths were performed with the XMM-Newton (Hasinger et al. (2007)), and Chandra satellites (C-COSMOS; Elvis et al. (2009); Puccetti et al. (2009)). The Galaxy Evolution Explorer, or GALEX, imaged the COSMOS field in the near-UV (NUV) and far-UV (FUV) (Zamojski et al. (2007)). Hubble Space Telescope (HST) Advanced Camera for Surveys (ACS) Wide Field Channel (WFC) observations of the COSMOS field were done in the band (the F814W filter) (Scoville et al. 2007a ; Koekemoer et al. (2007)). Observations at optical/near-IR (NIR) wavelengths have been carried out with the 8.2 m Subaru telescope, the 3.6 m Canada France Hawaii Telescope (CFHT), the 3.8 m United Kingdom Infrared Telescope (UKIRT), the 2.2 m University of Hawaii telescope called UH88 (or UH2.2), and the 4 m telescopes of the Kitt-Peak National Observatory (KPNO), the Cerro Tololo Inter-American Observatory (CTIO), and the National Optical Astronomy Observatory (NOAO) [see Capak et al. (2007), Taniguchi et al. (2007), and McCracken et al. (2010) for details].
New NIR imaging of the COSMOS field in the (1.02 m), (1.25 m), (1.65 m), and (2.15 m) bands is being collected by the UltraVISTA survey (McCracken et al. (2012); Ilbert et al. (2013))444The data products are produced by TERAPIX; see http://terapix.iap.fr. Mid-infrared (MIR) observations were obtained with the Infrared Array Camera (IRAC; 3.6–8.0 m) and the Multiband Imaging Photometer for Spitzer (MIPS; 24–160 m) on board the Spitzer Space Telescope as part of the COSMOS Spitzer survey (S-COSMOS; Sanders et al. (2007)). Far-infrared (70, 160, and 250 m) to submm (350 and 500 m) Herschel continuum observations were performed as part of the Photodetector Array Camera and Spectrometer (PACS) Evolutionary Probe (PEP; Lutz et al. (2011)) and the Herschel Multi-tiered Extragalactic Survey (HerMES555http://hermes.sussex.ac.uk; Oliver et al. (2012)) programmes. Radio-continuum imaging was done at 20 cm (1.4 GHz) with the Very Large Array or VLA (Schinnerer et al. (2007), 2010), and at 10 cm (3 GHz) with the Karl G. Jansky Very Large Array (VLA-COSMOS 3 GHz Large Project; PI: V. Smolčić). In addition to the imaging observations, a large spectroscopic redshift survey of galaxies in the COSMOS field has been carried out with the Very Large Telescope (VLT), a survey known as zCOSMOS (Lilly et al. (2007), 2009), and with the Keck telescope (M. Salvato et al., in prep.). Photometric redshifts towards sources in the COSMOS field have been computed using 30 wavelength bands spanning from UV to MIR (Ilbert et al. (2009), 2013).
Most of the extensive multiwavelength datasets are publicly available from the NASA/IPAC Infrared Science Archive666http://irsa.ipac.caltech.edu/Missions/cosmos.html.
| Source | P.A. | ||||
|---|---|---|---|---|---|
| [h:m:s] | [::] | [] | [] | [mJy beam-1] | |
| AzTEC16 | 09 59 50.29 | +02 44 16.1 | 12.82 | 0.247 | |
| AzTEC17 | 09 59 39.30 | +02 34 08.0 | 13.49 | 0.239 | |
| AzTEC18 | 09 59 43.04 | +02 35 40.2 | 13.75 | 0.256 | |
| AzTEC19 | 10 00 28.94 | +02 32 00.3 | 13.67 | 0.302 | |
| AzTEC20 | 10 00 20.14 | +02 41 16.0 | 14.42 | 0.252 | |
| AzTEC21 | 10 00 02.74 | +02 46 45.0 | 14.82 | 0.256 | |
| AzTEC22 | 09 59 50.69 | +02 28 29.5 | 0.00 | 0.227 | |
| AzTEC23 | 09 59 31.57 | +02 36 01.5 | 4.19 | 0.205 | |
| AzTEC24 | 10 00 38.72 | +02 38 43.8 | 4.53 | 0.188 | |
| AzTEC25 | 09 59 50.41 | +02 47 58.3 | 5.00 | 0.191 | |
| AzTEC26 | 09 59 59.59 | +02 38 18.5 | 5.29 | 0.178 | |
| AzTEC27 | 10 00 39.12 | +02 40 52.5 | 5.19 | 0.215 | |
| AzTEC28 | 10 00 04.54 | +02 30 40.1 | 5.28 | 0.225 | |
| AzTEC29 | 10 00 26.68 | +02 37 53.7 | 5.57 | 0.212 | |
| AzTEC30 | 10 00 03.95 | +02 32 53.8 | 6.09 | 0.205 |
3 Source catalogue, multiwavelength counterparts, and multiplicity
3.1 Source extraction and multiwavelength counterparts
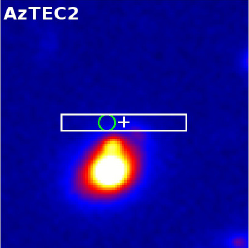
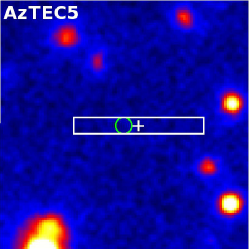
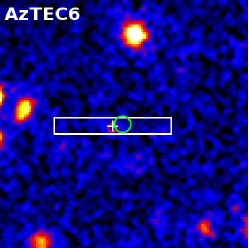
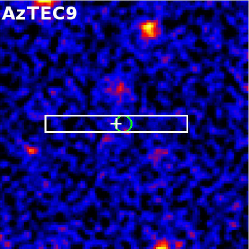
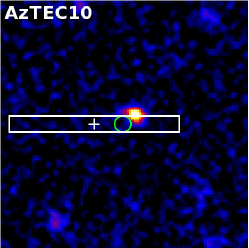
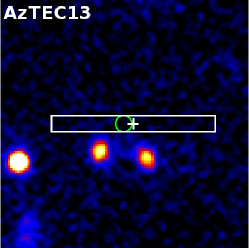
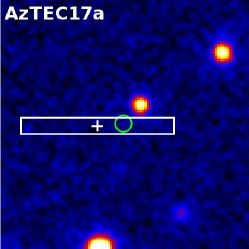
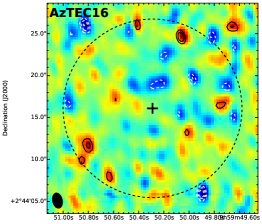
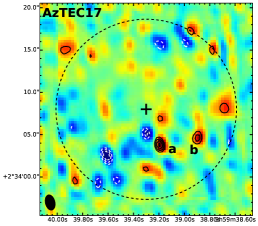
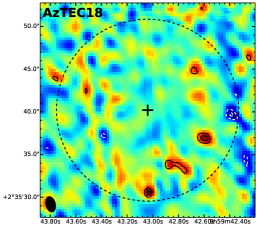
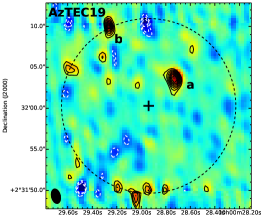
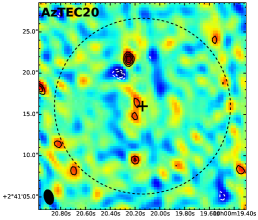
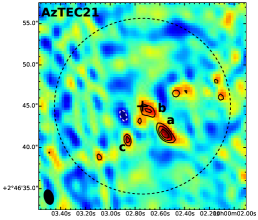
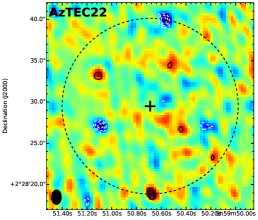
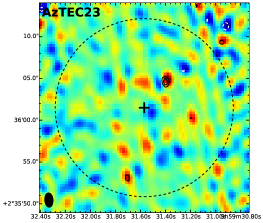
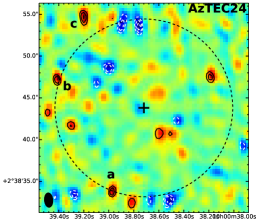
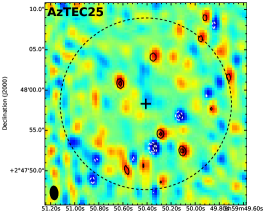
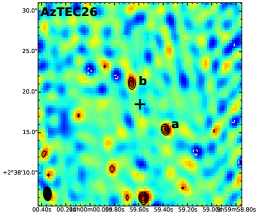
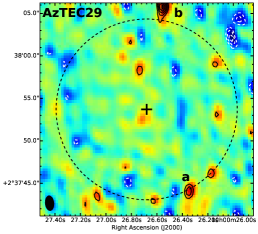
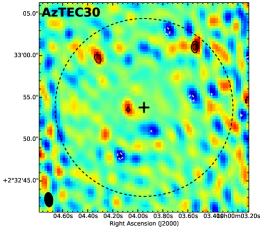
The PdBI 1.3 mm images towards AzTEC16–30 are shown in Fig. 1. We note that the PdBI PB at the observed frequency, , closely resembles the size of the JCMT/AzTEC beam of about (FWHM), and that our observation wavelength (1.3 mm) is very close to that of the original discovery observations (JCMT/AzTEC) by Scott et al. (2008; 1.1 mm), facilitating comparison between these two studies.
To systematically search for sources in the final, cleaned maps, we followed Hodge et al. (2013) and Karim et al. (2013). Briefly, we used an Interactive Data Language (IDL)-based source-extraction routine that first finds pixel values above , where is the rms noise determined using non-overlapping rectangular apertures across the map. The size of each aperture was taken to be large compared to the synthesised beam so that each of them will yield a representative sampling of independent beams. Since some apertures contained physical signal (i.e. sources), the value of was taken to be the median of all different rms values. The value of derived this way is consistent with the GILDAS-derived map rms noise given in Col. (6) in Table 2: the first value was found to be 6% higher on average than the second value (the median ratio between the two rms values is 1.05). The routine then models the source emission within a region using a Gaussian and the MCMC (Metropolis-Hastings Markov chain Monte Carlo) algorithm. Extended sources are fit for six parameters (peak surface brightness, peak position, minor axis, major-to-minor axis ratio, and position angle) while for point sources the size is fixed to that of the synthesised beam (leaving only three free parameters). To generate a robust catalogue of PdBI-detected sources we adopt the approach already used by Smolčić et al. (2012b) and consider sources with in the PdBI 1.3 mm maps as robust detections, while sources with are considered real only if they have a multiwavelength counterpart within a search radius of (within the COSMOS UltraVISTA NIR, Spitzer IRAC/MIPS, VLA 10 or 20 cm radio catalogues). When multiple PdBI source candidates are detected, we label them AzTEC17a, AzTEC17b, etc.
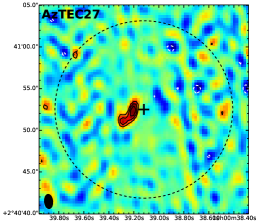
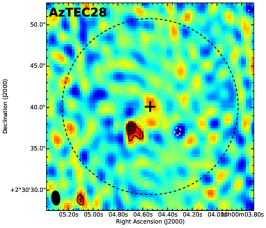
In total we find 22 sources, 11 of which are associated with multiwavelength counterparts (three additional sources have a nearby ACS -band source but no “counterparts” at other wavelengths). We report their positions (J2000.0 equatorial coordinates and offset from the phase centre) and primary-beam corrected flux densities in Table 3. For the unresolved sources, we report the peak flux density, while for the (marginally) resolved sources, AzTEC21a, 27, and 28, we give the total flux density derived from the best-fit six-parameter model. The latter values were also independently derived by summing over all pixels within the contour of 1.3 mm emission, and were found to be consistent with the model values. The quoted flux density uncertainties are based on the rms noise values and the 20% absolute calibration error (added in quadrature). We note that inspection of the residual maps of the model Gaussian fits showed that AzTEC21a could be well-fitted with a deconvolved FWHM size of . However, AzTEC27 and 28 are not as well modelled by a single Gaussian source model. For AzTEC27, only the major axis of the elliptical Gaussian could be determined (), while the size of AzTEC28 was determined to be . The large uncertainties in the sizes reflect that these sources are only marginally resolved and/or are not well-represented by a single Gaussian (see e.g. Condon (1997)). In all the three cases (AzTEC21a, 27, and 28), however, the peak flux density was found to be lower than the total flux density, supporting their marginally extended nature. The multiwavelength counterpart IDs of our PdBI sources are reported in Col. (7) in Table 3, and the last column lists the projected angular offset from the PdBI source. Multiwavelength zoomed-in images towards our sources are provided in Fig. 7. Notes on individual sources are given in Appendix C.
3.2 Source catalogue validation
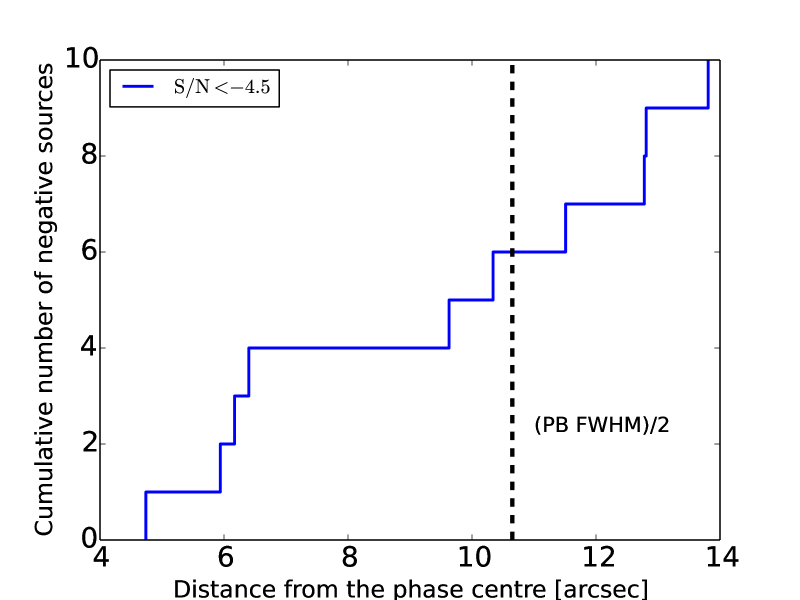
To test the robustness of our PdBI source identifications we quantified the number of expected spurious sources by searching for detections in the negative part of the PdBI maps in the same way as described above. We found no spurious sources associated with multiwavelength counterparts within a search radius of . This is consistent with the random match probability within this radius, based on the optical/IR/radio catalogue source densities, of only (Smolčić et al. 2012b ). It also implies that all our PdBI detections with multiwavelength counterparts are likely to be real. We also find that the number of spurious sources increases with increasing distance from the phase centre, as shown in Fig. 2. Out to a distance of from the phase centre only one spurious source is expected. This suggests that potentially one of the three sources (AzTEC20, 26b, 28; Table 3) detected with , within from the phase centre and with no multiwavelength counterparts may be spurious. At a distance of from the phase centre a total of five spurious sources with is expected. This suggests that five sources (AzTEC22, 24abc, 30; see Table 3) we detect at and within from the phase centre and with no multiwavelength counterparts may be spurious.
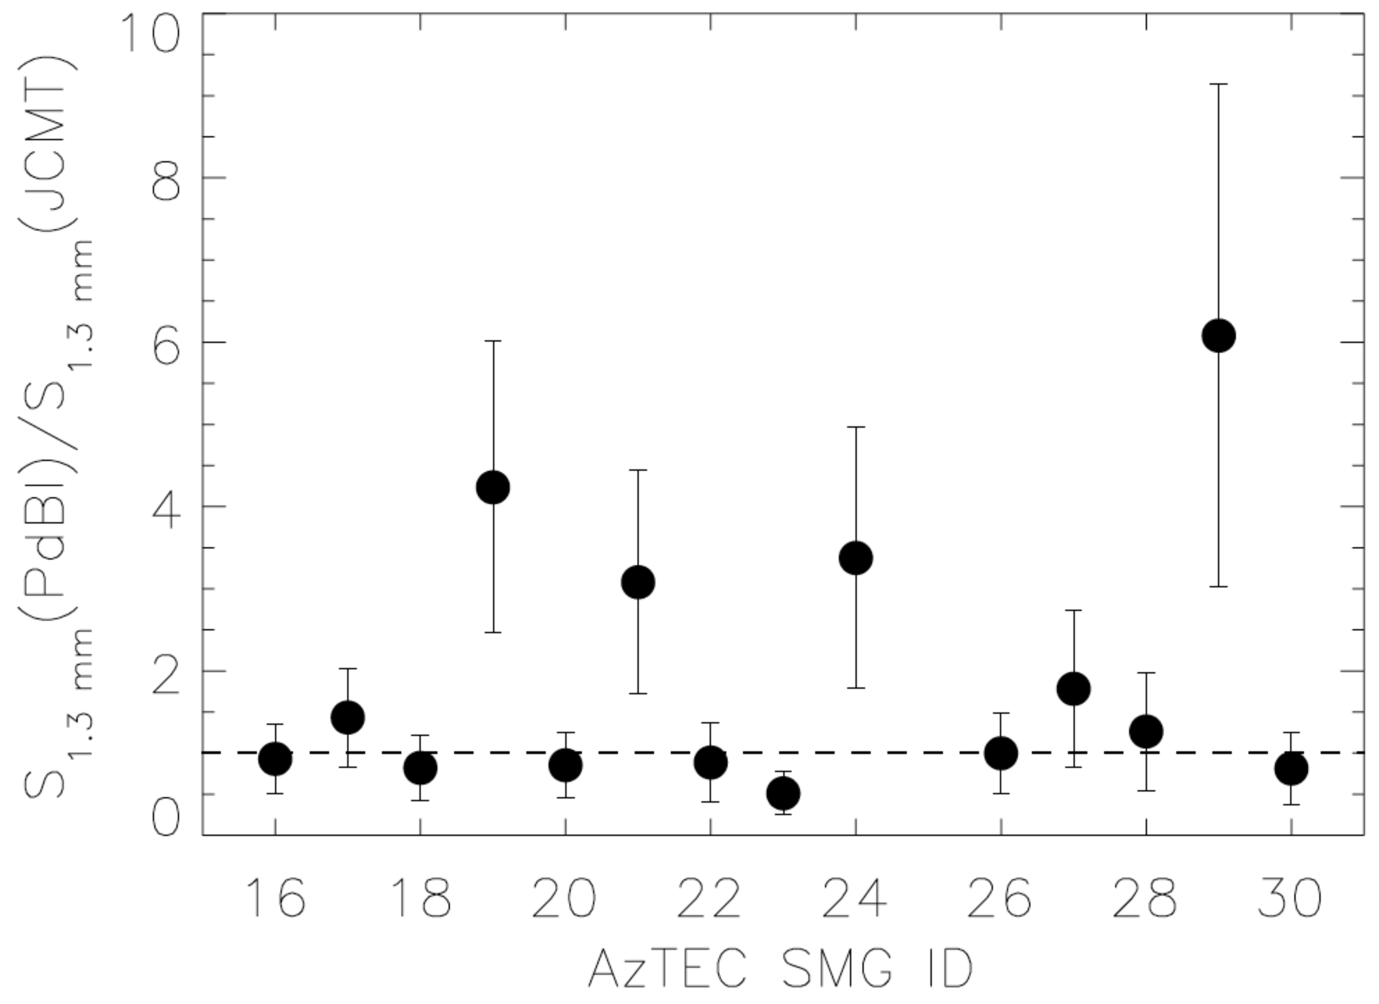
To test the validity of our sources further, we compare for each PdBI source the PdBI 1.3 mm flux to the AzTEC/JCMT 1.1 mm flux in Fig. 3. For this, the deboosted AzTEC 1.1 mm flux densities given in Table 1 were scaled down using the common assumption that the dust emissivity index is (e.g. Dunne & Eales (2001); Barger et al. (2012) and references therein). In case multiple PdBI sources are extracted from the target field, the sum of their flux densities is plotted (AzTEC25 was not detected in the PdBI map). As can be seen, the two values are generally in reasonable agreement with each other. We note, however, that a one-to-one correspondence is not expected given observational limitations (such as flux deboosting methods and possible blending of multiple sources in the low-resolution single-dish data; see e.g. Fig. 2 in Smolčić et al. 2012b for a comparison of SMA and JCMT/AzTEC 890 m flux densities for AzTEC1–15). The four sources showing higher PdBI flux densities than expected from single-dish measurements are AzTEC19, 21, 24, and 29. Given that AzTEC24 has no multiwavelength counterpart associated, and that its PdBI flux is inconsistent with that from the JCMT/AzTEC survey may suggest that the three identified PdBI sources within the AzTEC24 field are spurious. On the other hand, emission features at the border of and/or just outside the PB FWHM (as in the cases of AzTEC19, 24, and 29) may not be contributing to the JCMT/AzTEC source flux densities detected at resolution, and deboosted JCMT/AzTEC flux densities may also be invalid in this comparison for sources with widely separated components. In summary, we conclude that 4 out of the 22 PdBI identified sources may be spurious.
3.3 Multiplicity of single-dish detected, JCMT/AzTEC SMGs
Submillimetre sources identified in single-dish studies can be composed of multiple components, and this multiplicity can be revealed by higher-resolution (interferometric) observations. These components can typically be associated with individual galaxies that might be physically related (and potentially interacting), or might be just chance alignments of galaxies lying at different redshifts. As the multiplicity fraction of submm sources depends on the initial resolution of the single-dish observations and on the depth of the interferometric follow-up, it is not sensible to provide a simple definition for multiplicity. The present study benefits from the fact that the PB of our PdBI follow-up observations is well matched to the beam FWHM of the JCMT observations used for identifying the initial source sample ( versus ; Sect. 3.1). This facilitates the analysis of source blending in the single-dish maps. Based on our PdBI source detections six out of the 15 AzTEC16–30 SMGs (or 5/15 if AzTEC24 is treated as spurious) separate into multiple components. This corresponds to (), where the errors are Poisson errors. Within the sample of the brightest COSMOS JCMT/AzTEC SMGs (AzTEC1–15) only 2/15 () separate into multiple components (Younger et al. (2007), 2009; Smolčić et al. 2012b ). Combining these two samples then yields that 7–8 SMGs in our flux- and S/N-limited single-dish detected, COSMOS JCMT/AzTEC sample of 30 sources separate into multiple sources when observed at angular resolution. This corresponds to , and will be discussed further in Sect. 5.1.
| Source | S/N | Offset | Candidate | ||||
|---|---|---|---|---|---|---|---|
| [h:m:s] | [::] | [mJy] | [] | counterpart IDa𝑎aa𝑎aThe references for the different source catalogues are as follows: ACS -band (Leauthaud et al. (2007)); GALEX (M. A. Zamojski et al., in prep.); COSMOS photometry catalogue (Capak et al. (2007)); UltraVISTA (Capak et al. (2007); McCracken et al. (2012); Ilbert et al. (2013)); Spitzer IRAC/MIPS (S-COSMOS team); VLA Deep (Schinnerer et al. (2010)). | [] | ||
| AzTEC16 | 09 59 50.069 | +02 44 24.50 | 5.0 | 9.0 | 501 (ACS-) | 0.35 | |
| AzTEC17a | 09 59 39.194 | +02 34 03.83 | 6.2 | 4.5 | 613229 (GALEX) | 1.29 | |
| 1496 (ACS-) | 1.36 | ||||||
| 1475165 (COSMOS+UltraVISTA) | 1.38 | ||||||
| 271694 (New UltraVISTA) | 1.47 | ||||||
| 250117 (IRAC) | 0.30 | ||||||
| J095939.19+023403.6 (VLA Deep) | 0.22 | ||||||
| AzTEC17b | 09 59 38.904 | +02 34 04.69 | 4.5 | 6.8 | 1475223 (COSMOS+UltraVISTA) | 1.25 | |
| AzTEC18 | 09 59 42.607 | +02 35 36.96 | 4.5 | 7.3 | 1044 (ACS-) | 0.76 | |
| 1471053 (COSMOS+UltraVISTA) | 0.82 | ||||||
| AzTEC19a | 10 00 28.735 | +02 32 03.84 | 10.3 | 4.4 | 1593 (ACS-) | 0.40 | |
| 1455882 (COSMOS+UltraVISTA) | 0.20 | ||||||
| 262214 (New UltraVISTA) | 0.20 | ||||||
| 242501 (IRAC) | 0.63 | ||||||
| 2158 (MIPS 24 m) | 0.15 | ||||||
| J100028.70+023203.7 (VLA Deep) | 0.53 | ||||||
| AzTEC19b | 10 00 29.256 | +02 32 09.82 | 9.7 | 10.6 | 597821 (GALEX) | 0.66 | |
| 1486 (ACS-) | 0.68 | ||||||
| 1455681 (COSMOS+UltraVISTA) | 0.63 | ||||||
| 262766 (New UltraVISTA) | 0.74 | ||||||
| AzTEC20 | 10 00 20.251 | +02 41 21.66 | 6.0 | 5.9 | … | … | |
| AzTEC21a | 10 00 02.558 | +02 46 41.74 | 5.8 | 4.3 | 711447 (GALEX) | 0.35 | |
| 1688587 (COSMOS+UltraVISTA) | 0.15 | ||||||
| 328878 (New UltraVISTA) | 1.00 | ||||||
| 297396 (IRAC) | 1.11 | ||||||
| 7262 (MIPS 24 m) | 1.46 | ||||||
| AzTEC21b | 10 00 02.710 | +02 46 44.51 | 4.2 | 0.7 | 711786 (GALEX) | 0.53 | |
| 1688585 (COSMOS+UltraVISTA) | 0.45 | ||||||
| AzTEC21c | 10 00 02.856 | +02 46 40.80 | 4.5 | 4.5 | 712026 (GALEX) | 1.49 | |
| 297223 (IRAC) | 1.46 | ||||||
| AzTEC22 | 09 59 50.681 | +02 28 19.06 | 5.1 | 10.5 | … | … | |
| AzTEC23 | 09 59 31.399 | +02 36 04.61 | 4.9 | 4.0 | 1494354 (COSMOS+UltraVISTA) | 1.24 | |
| AzTEC24a | 10 00 38.969 | +02 38 33.90 | 4.9 | 10.6 | … | … | |
| AzTEC24b | 10 00 39.410 | +02 38 46.97 | 5.0 | 10.8 | … | … | |
| AzTEC24c | 10 00 39.194 | +02 38 54.46 | 5.1 | 12.8 | … | … | |
| AzTEC25b𝑏bb𝑏bThe 1.3 mm features in AzTEC25 did not fulfil our detection criteria. | … | … | … | … | … | … | … |
| AzTEC26a | 09 59 59.386 | +02 38 15.36 | 5.4 | 4.4 | 647670 (GALEX) | 1.05 | |
| 930 (ACS-) | 1.07 | ||||||
| 1709726 (COSMOS+UltraVISTA) | 0.94 | ||||||
| 291786 (New UltraVISTA) | 0.83 | ||||||
| AzTEC26b | 09 59 59.657 | +02 38 21.08 | 4.8 | 2.8 | … | … | |
| AzTEC27 | 10 00 39.211 | +02 40 52.18 | c𝑐cc𝑐cAzTEC27 is probably subject to gravitational lensing (see Appendices C and D), and our lens modelling suggests a magnification factor of . In this case, AzTEC27’s intrinsic flux density at observing-frame 1.3 mm would be mJy. | 6.0 | 1.4 | 666 (ACS-) | 1.15 |
| AzTEC28 | 10 00 04.680 | +02 30 37.30 | 5.5 | 3.5 | … | … | |
| AzTEC29a | 10 00 26.351 | +02 37 44.15 | 4.7 | 10.8 | 736 (ACS-) | 1.41 | |
| AzTEC29b | 10 00 26.561 | +02 38 05.14 | 7.3 | 11.6 | 1685295 (COSMOS+UltraVISTA) | 0.76 | |
| AzTEC30 | 10 00 03.552 | +02 33 00.94 | 4.6 | 9.3 | … | … |
4 Redshift distribution of 1.1-mm selected SMGs in the COSMOS field
4.1 Redshifts for AzTEC1–15
Among the SMA-detected SMGs AzTEC1–15, there are eight spectroscopic redshifts reported in the literature (AzTEC1, 2, 3, 5, 6, 8, 9, and 11; see Smolčić et al. 2012b ; their Tables 1 and 4 and references therein). However, as described in Appendix B, the spectroscopically determined redshifts for AzTEC5, 6, and 9 are uncertain because of the poor quality of the spectrum or contamination by foreground galaxies. Besides these cases, we discuss the updated redshifts among AzTEC1–15 in Appendix B (the redshifts are listed in Table 4).
4.2 Redshifts for AzTEC16–30
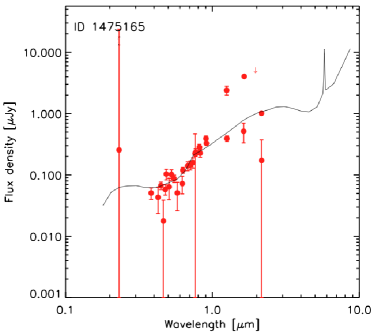
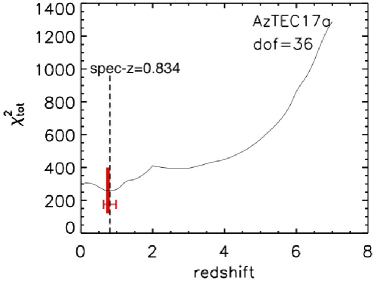
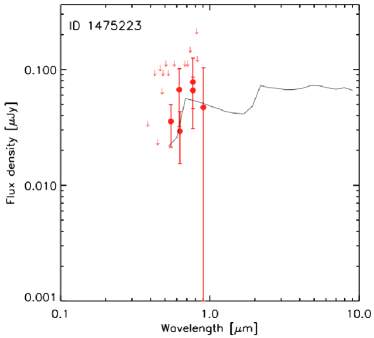
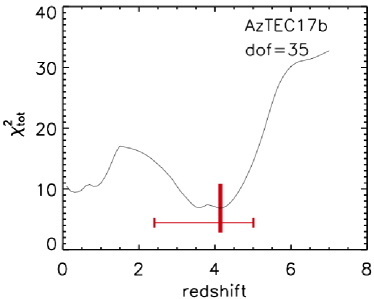
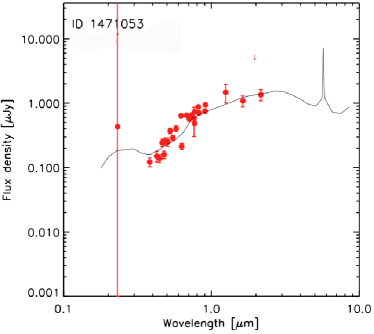
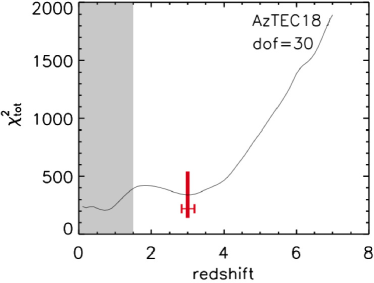
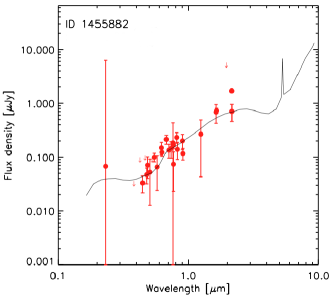
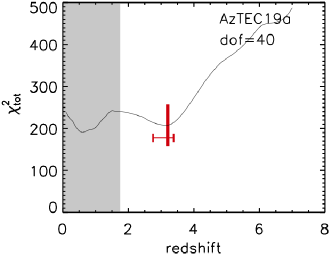
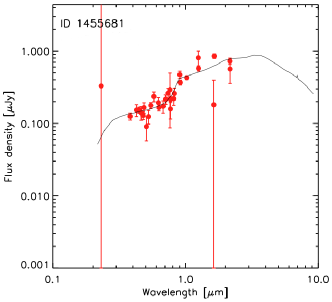
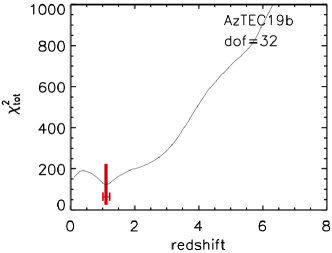
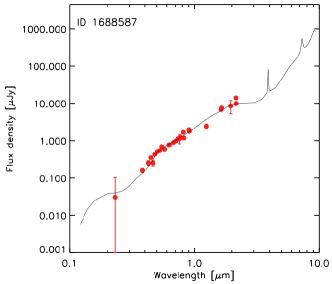
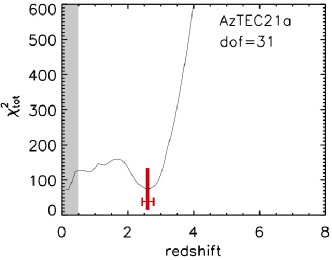
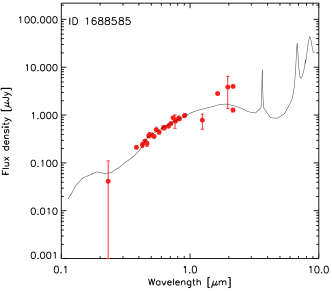
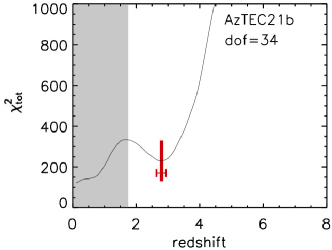
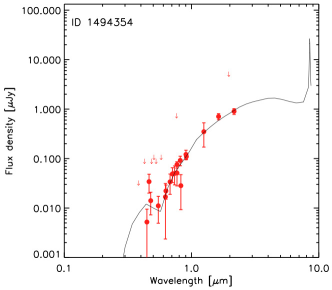
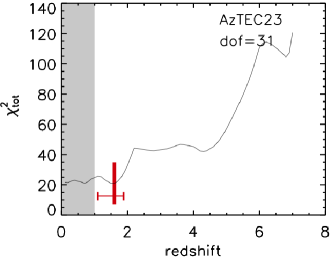
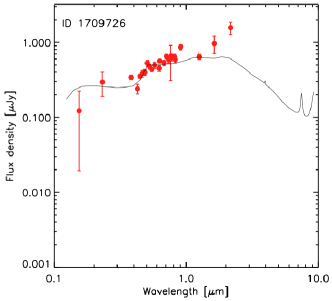
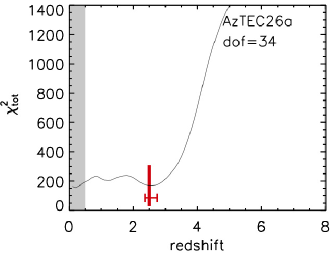
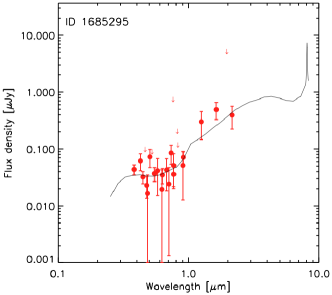
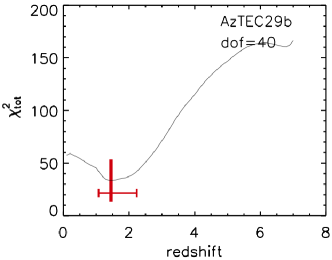
The optical/IR photometric redshifts of AzTEC16–30 were computed (when possible) by fitting optimised spectral templates to their spectral energy distributions (SEDs) using the HYPERZ code (Bolzonella et al. (2000))999http://webast.ast.obs-mip.fr/hyperz/. The redshift was treated as a free parameter and determined using a minimisation method, i.e. the most likely redshift was determined statistically (see also Smolčić et al. 2012a ,b). We used the Calzetti et al. (2000) extinction law, and the -band extinction, , was varied from 0 to 5 mag. The allowed redshift range was . The spectral templates used were generated with the GRASIL radiative-transfer code (Silva et al. (1998); Iglesias-Páramo et al. (2007)) and optimised for SMGs using the method described by Michałowski et al. (2010). When comparing results for their tested spectral templates, Smolčić et al. (2012a) found that the best agreement (i.e. the tightest distribution) between the spectroscopic and photometric redshifts (sample of eight COSMOS SMGs) is obtained when employing the templates derived by Michałowski et al. (2010). Smolčić et al. (2012b; see their Fig. 7) repeated the analysis using a larger source sample, and their similar results lend further support to the reliability of the Michałowski et al. (2010) spectral-template library. We therefore decided to perform our photo- analysis using this library of templates. The optical/IR SEDs for the identified SMG counterparts are shown in Fig. 4. The template-fitting method of finding the best photo- solution is based on the minimisation of the reduced chi-square () value, which is the chi-square divided by the number of degrees of freedom (dof) [see Eq. (1) in Bolzonella et al. (2000)]. The HYPERZ program yields the probability associated with the minimum for each redshift step, . The absolute (total) chi-square () distribution for each source as a function of redshift is presented in a panel next to the corresponding SED plot in Fig. 4. We computed the formal lower and upper confidence limits for the best-fit photo- value. Formally, these were calculated from the probability distribution (Avni (1976)), where is the increment in required to cover the parameter space region with a confidence of , and is the number of dof. The confidence interval (CI) equals the set of all values that satisfy the condition .
For those sources with no optical/IR counterparts, the above method could not be used to derive their redshift. The sources that are not spurious are likely to lie at high redshift or/and be heavily obscured by dust. Since the radio and submm continuum have very different -corrections, the radio/submm flux-density ratio strongly depends on the source redshift. As proposed by Carilli & Yun (1999, 2000), the spectral index between 860 m (350 GHz) and 20 cm (1.4 GHz), , can be used to estimate the redshift. The 860 m flux densities were estimated from the 1.3 mm values by assuming that the dust emissivity index is . On the basis of this, we used the mean radio-to-submm spectral index, , predicted from 17 low-redshift star-forming galaxies by Carilli & Yun (2000), to set constraints on the source redshift. For 1.4 GHz non-detections, we used the upper limit to (typically mJy) to derive a lower limit to , hence a lower limit to . The uncertainty in the radio/submm redshift was determined from those associated with the flux densities. For AzTEC27, which is subject to gravitational lensing, the differential lensing effects were assumed to be negligible (i.e. the boost in flux density was assumed to be independent of wavelength), hence the radio/submm flux density ratio was assumed to be independent of the magnification factor. We note that a 1.4 GHz non-detection could simply be related to a spurious PdBI 1.3 mm source. Therefore, some of the derived lower limits to should be taken with caution.
The redshifts of AzTEC16-30 are discussed in more detail in Appendix C. In summary, for one source (AzTEC17a) we have a spectroscopic redshift, for nine sources we have derived photometric redshifts, and for 12 sources we have submm-radio flux ratio based redshift estimates.
4.3 Redshift distribution of AzTEC1–30
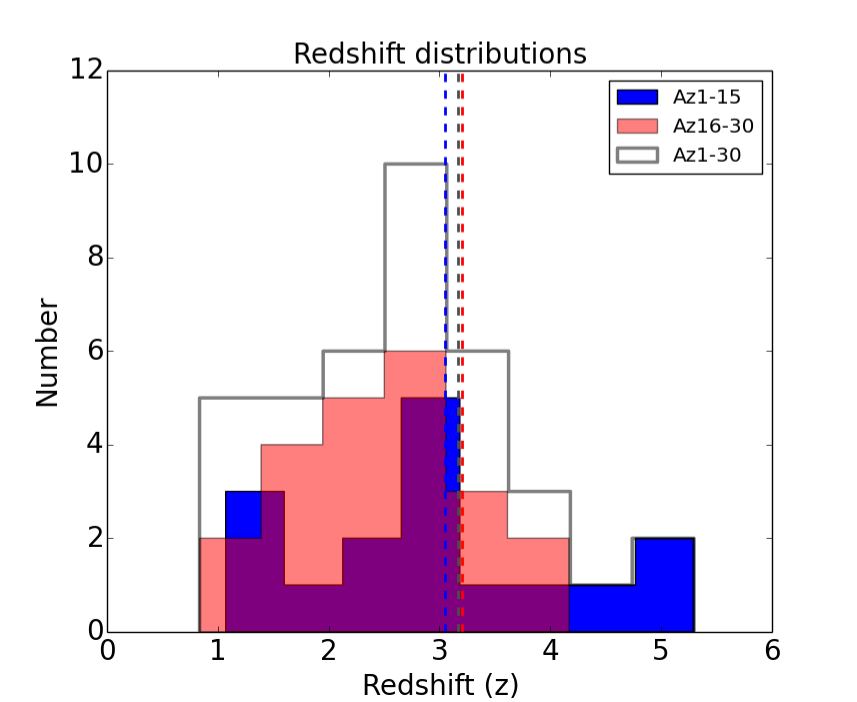
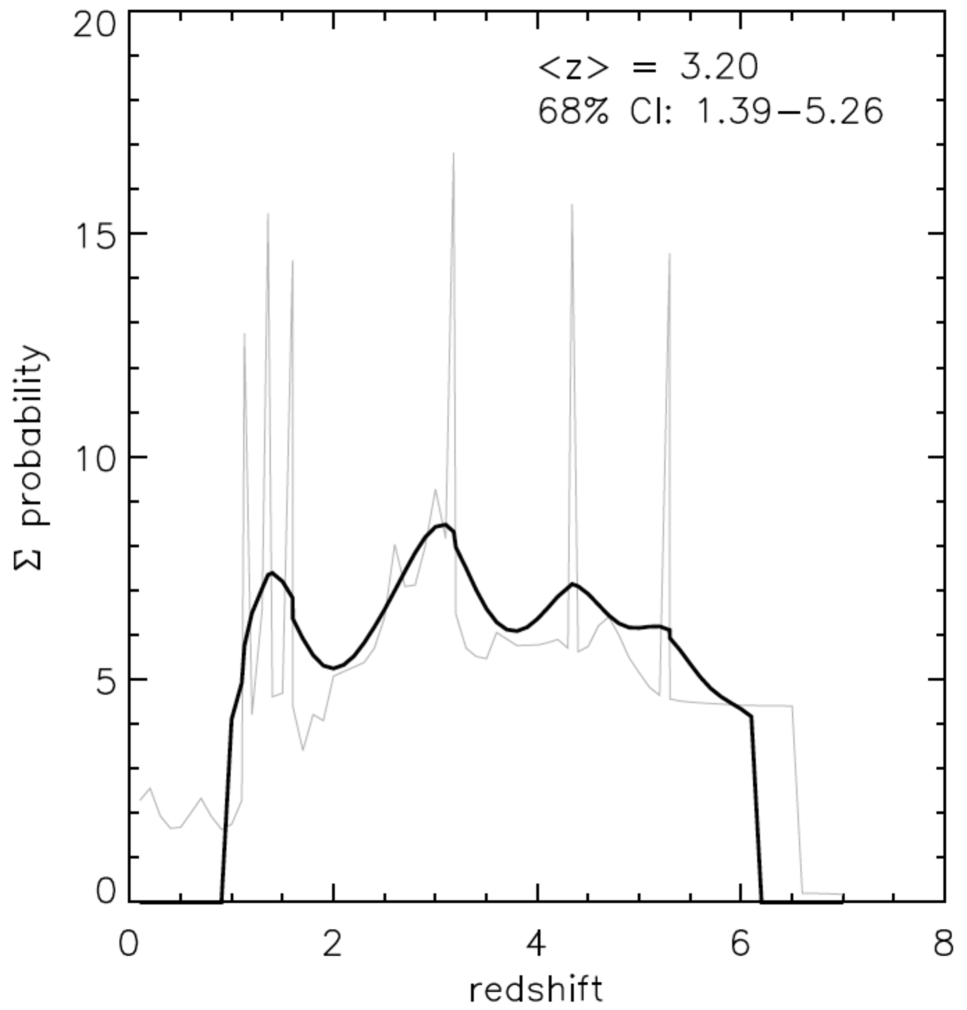
All the derived and adopted redshifts for AzTEC1–30 are listed in Table 4. n total, for six (five among AzTEC1-15, one among AzTEC16-30) sources in the sample we have a spectroscopic redshift, for 17 a photo- (eight among AzTEC1-15, nine among AzTEC16-30), while for 15 (three for AzTEC1-15, 12 for AzTEC16-30) we have a redshift estimated from the submm-radio flux-density ratio. By combining the up-dated redshifts of AzTEC1–15 with the present results, we derived the redshift distribution for the combined sample of AzTEC1–30. The constructed redshift distributions are shown in the top panel of Fig. 5. The bottom panel of Fig. 5 shows the probability density distribution [; a kernel density estimate], of our total SMG sample constructed using the same redshift data as in the histograms in the top panel. The probability distribution functions (PDFs) were summed for i) sources with values, where the PDF was assumed to be a delta function [], ii) sources with values (PDFs derived using HYPERZ), and iii) sources that had only lower limits to , in which case the PDF was assumed to be a flat function from the lower limit up to . Before calculating the overall PDF, the individual PDFs were normalised so that their integral becomes unity. From this distribution we derived a median redshift of and 68% CI of .
We further calculated the statistical parameters independently using the R program package called Nondetects And Data Analysis for environmental data (NADA; Helsel (2005)), which is an implementation of the statistical methods provided by the Astronomy Survival Analysis (ASURV; Feigelson & Nelson (1985)) package. This method robustly takes lower redshift limits into account (e.g. Yun et al. (2012)). It was assumed that the censored data follow the same distribution as the actual values, and we used the Kaplan-Meier (K-M) method to construct a model of the input data. After applying the K-M survival estimator, we found that the mean, median, standard deviation (std), and 95% CI of the redshifts of AzTEC1–15 are , , , and , respectively. For AzTEC16–30, the corresponding values are , , , and . The combined sample (open grey histrogram in Fig. 5) has the values , , , and . We note that the median redshift of 3.20 derived from the redshift PDF shown in the bottom panel of Fig. 5 is in excellent agreement with the value we derived using the survival analysis. The median redshift, , corresponds to a luminosity distance of Gpc. Finally, we performed a two-sided Kolmogorov-Smirnov (K-S) test between the distributions of AzTEC1–15 and AzTEC16–30. By excluding the lower limits from the samples101010In the survival analysis it was assumed that the lower limits and exact values have a common distribution., the maximum difference between the cumulative distributions, i.e. the statistic, was found to be , while the associated probability that the two distributions are drawn from the same parent distribution is . Moreover, the Welch’s two-sample -test under the null hypothesis that the two means are equal yields a -value of about 0.338 (when excluding the lower limits), meaning that there is no evidence for a difference in the mean redshifts of AzTEC1–15 and AzTEC16–30. However, as shown in Fig. 5, the highest redshift SMGs () in our sample are found among AzTEC1–15. The redshift distributions derived in other SMG surveys, and how they compare to the present results, will be discussed in Sect. 5.3.
| Source | Redshift | Comment and |
|---|---|---|
| reference | ||
| AzTEC1 | spec-; Yun et al., in prep. | |
| AzTEC2a𝑎aa𝑎aSee text for details about the difference between our redshifts and those from Koprowski et al. (2014). | 1.125 | spec-; Baloković et al., in prep. |
| () | radio/submm-; this work | |
| () | radio/submm-; | |
| Koprowski et al. (2014) | ||
| AzTEC3 | 5.298 | spec-; Riechers et al. (2010); |
| Capak et al. (2011) | ||
| AzTEC4 | photo-; Smolčić et al. 2012b | |
| AzTEC5 | photo-; Smolčić et al. 2012b | |
| () | radio/submm-; this work | |
| AzTEC6a𝑎aa𝑎aSee text for details about the difference between our redshifts and those from Koprowski et al. (2014). | radio/submm-; this work | |
| () | radio/submm-; | |
| Koprowski et al. (2014) | ||
| AzTEC7 | photo-; Smolčić et al. 2012b | |
| AzTEC8 | 3.179 | spec-; Riechers et al., in prep. |
| AzTEC9a𝑎aa𝑎aSee text for details about the difference between our redshifts and those from Koprowski et al. (2014). | photo-; Smolčić et al. 2012b | |
| (1.357) | spec-; Salvato et al., in prep. | |
| () | radio/submm-; this work | |
| () | photo-; | |
| Koprowski et al. (2014) | ||
| AzTEC10a𝑎aa𝑎aSee text for details about the difference between our redshifts and those from Koprowski et al. (2014). | photo-; Smolčić et al. 2012b | |
| () | photo-; | |
| Koprowski et al. (2014) | ||
| AzTEC11b𝑏bb𝑏bAzTEC11 was resolved into two 890 m sources (N and S) by Younger et al. (2009). Here, for the redshift analysis, we treat it as a single source because the two components are probably physically related (Koprowski et al. (2014)). | 1.599 | spec-; Salvato et al., in prep. |
| AzTEC12 | photo-; Smolčić et al. 2012b | |
| AzTEC13 | radio/submm-; this work | |
| () | radio/submm-; | |
| Koprowski et al. (2014) | ||
| AzTEC14-Ec𝑐cc𝑐cAzTEC14 was resolved into two 890 m sources (E and W) by Younger et al. (2009). The eastern component appears to lie at a higher redshift than the western one (Smolčić et al. 2012b ). | radio/submm-; this work | |
| () | radio/submm-; | |
| Koprowski et al. (2014) | ||
| AzTEC14-Wc𝑐cc𝑐cAzTEC14 was resolved into two 890 m sources (E and W) by Younger et al. (2009). The eastern component appears to lie at a higher redshift than the western one (Smolčić et al. 2012b ). | photo-; Smolčić et al. 2012b | |
| AzTEC15 | photo-; Smolčić et al. 2012b | |
| AzTEC16 | radio/submm-; this work | |
| AzTEC17a | spec-; Salvato et al., in prep. | |
| () | photo-; this work | |
| () | radio/submm-; this work | |
| AzTEC17b | photo-; this work | |
| () | radio/submm-; this work | |
| AzTEC18 | photo-; this work | |
| () | radio/submm-; this work | |
| AzTEC19a | photo-; this work | |
| () | radio/submm-; this work | |
| AzTEC19b | photo-; this work | |
| () | radio/submm-; this work | |
| AzTEC20 | radio/submm-; this work | |
| AzTEC21a | photo-; this work | |
| () | radio/submm-; this work | |
| AzTEC21b | photo-; this work | |
| () | radio/submm-; this work | |
| AzTEC21c | radio/submm-; this work | |
| AzTEC22 | radio/submm-; this work | |
| AzTEC23 | photo-; this work | |
| () | radio/submm-; this work | |
| AzTEC24a | radio/submm-; this work | |
| AzTEC24b | radio/submm-; this work | |
| AzTEC24c | radio/submm-; this work | |
| AzTEC26a | photo-; this work | |
| () | radio/submm-; this work | |
| AzTEC26b | radio/submm-; this work | |
| AzTEC27 | radio/submm-; this work | |
| AzTEC28 | radio/submm-; this work | |
| AzTEC29a | radio/submm-; this work | |
| AzTEC29b | photo-; this work | |
| () | radio/submm-; this work | |
| AzTEC30 | radio/submm-; this work |
5 Discussion
5.1 PdBI 1.3 mm imaging results and source multiplicity
Even though our SMGs were detected at significance in the JCMT/AzTEC 1.1 mm survey (Scott et al. (2008)), not all of them are (clearly) detected in the present higher-resolution PdBI 1.3 mm imaging. It is possible that some of the weak/non-detected AzTEC sources are actually composed of multiple objects that are too faint to be detected at the current detection limit [see Large APEX BOlometer CAmera (LABOCA) compared to Atacama Large Millimetre/submillimetre Array (ALMA); Hodge et al. (2013); and SCUBA compared to SMA; Chen et al. (2014)]. As can be seen in Fig. 3, only one source (AzTEC23) appears to have , so we are not generally missing extended emission in our SMGs. Another reason for some of our PdBI non-detections could be that some of the original JCMT/AzTEC detections are spurious. Out of the 50 JCMT/AzTEC SMGs rerported by Scott et al. (2008), 48 (96%) lie within the region mapped with AzTEC on the 10 m Atacama Submillimetre Telescope Experiment (ASTE) by Aretxaga et al. (2011, 2012). However, only 16 JCMT/AzTEC-detected sources are common to the ASTE/AzTEC 1.1 mm catalogue (Table 1 in Aretxaga et al. (2011)). For example, the ASTE/AzTEC 1.1 mm image extracted from the position of AzTEC30 shows emission only in the eastern part of the target region. Although the difference is, at least partly, caused by the difference in angular resolutions of ASTE (; Aretxaga et al. (2011)) and JCMT (), it is possible that the JCMT/AzTEC source is spurious. The expected false-detection rate in the JCMT/AzTEC survey at S/N is sources (Scott et al. (2008); Fig. 7 therein). Because all the 15 brightest sources AzTEC1–15 are interferometrically confirmed (Younger et al. (2007), 2009), we could expect to find about two spurious sources among AzTEC16–30.
When observed with single-dish telescopes, multicomponent source systems can be blended and give an impression of a single source. This can be the case even if the sources are not physically related to each other, i.e. they can lie at significantly different redshifts (e.g. Cowley et al. (2015)). Among our target fields, AzTEC17, 19, 21, 24, 26, and 29 appear to show two to three source components. Of the 15 observed AzTEC single-dish detected SMGs, this would mean that are multiple systems (or, as explained in Sect. 3.3, if AzTEC24 is not included).121212In most cases, namely AzTEC17, 19, 21, 24, and 26, most of the components exhibit comparable 1.3 mm flux densities, i.e. the single-dish measured flux density from these sources appears to include contributions from equally bright components. Among AzTEC1–15, only two sources (or ), AzTEC11 and AzTEC14, were resolved into two distinct components by Younger et al. (2007, 2009) in their resolution SMA 890 m imaging. We note that the northern and southern components of AzTEC11 could just belong to an extended object (Koprowski et al. (2014)). The 890 m flux density ratio for the two components of AzTEC11 is , and even higher, , for AzTEC14 (Younger et al. (2009); Table 1 therein). The low observed multiplicity fraction among AzTEC1–15 could be the result of a sensitivity too low to reveal the real multiplicity (see Wang et al. (2011)). However, as our angular resolution is only slightly better (and the observing wavelengths are quite similar, i.e. 1.3 mm compared to mm), our observations provide a hint that the multiplicity fraction could be somewhat higher among the fainter SMGs AzTEC16–30 (i.e. compared to 13%). Considering the combined sample AzTEC1–30, the multiplicity fraction, based on the currently available data, appears to be .
Besides the present work, it has been found that interferometric observations have the potential to resolve SMGs into separate components (e.g. Daddi et al. 2009a ; Wang et al. (2011); Smolčić et al. 2012b ; Barger et al. (2012); Karim et al. (2013); Hodge et al. (2013)). For example, Smolčić et al. (2012b) used PdBI 1.3 mm observations at resolution of 28 SMGs in the COSMOS field in conjunction with earlier interferometrically identified COSMOS SMGs, and concluded that , and possibly up to of single-dish detected SMGs (at with AzTEC and at with LABOCA), consist of multiple sources. Consistent with this, Hodge et al. (2013) found that 24 out of their sample of 69 SMGs () detected with LABOCA at 870 m ( resolution) are split into multiples when observed with ALMA at the same wavelength [the ALMA-identified SMGs from the LABOCA Extended Chandra Deep Field South (ECDFS) Submillimetre Survey (LESS), i.e. the ALESS SMGs; see also Karim et al. (2013); Simpson et al. (2014)]. We also examined the multiplicity fraction among those LESS SMGs (Weiß et al. (2009)) that have LABOCA 870 m flux densities corresponding to our AzTEC 1.1 mm flux density range, i.e. 3.3 mJy mJy. Assuming that , this flux density range is 7.7 mJy mJy. Based on their main and supplementary source samples, altogether 20 SMGs from Hodge et al. (2013) have LABOCA 870 m flux densities in this range. Among these SMGs, five were found to have multiple (2–3) components (ALESS SMGs), resulting in a multiplicity fraction of , which is very similar to our value. Dividing these LESS SMGs into two subsamples corresponding to the flux densities of AzTEC1–15 and 16–30 (i.e. six SMGs with 9.8 mJy mJy, and nine SMGs with 7.7 mJy mJy), we derived the corresponding multiplicity fractions to be and . These two values are similar within the counting uncertainties and hence, unlike what we found among AzTEC1–30, the fainter LESS SMGs do not appear to exhibit a higher multiplicity fraction than the brighter SMGs.
As recently discussed by Koprowski et al. (2014), there is some controversy about how common SMG multiplicity actually is. The multiplicity statistics reported in the literature so far seem to suggest that the fraction of single-dish detected SMGs being composed of more than one SMG can be quite high (values ranging from to ). The multiplicity fraction also depends on the angular resolution of both the single-dish observations of the initial SMG detection and the follow-up observations (the higher the former is the lower the multiplicity fraction is expected to be for a given follow-up resolution). However, whether it is a common feature (several tens of percent) is an important knowledge when studying the number counts of SMGs, and future high-resolution observations of large, well-defined samples of SMGs are required to better understand the multiplicity fraction of submm-emitting galaxies. The completed ALMA array is well suited for this purpose.
5.2 Counterpart associations of the SMGs AzTEC16–30
Some of the detected (candidate) SMGs appear to have no counterparts at optical-to-IR wavelengths. These include AzTEC20, 22, 24a–c, 26b, 28, and 30 [moreover, the -band sources lying from AzTEC16, from AzTEC27, and from AzTEC29a might be unrelated to the (candidate) SMGs because no sources at other wavelengths are identified there]. In particular, the case of AzTEC28, a clearly detected PdBI 1.3 mm source () without multiwavelength counterparts, shows that SMGs can be so heavily obscured by dust and/or at high redshift that only FIR-to-mm continuum emission can be detected (this is probably true also for AzTEC27). Given the deep multiwavelength data available for the COSMOS field, for example the 1st UltraVISTA data release (DR1) going down to mag (McCracken et al. (2012)), the fraction of sources that lack shorter-wavelength (and radio) counterparts seems high (, or if the three additional SMGs having only a nearby ACS -band source are counted). More sensitive observations could reveal the presence of faint emission at optical-to-MIR wavelengths, such as UltraVISTA DR2 reaching mag (McCracken et al. (2013)), and new IRAC 3.6 and 4.5 m observations (reaching mag) from the Spitzer Large Area Survey with Hyper-Suprime-Cam (SPLASH) (PI: P. Capak; Steinhardt et al. (2014)). Younger et al. (2009) found that AzTEC13 and AzTEC14-E and 14-W are not coincident with any optical, Spitzer, or VLA sources. Therefore, among AzTEC1–15, altogether comprising 17 SMGs, the fraction of SMGs that lack multiwavelength counterparts is 3/17 or 18%, which is lower than for the fainter SMGs AzTEC16–30. For comparison, 45% of the ALESS SMGs were found to lack MIR/radio counterparts (Hodge et al. (2013); see also Simpson et al. (2014); cf. Biggs et al. (2011)). This fraction is the same () if we consider the 20 LESS SMGs that have similar flux densities as our AzTEC SMGs (see Sect. 5.1); the total number of ALMA-detected components in these SMGs is 22 (main and supplementary samples in Hodge et al. (2013)), and 12 of them were found to have robust MIR/radio counterparts.
The lack of multiwavelength counterparts means that we are not able to place strong constraints on the source’s photometric redshift. In particular, the absence of an optical counterpart suggests that the source is highly obscured by interstellar dust, which conforms to the fact that SMGs represent very dusty galaxies. More generally, the non-detections at optical, NIR, and cm wavelengths suggest that the source lies at a high redshift (), so that the flux density at a wavelength other than (sub)mm dims because of a large luminosity distance (i.e. the radiation suffers from the positive -correction). In contrast, the (sub)mm flux density stays almost the same over the redshift range because of the negative -correction of the thermal dust emission (Blain & Longair (1993)).
As shown in Table 3, for AzTEC17a, 17b, and 23, the projected angular offset between the optical-to-NIR candidate counterpart (from the COSMOS/UltraVISTA catalogue) and the 1.3 mm emission peak is quite large, . Moreover, for AzTEC18, 26a, and 29b the above offset is also relatively large (, , and , respectively). Such an offset could be the effect of complex source morphology, expected in the case of galaxy mergers (Daddi et al. 2009a ), and/or be the result of strong differential dust obscuration (e.g. Carilli et al. (2010)). With respect to our sample of 22 detections, (three to six sources) exhibit a considerable () projected separation between the PdBI and UltraVISTA emission peaks. Even though the positional error of our PdBI sources is much lower (; Sect. 2.2), the above mentioned angular separations are still within the beam FWHM of . Moreover, towards AzTEC17a, showing the largest offset between the PdBI peak emission and the UltraVISTA source in our sample (), the Spitzer/IRAC counterpart lies only from the PdBI peak, strongly indicating that the SMG is emitting at observing-frame wavelengths m. The photo- value of we derived for AzTEC17a is in good agreement with the spec- of 0.834, further strengthening our counterpart identification (Appendix C).
5.3 Redshift distribution of the JCMT/AzTEC-detected SMGs in the COSMOS field, and comparison with other surveys
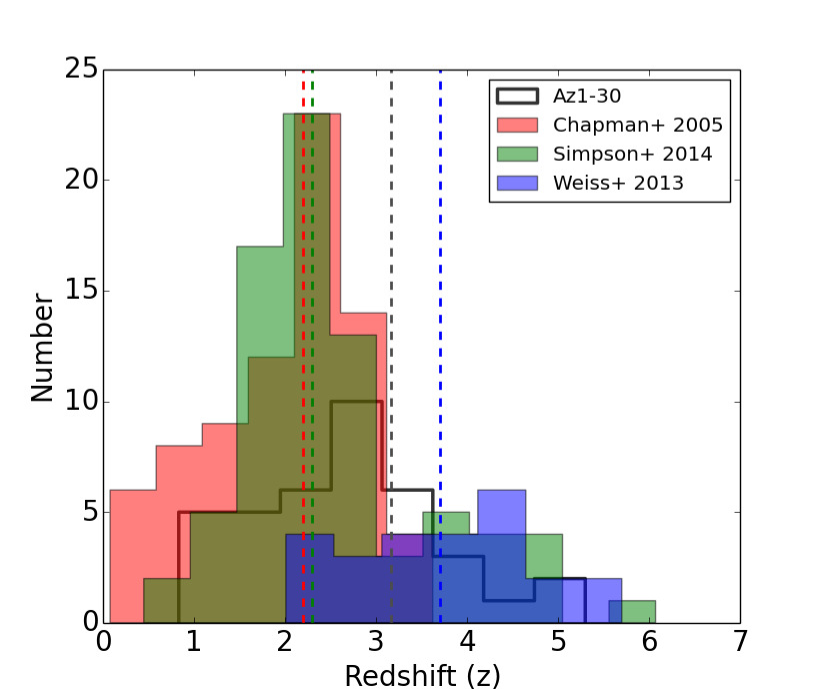
The median redshift of the SMGs studied here (AzTEC16-30) is found to be , while that for the SMGs AzTEC1–15 is . The combined sample of these JCMT/AzTEC-detected SMGs, i.e. AzTEC1–30, has a median redshift of , which corresponds to an age of the universe of Gyr or about of its current age. A two-sample K-S test of the null hypothesis that the two subsamples, AzTEC1–15 and AzTEC16–30, are drawn from the same underlying parent distribution yielded a -value of 0.7342. This suggests that the two subsamples are probably sampled from a common distribution. The -test also suggests that the mean redshifts of the subsamples are similar to each other. In Fig. 6, we show the redshift distribution of AzTEC1–30 and, for comparison, those derived in other SMG surveys discussed below.
We note that our combined SMG sample contains a source (AzTEC17a) at a redshift of . This redshift is quite similar to that of the Mpc long filamentary COSMOS large-scale structure (the COSMOS Wall) at (Guzzo et al. (2007)). However, cross-correlation with the redshift survey catalogue consisting of 1 023 galaxies belonging to the COSMOS Wall did not yield any cross matches within a search radius (A. Iovino, priv. comm.). Although AzTEC17a appears to be a member of a galaxy overdensity (V. Smolčić et al., in prep.), our redshift survey is not subject to strong cosmic variance arising from the COSMOS large-scale structure, and the different results compared to other cosmological survey fields have their origin in other effects (e.g. observing wavelength used, inclusion of radio-faint SMGs, etc.).
As demonstrated in the present study, radio-dim SMGs are probably lying at high redshifts (cf. Chapman et al. (2005)). For example, the SMG AzTEC1 is associated (near the SMA position) with only a weak 20 cm radio source ( Jy), and the SMG AzTEC3 has no 20 cm counterpart (Younger et al. (2007)). These results are based on the VLA 1.4 GHz imaging down to a mean rms depth of Jy beam-1 (Schinnerer et al. (2007)). However, both AzTEC1 and AzTEC3 are associated with VLA 10 cm emission where the corresponding maps have a noise of 4.5 Jy beam-1, which, for a typical radio spectral index of , corresponds to the equivalent 20 cm rms noise of about times lower than the aforementioned 1.4 GHz sensitivity level (Smolčić et al. (2015)). For comparison, the rms noise at 1.4 GHz in the phase centre of the seven fields analysed by Chapman et al. (2005) was 4–15 Jy beam-1, while the rms sensitivity in the 1.4 GHz imaging of the ALESS SMGs was 6 Jy beam-1 (Thomson et al. (2014)).
Some earlier studies of SMGs have suggested that more luminous SMGs lie, on average, at higher redshifts compared to less luminous SMGs (e.g. Ivison et al. (2002); Pope et al. (2006); Younger et al. (2007); Biggs et al. (2011); Smolčić et al. 2012b ). Our redshift analysis suggests that the brighter SMGs (AzTEC1–15) have a similar mean redshift () within the errors to the less bright sources in our sample (AzTEC16–30; ). Furthermore, as noted above, the median redshifts of the two subsamples are similar to each other within the uncertainties. Wall et al. (2008) suggested that there might be two SMG subpopulations, divided by their luminosity (dividing line being at L☉): these would evolve in different ways, and the corresponding luminosity functions have different shapes. However, in agreement with our result, Wardlow et al. (2011) found no significant correlation between the redshift and 870 m submm flux density for their extensive sample of LESS SMGs, although it should be noted that many () of the LESS SMGs have been resolved into multiple sources with ALMA (Karim et al. (2013); Hodge et al. (2013)). Moreover, as discussed by Hodge et al. (2013; Sect. 5.5 therein), some of the LESS SMGs suffered from missed/misidentified multiwavelength counterparts, which means that they had incorrect photometric redshifts. Overall, of the ALESS SMGs were missed by the sophisticated counterpart association utilising multiwavelength information by Biggs et al. (2011), and of the reported counterparts were found to be incorrect (Hodge et al. (2013)). However, the ALESS SMGs also do not exhibit any significant trend between the redshift and (Simpson et al. (2014); their Fig. 7). The recent semi-analytic modelling of 850 m SMG surveys by Cowley et al. (2015) predicted that the bright SMG population ( mJy) has a lower median redshift than the faint SMG population (1 mJy mJy). We note that all our 1.1 mm SMGs AzTEC1–30 would belong to the bright SMG population of Cowley et al. (2015), i.e. all our SMGs have mJy when scaling the mJy threshold by assuming that . From the 50 mock surveys of 0.5 deg2 in angular size by Cowley et al. (2015), where SMGs were generated out to , the median redshift for the bright SMGs was derived to be 2.05, while that for the faint SMGs was found to be 2.77. The authors also compared their model predictions with the ALESS SMG survey, and found that the model successfully reproduces the median redshift of the ALESS photo- distribution (see below). The opposite redshift trend predicted by Cowley et al. (2015) compared to some earlier observational results can, as suggested by the authors, be tested with future interferometric SMG surveys. They also pointed out that field-to-field variance can play a role when comparing theoretical model predictions with observational survey results.
In the following, we investigate the origin of differences in mean/median redshift for differently selected SMG samples. Weiß et al. (2013) carried out a blind redshift survey with ALMA towards 26 strongly lensed SMGs originally detected with the 10 m South Pole Telescope (SPT) at 1.4 mm. Their sample consisted of sources with high 1.4 mm flux densities of mJy, and the average redshift of the sample was found to be , significantly higher than what is found for radio-identified SMGs, but quite similar to that of AzTEC1–30 selected at 1.1 mm (). Simpson et al. (2014) presented the first photo- distribution for the ALESS SMGs derived using HYPERZ SED fitting with the spectral templates of Bruzual & Charlot (2003) rather than those optimised for SMGs by Michałowski et al. (2010) we have used (see Smolčić et al. 2012a ,b for the comparison of these model libraries in the photo- analysis). For their sample of 77 SMGs with broadband photometry, Simpson et al. (2014) found the median redshift to be ( when the 19 sources with poorer photometry were included in the analysis). This is very similar to the median spectroscopic redshift of derived by Chapman et al. (2005) for a sample of 73 radio-identified (VLA 1.4 GHz) SCUBA SMGs compiled from seven separate fields, but lower than the median redshift we derived for AzTEC1–30. To perform a more quantitative comparison with the ALESS SMG redshift distribution, we selected only those LESS SMGs (Weiß et al. (2009); Hodge et al. (2013)) with LABOCA 870 m flux densities corresponding to our AzTEC 1.1 mm flux density range (see Sect. 5.1). Altogether 17 ALESS SMGs from Simpson et al. (2014) satisfy this criterion (7.7 mJy mJy). For this 870 m flux limited sample we derived the following photometric redshift statistics: , , , and (95%). As can be seen the median value is higher than that for the original sample of 77 ALESS SMGs (Simpson et al. (2014)), but lower than the median redshift for AzTEC1-30. We also carried out a K-S test between our sample (excluding the lower limits in which case ) and the ALESS SMGs with comparable flux densities, and found that they could have a common underlying parent distribution (, ). Furthermore, the -test suggests that these two samples have a comparable average redshift ( under the null hypothesis that the two values are equal). The facts that the LESS and JCMT/AzTEC SMGs were selected at different wavelengths (870 m compared to 1.1 mm) from different fields, and that the ALESS sample is larger than ours make a direct comparison between the two questionable. Given that the lower redshift limits to some of our SMGs raise the total sample average to could be an indication that the 1.1 mm wavelength selects somewhat higher-redshift SMGs. Moreover, the ALESS sample was drawn from the Extended Chandra Deep Field South that has a size of , or 0.25 , while our SMGs were selected from the 0.15 COSMOS JCMT/AzTEC field. The intrinsic target field properties, or cosmic variance might therefore also play a role (cf. Cowley et al. (2015)).
Swinbank et al. (2014) analysed the ALESS SMGs detected in at least two Herschel/SPIRE bands. They found that the SMGs exhibiting the peak dust emission at , 350, and 500 m have median redshifts of , , and , respectively (the SPIRE non-detected sources were found to have a median photo- of ). Although the SED peak position is not always well constrained and the subsamples clearly overlap with each other (Fig. 6 in Swinbank et al. (2014)), this suggests that there is a positive correlation between the source redshift and the SED peak wavelength. Within the errors the 500 m peakers have a median redshift comparable to that of our SMGs. The highest redshift SMG known to date, HFLS3 at , is also a 500 m peaker and was originally found from the HerMES survey as having a very high 500 m flux density of mJy (Riechers et al. (2013)). Similarly, Dowell et al. (2014) selected dusty star-forming galaxies from the HerMES survey on the basis of their Herschel/SPIRE colours, and found most of the 500 m peakers (including HFLS3) to lie at very high redshifts (). The relatively high redshifts among the AzTEC1–30 COSMOS SMGs could be a selection effect in the sense that they were originally discovered at mm, although cosmic variance can also play a role because the COSMOS field is known to contain a relatively large number of very high- SMGs. Zavala et al. (2014) carried out simulations of the SMGs’ redshift distributions, and they studied how different selection effects affect the derived distributions. Their simulated data showed the increase in the median redshift as a function of wavelength (changing from at 450 m to at 2 mm). However, they demonstrated that the differences reported in the literature can be explained by the observing wavelength (related to the SED temperature) used and, to a lesser degree, by the map noise level and angular resolution, and that some of the redshift distributions suggested to be different from each other can actually be drawn from the same parent distribution.
As discussed above, the derived SMG redshift distribution can be highly affected by the wavelength selection and source sample under study. A well established example is the radio preselection that biases the sample towards lower-redshift () SMGs (Chapman et al. (2005)). However, spectroscopic observations have shown that the SMGs are more common than originally thought (see references in Sect. 1). A mix of different methods to derive the redshifts, such as spectroscopic and photometric method can also lead to a biased distribution of redshift values. For galaxies in the COSMOS field, however, it has been shown that the photo- values agree well with those derived through spectroscopic observations (Ilbert et al. (2013)). Considering only the most secure spec- values at (a sample of 12 482 galaxies), Ilbert et al. (2013) found that the photo- accuracy is and only 2.1% are catastrophic failures with . The different methods of deriving the photo- values (e.g. varied assumptions and spectral templates) can also lead to differing results, but our photo- values derived from HYPERZ using the SMG SED templates from Michałowski et al. (2010) are expected to be reliable (Smolčić et al. 2012a ,b); among our new SMG sample, this is supported by the case of AzTEC17a ( compared to ). In some cases the best photo- solution is uncertain because the corresponding distribution is complex having a broad minimum or multiple dips of comparably low value. Moreover, our SMG redshift distribution is partly based on lower limits only that were derived using the Carilli-Yun radio-submm redshift indicator (Carilli & Yun (1999), 2000). This method is subject to a degeneracy between and , and can suffer from large uncertainties. Another caveat in determining the photo- values is the possible contamination by AGNs. The reason for this is that methods based on stellar libraries might suffer from short-wavelength (UV to MIR) AGN emission (see Smolčić et al. 2012b for further discussion). However, as mentioned earlier our sources do not exhibit any strong X-ray signatures and are therefore unlikely to contain bright AGNs.
To summarise, our new interferometric observations have enabled us to pinpoint the multiwavelength counterparts of our SMGs, and therefore to derive the photo- values for these SMGs. For this type of analysis, interferometry provides an important improvement because the usage of single-dish (sub)mm data of resolution can result in a wrong counterpart identification, and therefore also wrong redshift of the SMG. For five SMGs among AzTEC1–15, we have a secure spectroscopic redshift available, but only one spec- among AzTEC16–30. In the ideal case, all the SMG redshifts would be based on spectroscopic data. This way one could carry out a completely fair comparison between our two subsamples of AzTEC1–15 and AzTEC16–30.
6 Summary and conclusions
We have used the IRAM/PdBI to carry out an interferometric 1.3 mm continuum follow-up study of a sample of 15 SMGs originally detected in the COSMOS field with the JCMT/AzTEC bolometer at 1.1 mm ( mJy) by Scott et al. (2008). The good angular resolution of about allowed us to pinpoint the positions of the actual SMGs giving rise to the single-dish detected mm emission. We combined these new observations with results from the literature to study the ensemble properties of the 30 most significant () SMGs detected by JCMT/AzTEC in the COSMOS field. Our main results and conclusions are summarised as follows:
-
1.
The total number of sources detected in this survey is 22, where the sample does consist of S/N detections (whether or not having a counterpart) and sources detected with that have multiwavelength counterparts. AzTEC19 is found to be the most significant 1.3 mm emitter (in the observed frame) with S/N.
-
2.
Visual inspection of the 1.3 mm images reveals that AzTEC19, 21, 27, and 28 have elongated/clumpy morphologies, a possible manifestation of galaxy merging. AzTEC27 appears to be a gravitationally lensed SMG, where two intervening galaxies are warping and magnifying the radiation (see Fig. 8).
-
3.
AzTEC17, 19, 21, 24, 26, and 29 appear to split into two to three sources of 1.3 mm emission. Considering our new SMG sample (15 single-dish detected sources), this would mean that the multiplicity fraction is ( if AzTEC24 is spurious). In all the other cases except AzTEC29, the source components have comparable observing-frame 1.3 mm flux densities. Among AzTEC1–15 there are two SMGs that are known to be multiple systems. Combining these statistics we conclude that the multiplicity fraction among AzTEC1–30 is . Deep, high-resolution (sub)mm surveys of large SMG samples are required to unambiguously determine how common multiplicity is among SMGs.
-
4.
Besides the spectroscopic redshift of AzTEC17a, the redshifts of AzTEC16–30 were derived using either optical/IR photometric data or the Carilli-Yun redshift indicator (Carilli & Yun (1999), 2000). In many cases only lower limits could be estimated, and the median redshift was found to be . We identified some high-redshift candidates; in particular, AzTEC17b has a photo- of , and a lower limit to of AzTEC27 was derived to be as high as . For the 15 brightest JCMT/AzTEC 1.1 mm detected SMGs, namely AzTEC1–15, the median redshift is (partly based on secure spectroscopic redshifts). For the combined sample of AzTEC1–30, the median redshift was found to be . This is higher than what is usually reported for SMGs, but in agreement with mm-selected SMG samples.
-
5.
The redshift analysis does not support the earlier observational result that brighter SMGs (our sources AzTEC1–15) would lie at higher redshifts than the fainter SMGs (AzTEC16–30). Instead, besides the median redshifts, the mean redshifts of AzTEC1–15 and AzTEC16–30 are similar to each other within the errors ( and , respectively). The -test also supports the similarity between the mean redshift values. Finally, the K-S test suggests that the two subgroups are probably drawn from a common parent population, but we note that the highest redshift () SMGs are found among the strongest millimetre emitters. The absence of any significant trend between the source redshift and millimetre flux density is in agreement with that found for the ALESS SMGs at 870 m wavelength (Simpson et al. (2014)).
Some of the great challenges in detailed observational studies of SMGs is to reliably identify their multiwavelength counterparts. While interferometric (sub)millimetre imaging is a prerequisite for secure counterpart identifications, faint SMGs, flux-boosted in single-dish observations, might not be detected in shallow interferometric maps. Moreover, as the present study demonstrates, the sample might suffer from spurious sources that may or may not have nearby sources detected at other wavelengths. The knowledge of secure counterparts is required to obtain accurate estimates of the sources’ photometric redshifts. Spectral line observations of atoms (such as the m forbidden C+ fine-structure line) or molecules (particularly rotational lines of 12CO) are needed to obtain the most reliable redshifts [cf. ALMA observations towards SPT SMGs by Weiß et al. (2013)], and hence to push forward our understanding of high-redshift, submillimetre-luminous starburst galaxies, their role in galaxy formation and evolution, and cosmic star formation history.
Acknowledgements.
We thank the referee for providing helpful and constructive comments. We would also like to thank C. M. Casey and S. Toft for their comments and suggestions. This research was funded by the European Union’s Seventh Framework programme under grant agreement 337595 (ERC Starting Grant, ’CoS-Mass’). AK acknowledges support by the Collaborative Research Council 956, sub-project A1, funded by the Deutsche Forschungsgemeinschaft (DFG). We would like to thank the IRAM staff for carrying out the PdBI observations presented in this paper. This work is partly based on data products from observations made with ESO Telescopes at the La Silla Paranal Observatory under ESO programme ID 179.A-2005 and on data products produced by TERAPIX and the Cambridge Astronomy Survey Unit on behalf of the UltraVISTA consortium. This research has made use of NASA’s Astrophysics Data System, and the NASA/IPAC Infrared Science Archive, which is operated by the JPL, California Institute of Technology, under contract with the NASA. This study also made use of APLpy, an open-source plotting package for Python hosted at http://aplpy.github.com, and TOPCAT, an interactive graphical tool for analysis and manipulation of tabular data available at http://www.star.bristol.ac.uk/mbt/topcat/ (Taylor (2005)). We greatfully acknowledge the contributions of the entire COSMOS collaboration consisting of more than 100 scientists. More information on the COSMOS survey is available at http://www.astro.caltech.edu/cosmos.References
- Alexander et al. (2003) Alexander, D. M., Bauer, F. E., Brandt, W. N., et al. 2003, AJ, 126, 539
- Alexander et al. (2005) Alexander, D. M., Bauer, F. E., Chapman, S. C., et al. 2005, ApJ, 632, 736
- (3) Aravena, M., Bertoldi, F., Carilli, C., et al. 2010a, ApJ, 708, L36
- (4) Aravena, M., Younger, J. D., Fazio, G. G., et al. 2010b, ApJ, 719, L15
- Aretxaga et al. (2011) Aretxaga, I., Wilson, G. W., Aguilar, E., et al. 2011, MNRAS, 415, 3831
- Aretxaga et al. (2012) Aretxaga, I., Wilson, G. W., Aguilar, E., et al. 2012, MNRAS, 419, 1824
- Avni (1976) Avni, Y. 1976, ApJ, 210, 642
- Barger et al. (1998) Barger, A. J., Cowie, L. L., Sanders, D. B., et al. 1998, Nature, 394, 248
- Barger et al. (2012) Barger, A. J., Wang, W.-H., Cowie, L. L., et al. 2012, ApJ, 761, 89
- Barnes & Hernquist (1991) Barnes, J. E., & Hernquist, L. E. 1991, ApJ, 370, L65
- Benson (2010) Benson, A. J. 2010, Phys. Rep, Vol. 495, p. 33
- Biggs et al. (2011) Biggs, A. D., Ivison, R. J., Ibar, E., et al. 2011, MNRAS, 413, 2314
- Blain & Longair (1993) Blain, A. W., & Longair, M. S. 1993, MNRAS, 264, 509
- Blain et al. (2002) Blain, A. W., Smail, I., Ivison, R. J., et al. 2002, Phys. Rep, Vol. 369, p. 111
- Blain et al. (2004) Blain, A. W., Chapman, S. C., Smail, I., & Ivison, R. 2004, ApJ, 611, 725
- Blain et al. (2004) Blain, A. W., Chapman, S. C., Smail, I., & Ivison, R. 2004, ApJ, 611, 725
- Bolzonella et al. (2000) Bolzonella, M., Miralles, J.-M., & Pelló, R. 2000, A&A, 363, 476
- Borys et al. (2005) Borys, C., Smail, I., Chapman, S. C., et al. 2005, ApJ, 635, 853
- Bothwell et al. (2013) Bothwell, M. S., Smail, I., Chapman, S. C., et al. 2013, MNRAS, 429, 3047
- Bruzual & Charlot (2003) Bruzual, G., & Charlot, S. 2003, MNRAS, 344, 1000
- Bussmann et al. (2012) Bussmann, R. S., Gurwell, M. A., Fu, H., et al. 2012, ApJ, 756, 134
- Bussmann et al. (2013) Bussmann, R. S., Pérez-Fournon, I., Amber, S., et al. 2013, ApJ, 779, 25
- Calzetti et al. (2000) Calzetti, D., Armus, L., Bohlin, R. C., et al. 2000, ApJ, 533, 682
- Capak et al. (2007) Capak, P., Aussel, H., Ajiki, M., et al. 2007, ApJS, 172, 99
- Capak et al. (2008) Capak, P., Carilli, C. L., Lee, N., et al. 2008, ApJ, 681, L53
- Capak et al. (2011) Capak, P. L., Riechers, D., Scoville, N. Z., et al. 2011, Nature, 470, 233
- Carilli & Yun (1999) Carilli, C. L., & Yun, M. S. 1999, ApJ, 513, L13
- Carilli & Yun (2000) Carilli, C. L., & Yun, M. S. 2000, ApJ, 530, 618
- Carilli et al. (2010) Carilli, C. L., Daddi, E., Riechers, D., et al. 2010, ApJ, 714, 1407
- Casey et al. (2013) Casey, C. M., Chen, C.-C., Cowie, L. L., et al. 2013, MNRAS, 436, 1919
- Casey et al. (2014) Casey, C. M., Narayanan, D., & Cooray, A. 2014, Phys. Rep, Vol. 541, p. 45
- Chakrabarti et al. (2008) Chakrabarti, S., Fenner, Y., Cox, T. J., et al. 2008, ApJ, 688, 972
- Chapman et al. (2005) Chapman, S. C., Blain, A. W., Smail, I., & Ivison, R. J. 2005, ApJ, 622, 772
- Chen et al. (2014) Chen, C.-C., Cowie, L. L., Barger, A. J., Wang, W.-H., & Williams, J. P. 2014, ApJ, 789, 12
- Chen et al. (2015) Chen, C.-C., Smail, I., Swinbank, A. M., et al. 2015, ApJ, 799, 194
- Combes et al. (2012) Combes, F., Rex, M., Rawle, T. D., et al. 2012, A&A, 538, L4
- Condon (1997) Condon, J. J. 1997, PASP, 109, 166
- Coppin et al. (2009) Coppin, K. E. K., Smail, I., Alexander, D. M., et al. 2009, MNRAS, 395, 1905
- Coppin et al. (2010) Coppin, K. E. K., Chapman, S. C., Smail, I., et al. 2010, MNRAS, 407, L103
- Cowley et al. (2015) Cowley, W. I., Lacey, C. G., Baugh, C. M., & Cole, S. 2015, MNRAS, 446, 1784
- Cox et al. (2011) Cox, P., Krips, M., Neri, R., et al. 2011, ApJ, 740, 63
- (42) Daddi, E., Dannerbauer, H., Stern, D., et al. 2009a, ApJ, 694, 1517
- (43) Daddi, E., Dannerbauer, H., Krips, M., et al. 2009b, ApJ, 695, L176
- Dannerbauer et al. (2008) Dannerbauer, H., Walter, F., & Morrison, G. 2008, ApJ, 673, L127
- Davé et al. (2010) Davé, R., Finlator, K., Oppenheimer, B. D., et al. 2010, MNRAS, 404, 1355
- De Breuck et al. (2014) De Breuck, C., Williams, R. J., Swinbank, M., et al. 2014, A&A, 565, A59
- Dekel et al. (2009) Dekel, A., Sari, R., & Ceverino, D. 2009, ApJ, 703, 785
- Di Matteo et al. (2005) Di Matteo, T., Springel, V., & Hernquist, L. 2005, Nature, 433, 604
- Dowell et al. (2014) Dowell, C. D., Conley, A., Glenn, J., et al. 2014, ApJ, 780, 75
- Dunne & Eales (2001) Dunne, L., & Eales, S. A. 2001, MNRAS, 327, 697
- Dye et al. (2008) Dye, S., Eales, S. A., Aretxaga, I., et al. 2008, MNRAS, 386, 1107
- Elvis et al. (2009) Elvis, M., Civano, F., Vignali, C., et al. 2009, ApJS, 184, 158
- Engel et al. (2010) Engel, H., Tacconi, L. J., Davies, R. I., et al. 2010, ApJ, 724, 233
- Feigelson & Nelson (1985) Feigelson, E. D., & Nelson, P. I. 1985, ApJ, 293, 192
- Foreman-Mackey et al. (2013) Foreman-Mackey, D., Hogg, D. W., Lang, D., & Goodman, J. 2013, PASP, 125, 306
- Frayer et al. (2000) Frayer, D. T., Smail, I., Ivison, R. J., & Scoville, N. Z. 2000, AJ, 120, 1668
- Fu et al. (2013) Fu, H., Cooray, A., Feruglio, C., et al. 2013, Nature, 498, 338
- Granato et al. (2006) Granato, G. L., Silva, L., Lapi, A., et al. 2006, MNRAS, 368, L72
- Greve et al. (2005) Greve, T. R., Bertoldi, F., Smail, I., et al. 2005, MNRAS, 359, 1165
- Guilloteau et al. (1992) Guilloteau, S., Delannoy, J., Downes, D., et al. 1992, A&A, 262, 624
- Guzzo et al. (2007) Guzzo, L., Cassata, P., Finoguenov, A., et al. 2007, ApJS, 172, 254
- Hainline et al. (2011) Hainline, L. J., Blain, A. W., Smail, I., et al. 2011, ApJ, 740, 96
- Hasinger et al. (2007) Hasinger, G., Cappelluti, N., Brunner, H., et al. 2007, ApJS, 172, 29
- (64) Hayward, C. C., Narayanan, D., Kereš, D., et al. 2013a, MNRAS, 428, 2529
- (65) Hayward, C. C., Behroozi, P. S., Somerville, R. S., et al. 2013b, MNRAS, 434, 2572
- Helsel (2005) Helsel, D. R. 2005, Nondetects And Data Analysis: Statistics for Censored Environmental Data, John Wiley and Sons, New York
- Hickox et al. (2012) Hickox, R. C., Wardlow, J. L., Smail, I., et al. 2012, MNRAS, 421, 284
- Hodge et al. (2012) Hodge, J. A., Carilli, C. L., Walter, F., et al. 2012, ApJ, 760, 11
- Hodge et al. (2013) Hodge, J. A., Karim, A., Smail, I., et al. 2013, ApJ, 768, 91
- Hopkins et al. (2006) Hopkins, P. F., Hernquist, L., Cox, T. J., et al. 2006, ApJS, 163, 1
- Hopkins et al. (2009) Hopkins, P. F., Cox, T. J., Younger, J. D., & Hernquist, L. 2009, ApJ, 691, 1168
- Hughes et al. (1998) Hughes, D. H., Serjeant, S., Dunlop, J., et al. 1998, Nature, 394, 241
- Hung et al. (2013) Hung, C.-L., Sanders, D. B., Casey, C. M., et al. 2013, ApJ, 778, 129
- Iglesias-Páramo et al. (2007) Iglesias-Páramo, J., Buat, V., Hernández-Fernández, J., et al. 2007, ApJ, 670, 279
- Ilbert et al. (2009) Ilbert, O., Capak, P., Salvato, M., et al. 2009, ApJ, 690, 1236
- Ilbert et al. (2013) Ilbert, O., McCracken, H. J., Le Fèvre, O., et al. 2013, A&A, 556, A55
- Ivison et al. (2002) Ivison, R. J., Greve, T. R., Smail, I., et al. 2002, MNRAS, 337, 1
- Ivison et al. (2011) Ivison, R. J., Papadopoulos, P. P., Smail, I., et al. 2011, MNRAS, 412, 1913
- Karim et al. (2013) Karim, A., Swinbank, A. M., Hodge, J. A., et al. 2013, MNRAS, 432, 2
- Kereš et al. (2005) Kereš, D., Katz, N., Weinberg, D. H., & Davé, R. 2005, MNRAS, 363, 2
- Kereš et al. (2009) Kereš, D., Katz, N., Fardal, M., Davé, R., & Weinberg, D. H. 2009, MNRAS, 395, 160
- Koekemoer et al. (2007) Koekemoer, A. M., Aussel, H., Calzetti, D., et al. 2007, ApJS, 172, 196
- Koprowski et al. (2014) Koprowski, M. P., Dunlop, J. S., Michałowski, M. J., et al. 2014, MNRAS, 444, 117
- Kovács et al. (2006) Kovács, A., Chapman, S. C., Dowell, C. D., et al. 2006, ApJ, 650, 592
- Larson et al. (2011) Larson, D., Dunkley, J., Hinshaw, G., et al. 2011, ApJS, 192, 16
- Leauthaud et al. (2007) Leauthaud, A., Massey, R., Kneib, J.-P., et al. 2007, ApJS, 172, 219
- Lilly et al. (1999) Lilly, S. J., Eales, S. A., Gear, W. K. P., et al. 1999, ApJ, 518, 641
- Lilly et al. (2007) Lilly, S. J., Le Fèvre, O., Renzini, A., et al. 2007, ApJS, 172, 70
- Lilly et al. (2009) Lilly, S. J., Le Brun, V., Maier, C., et al. 2009, ApJS, 184, 218
- Lindner et al. (2011) Lindner, R. R., Baker, A. J., Omont, A., et al. 2011, ApJ, 737, 83
- Lutz et al. (2011) Lutz, D., Poglitsch, A., Altieri, B., et al. 2011, A&A, 532, A90
- Magdis et al. (2011) Magdis, G. E., Daddi, E., Elbaz, D., et al. 2011, ApJ, 740, L15
- McCracken et al. (2010) McCracken, H. J., Capak, P., Salvato, M., et al. 2010, ApJ, 708, 202
- McCracken et al. (2012) McCracken, H. J., Milvang-Jensen, B., Dunlop, J., et al. 2012, A&A, 544, A156
- McCracken et al. (2013) McCracken, H. J., Milvang-Jensen, B., Dunlop, J., et al. 2013, The Messenger, 154, 29
- Michałowski et al. (2010) Michałowski, M., Hjorth, J., & Watson, D. 2010, A&A, 514, A67
- Michałowski et al. (2012) Michałowski, M. J., Dunlop, J. S., Cirasuolo, M., et al. 2012, A&A, 541, A85
- Mihos & Hernquist (1996) Mihos, J. C., & Hernquist, L. 1996, ApJ, 464, 641
- Narayanan et al. (2010) Narayanan, D., Hayward, C. C., Cox, T. J., et al. 2010, MNRAS, 401, 1613
- Neri et al. (2014) Neri, R., Downes, D., Cox, P., & Walter, F. 2014, A&A, 562, A35
- Oke (1974) Oke, J. B. 1974, ApJS, 27, 21
- Oliver et al. (2012) Oliver, S. J., Bock, J., Altieri, B., et al. 2012, MNRAS, 424, 1614
- Pope et al. (2006) Pope, A., Scott, D., Dickinson, M., et al. 2006, MNRAS, 370, 1185
- Puccetti et al. (2009) Puccetti, S., Vignali, C., Cappelluti, N., et al. 2009, ApJS, 185, 586
- Reid et al. (1988) Reid, M. J., Schneps, M. H., Moran, J. M., et al. 1988, ApJ, 330, 809
- Renzini (2006) Renzini, A. 2006, ARA&A, 44, 141
- Riechers et al. (2010) Riechers, D. A., Capak, P. L., Carilli, C. L., et al. 2010, ApJ, 720, L131
- Riechers et al. (2011) Riechers, D. A., Hodge, J., Walter, F., Carilli, C. L., & Bertoldi, F. 2011b, ApJ, 739, L31
- Riechers et al. (2013) Riechers, D. A., Bradford, C. M., Clements, D. L., et al. 2013, Nature, 496, 329
- Riechers et al. (2014) Riechers, D. A., Carilli, C. L., Capak, P. L., et al. 2014, ApJ, 796, 84
- Sanders & Mirabel (1996) Sanders, D. B., & Mirabel, I. F. 1996, ARA&A, 34, 749
- Sanders et al. (2007) Sanders, D. B., Salvato, M., Aussel, H., et al. 2007, ApJS, 172, 86
- Schinnerer et al. (2007) Schinnerer, E., Smolčić, V., Carilli, C. L., et al. 2007, ApJS, 172, 46
- Schinnerer et al. (2008) Schinnerer, E., Carilli, C. L., Capak, P., et al. 2008, ApJ, 689, L5
- Schinnerer et al. (2010) Schinnerer, E., Sargent, M. T., Bondi, M., et al. 2010, ApJS, 188, 384
- Scott et al. (2008) Scott, K. S., Austermann, J. E., Perera, T. A., et al. 2008, MNRAS, 385, 2225
- (117) Scoville, N., Aussel, H., Brusa, M., et al. 2007a, ApJS, 172, 1
- (118) Scoville, N., Aussel, H., Benson, A., et al. 2007b, ApJS, 172, 150
- Sharon et al. (2013) Sharon, C. E., Baker, A. J., Harris, A. I., & Thomson, A. P. 2013, ApJ, 765, 6
- Silva et al. (1998) Silva, L., Granato, G. L., Bressan, A., & Danese, L. 1998, ApJ, 509, 103
- Simpson et al. (2014) Simpson, J. M., Swinbank, A. M., Smail, I., et al. 2014, ApJ, 788, 125
- Smail et al. (1997) Smail, I., Ivison, R. J., & Blain, A. W. 1997, ApJ, 490, L5
- Smail et al. (1998) Smail, I., Ivison, R. J., Blain, A. W., & Kneib, J.-P. 1998, ApJ, 507, L21
- Smolčić et al. (2011) Smolčić, V., Capak, P., Ilbert, O., et al. 2011, ApJ, 731, L27
- (125) Smolčić, V., Navarrete, F., Aravena, M., et al. 2012a, ApJS, 200, 10
- (126) Smolčić, V., Aravena, M., Navarrete, F., et al. 2012b, A&A, 548, A4
- Smolčić et al. (2015) Smolčić, V., Karim. A., Miettinen, O., et al. 2015, A&A, in press, arXiv:1412.3799
- Solomon et al. (1997) Solomon, P. M., Downes, D., Radford, S. J. E., & Barrett, J. W. 1997, ApJ, 478, 144
- Spergel et al. (2007) Spergel, D. N., Bean, R., Doré, O., et al. 2007, ApJS, 170, 377
- Springel & Hernquist (2005) Springel, V., & Hernquist, L. 2005, ApJ, 622, L9
- Springel et al. (2005) Springel, V., Di Matteo, T., & Hernquist, L. 2005, MNRAS, 361, 776
- Steinhardt et al. (2014) Steinhardt, C. L., Speagle, J. S., Capak, P., et al. 2014, ApJ, 791, LL25
- Swinbank et al. (2006) Swinbank, A. M., Chapman, S. C., Smail, I., et al. 2006, MNRAS, 371, 465
- Swinbank et al. (2008) Swinbank, A. M., Lacey, C. G., Smail, I., et al. 2008, MNRAS, 391, 420
- (135) Swinbank, A. M., Papadopoulos, P. P., Cox, P., et al. 2011, ApJ, 742, 11
- Swinbank et al. (2012) Swinbank, A. M., Karim, A., Smail, I., et al. 2012, MNRAS, 427, 1066
- Swinbank et al. (2014) Swinbank, A. M., Simpson, J. M., Smail, I., et al. 2014, MNRAS, 438, 1267
- Tacconi et al. (2006) Tacconi, L. J., Neri, R., Chapman, S. C., et al. 2006, ApJ, 640, 228
- Tacconi et al. (2008) Tacconi, L. J., Genzel, R., Smail, I., et al. 2008, ApJ, 680, 246
- Taniguchi et al. (2007) Taniguchi, Y., Scoville, N., Murayama, T., et al. 2007, ApJS, 172, 9
- Taylor (2005) Taylor, M. B. 2005, Astronomical Data Analysis Software and Systems XIV, ASP Conference Series, Vol. 347, p. 29
- Thomson et al. (2014) Thomson, A. P., Ivison, R. J., Simpson, J. M., et al. 2014, MNRAS, 442, 577
- Toft et al. (2014) Toft, S., Smolčić, V., Magnelli, B., et al. 2014, ApJ, 782, 68
- Umehata et al. (2014) Umehata, H., Tamura, Y., Kohno, K., et al. 2014, MNRAS, 440, 3462
- Wall et al. (2008) Wall, J. V., Pope, A., & Scott, D. 2008, MNRAS, 383, 435
- Walter et al. (2012) Walter, F., Decarli, R., Carilli, C., et al. 2012, Nature, 486, 233
- Wang et al. (2011) Wang, W.-H., Cowie, L. L., Barger, A. J., & Williams, J. P. 2011, ApJ, 726, L18
- Wang et al. (2013) Wang, S. X., Brandt, W. N., Luo, B., et al. 2013, ApJ, 778, 179
- Wardlow et al. (2011) Wardlow, J. L., Smail, I., Coppin, K. E. K., et al. 2011, MNRAS, 415, 1479
- Weiß et al. (2009) Weiß, A., Kovács, A., Coppin, K., et al. 2009, ApJ, 707, 1201
- Weiß et al. (2013) Weiß, A., De Breuck, C., Marrone, D. P., et al. 2013, ApJ, 767, 88
- Wilson et al. (2008) Wilson, G. W., Austermann, J. E., Perera, T. A., et al. 2008, MNRAS, 386, 807
- Younger et al. (2007) Younger, J. D., Fazio, G. G., Huang, J.-S., et al. 2007, ApJ, 671, 1531
- Younger et al. (2008) Younger, J. D., Dunlop, J. S., Peck, A. B., et al. 2008, MNRAS, 387, 707
- Younger et al. (2009) Younger, J. D., Fazio, G. G., Huang, J.-S., et al. 2009, ApJ, 704, 803
- Yun et al. (2012) Yun, M. S., Scott, K. S., Guo, Y., et al. 2012, MNRAS, 420, 957
- Zamojski et al. (2007) Zamojski, M. A., Schiminovich, D., Rich, R. M., et al. 2007, ApJS, 172, 468
- Zavala et al. (2014) Zavala, J. A., Aretxaga, I., & Hughes, D. H. 2014, MNRAS, 443, 2384
Appendix A Multiwavelength images
A selection of zoomed-in multiwavelength views towards AzTEC16–30 is shown in Fig. 7. In the first (top left) panel of each source we show the PdBI 1.3 mm image overlaid with the same contour levels as in Fig. 1. The PdBI images are also annotated with the source designations. The positive 1.3 mm contours are overlaid on the other wavelength images to guide the eye.
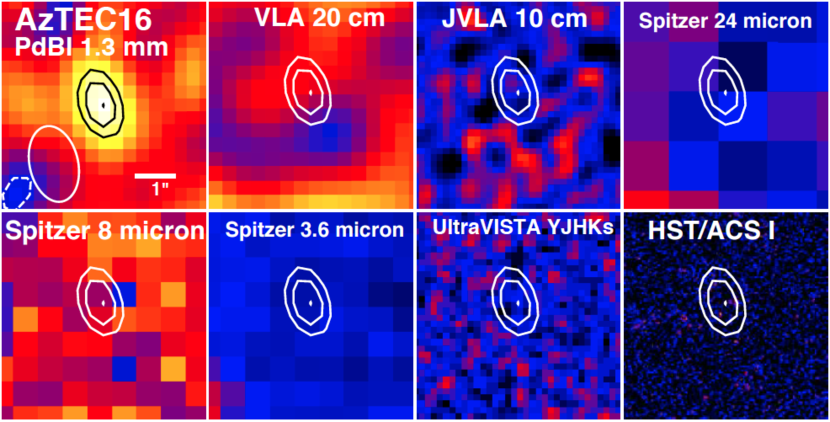
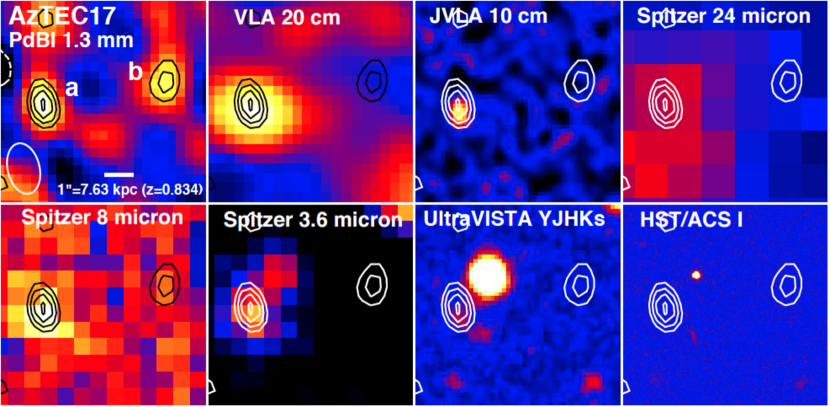
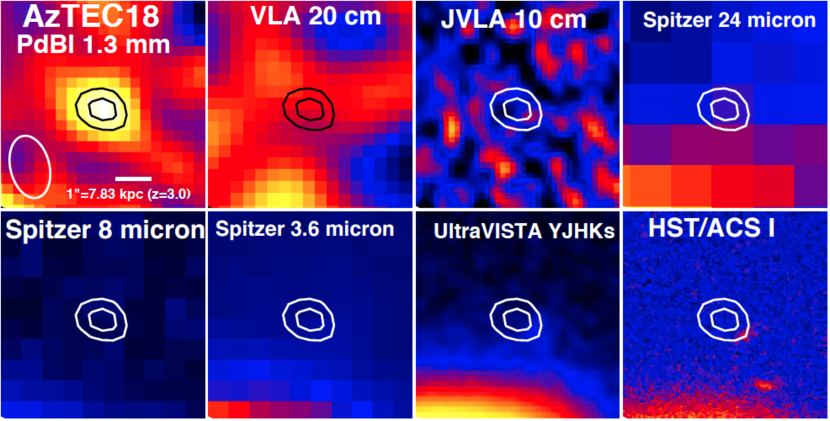
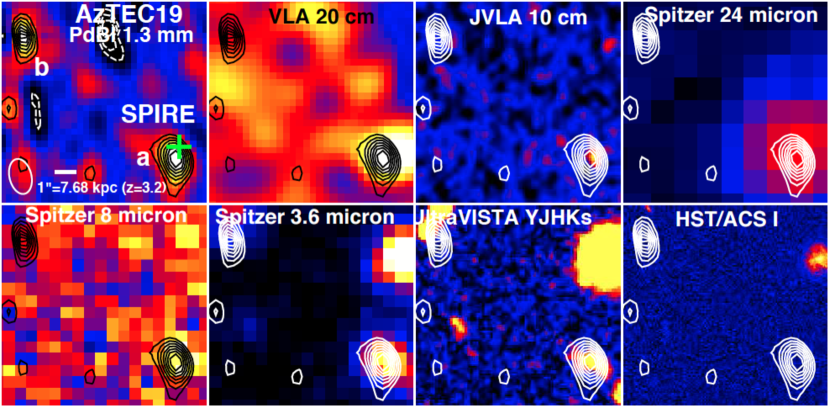
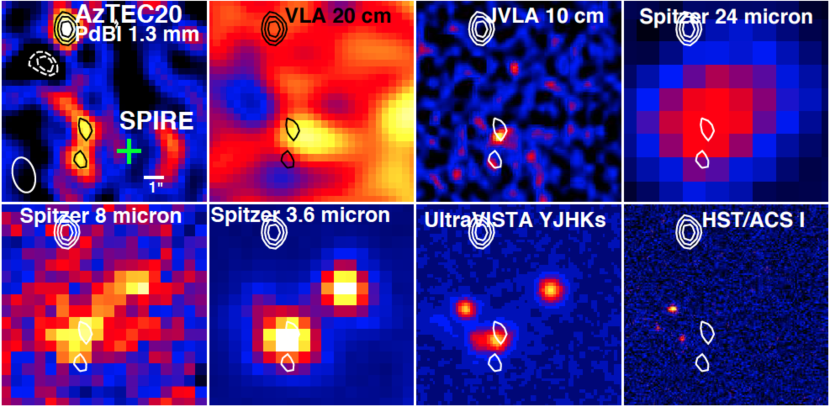
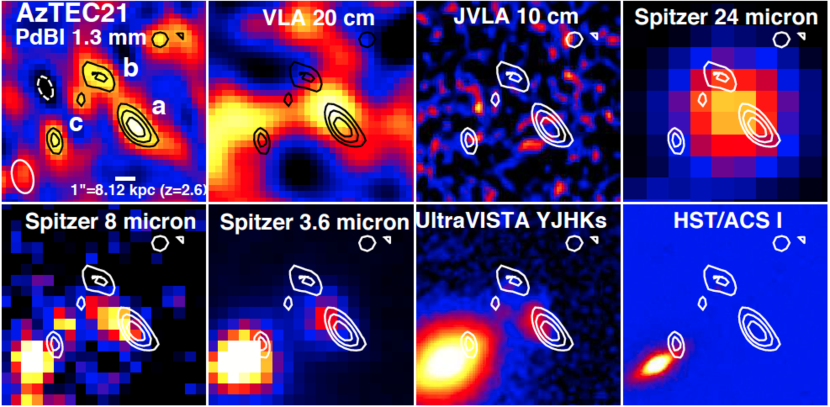
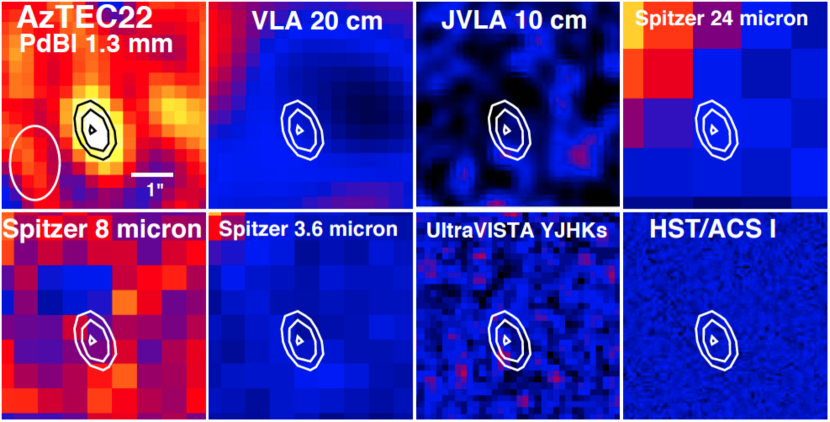
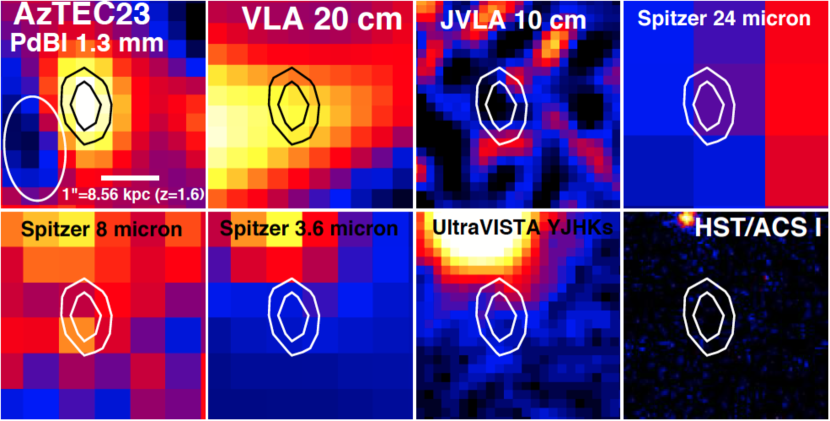
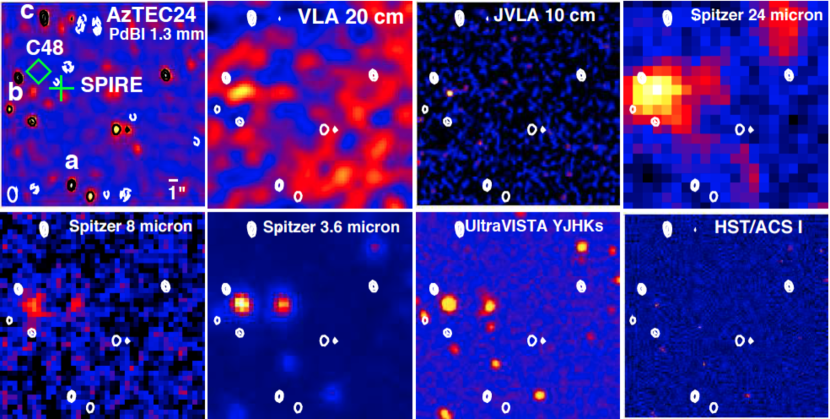
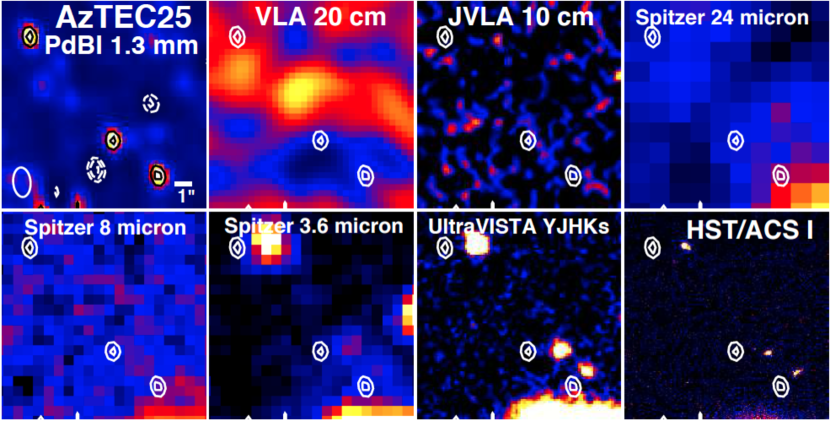
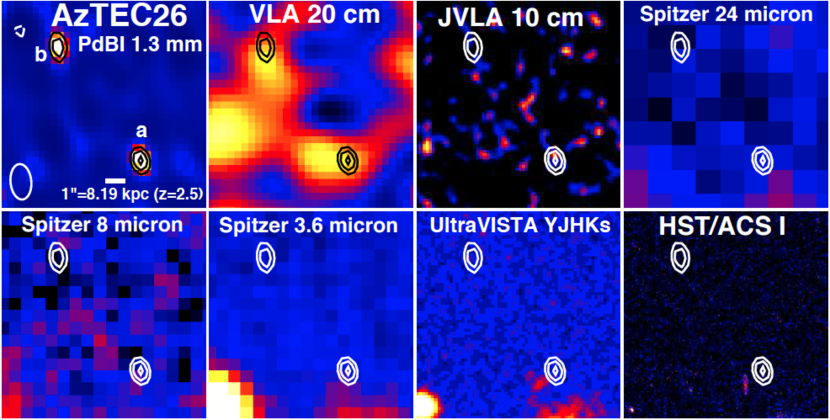
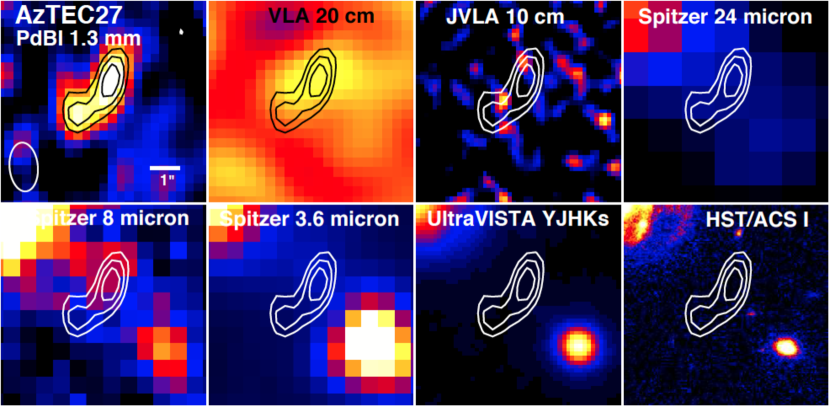
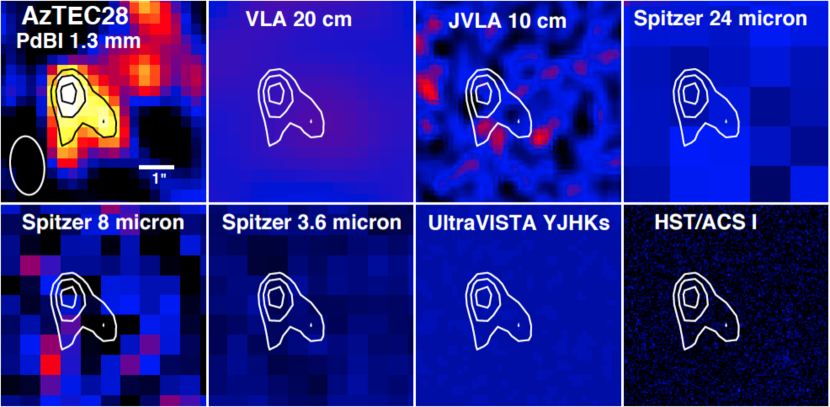
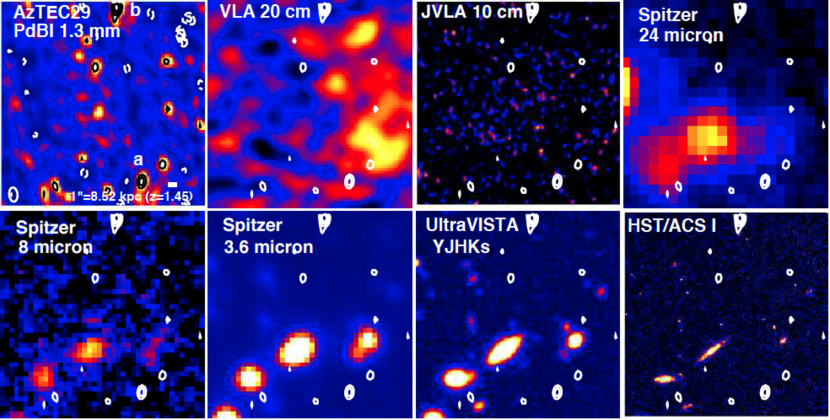
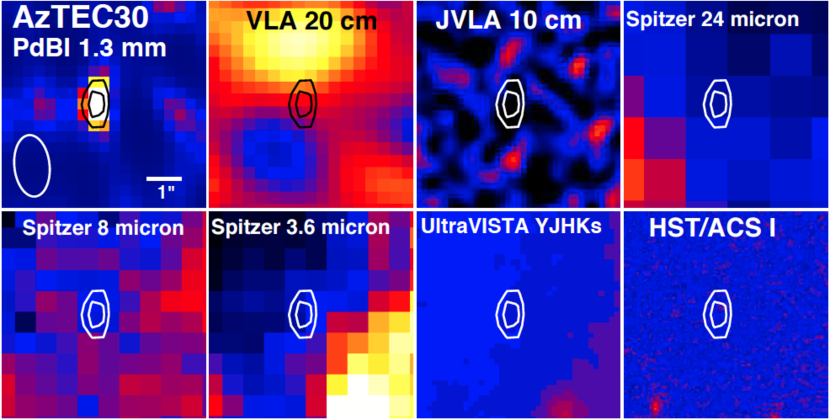
Appendix B Updated redshifts of the 15 brightest JCMT/AzTEC-detected SMGs: AzTEC1–15
Here we provide the reader with an overview of the redshifts of the SMA-detected SMGs AzTEC1–15. Among these SMGs, there are eight spectroscopic redshifts reported in the literature: for AzTEC1, 2, 3, 5, 6, 8, 9, and 11 (see Smolčić et al. 2012b ; their Tables 1 and 4 and references therein). Despite the partially extensive efforts and data coverage some of these redshift determinations are still uncertain. We discuss below the updated redshifts among AzTEC1–15 and the cases where there is some confusion about the source redshifts in the literature.
Smolčić et al. (2011) determined a spectroscopic redshift of for AzTEC1. The UV–NIR photometric redshift they derived, , was found to be very similar to the value, although a secondary photo- solution at was also found. A somewhat lower photo- of was derived by Smolčić et al. (2012b) using the same method as in the present paper (Sect. 4.2). The CO spectral-line observations using the Redshift Search Receiver (RSR) on the Large Millimetre Telescope (LMT) performed by M. S. Yun et al. (in prep.) yielded a spec- value of 4.3421 for AzTEC1. Their SMA follow-up observations of C+ emission yielded a line detection at , in very good agreement with the CO observations. Since it is based on interferometric observations, this last redshift is adopted in the present work. We note that the new spec- of AzTEC1 explains the non-detection of the CO line emission by Smolčić et al. (2011) because their PdBI and Combined Array for Research in Millimetre-wave Astronomy (CARMA) observations covered the redshift ranges 4.56–4.76 and 4.94–5.02.
The optical spectrum observed with the Deep Extragalactic Imaging Multi-Object Spectrograph (DEIMOS) on the 10 m Keck II telescope towards AzTEC2 exhibits an emission feature that can be assigned to the forbidden-line doublet at , and the rotational line of CO detected with CARMA suggests a similar redshift (; M. Baloković et al., in prep.). Following Smolčić et al. (2012b), we adopt the value as the redshift of AzTEC2. Koprowski et al. (2014) claimed that the target position of these spectral line observations was away from the SMA 890 m position (Younger et al. (2007)). They concluded that the SMG lies at a redshift of derived from the radio/submm flux-density ratio because the radio source is only away from the SMA position. The redshift we derived from the radio/submm flux-density ratio is . The latter difference emerges because Koprowski et al. (2014) based their calculation on the average SMG spectral template derived by Michałowski et al. (2010), while we utilised the Carilli-Yun redshift indicator (Carilli & Yun (1999), 2000) as described in Sect. 4.2. However, as shown in Fig. 9, the Keck/DEIMOS slit was centred from the SMA position, and the spectrum was extracted from the SMA peak of the SMG. Moreover, the EW-oriented DEIMOS slit did not cover the optically visible foreground galaxy on the southern side of AzTEC2 (UltraVISTA ID 232116, ; cf. Fig. B1 in Koprowski et al. (2014)). This implies that the redshift of AzTEC2 is close to unity instead of the higher value proposed by Koprowski et al. (2014).
The spec- of AzTEC5 was previously reported to be (Smolčić et al. 2012b ). The Keck/DEIMOS slit position and orientation are shown in Fig. 9. We note that the slit does not include emission from galaxies other than AzTEC5, but the corresponding DEIMOS spectrum is of poor quality. Therefore, we adopt the photo- of from Smolčić et al. (2012b). For comparison, Koprowski et al. (2014) derived a photo- of . The redshift we derived from the radio/submm flux-density ratio using the Carilli & Yun (2000) formula (see Sect 4.2), , is also lower than the value calculated by Koprowski et al. (2014).
Koprowski et al. (2014) argued that the spectroscopic redshift of AzTEC6, , is uncertain because it is measured towards an optically visible object about from the SMA position (Younger et al. (2007)), and that the submm/radio flux ratio of AzTEC6 is inconsistent with a low redshift (they derived a value of from the radio/submm flux-density ratio, while we derive the value because AzTEC6 is not detected at 20 cm). The photo- value derived by Smolčić et al. (2012b), , is similar to the value, while Koprowski et al. (2014) reported a value of for this object. The above-mentioned optically visible galaxy lies only from the SMA position, and away from the Keck/DEIMOS slit centre (see Fig. 9). The above spec- value was derived from a high quality spectrum (flag 4; J. S. Kartaltepe et al., in prep.) extracted from a position that lies from the SMA position, and coincides with the optical galaxy. This implies that the spectral line emission originates in this foreground object as suggested by Koprowski et al. (2014). A redshift of indeed conflicts with the non-detection of AzTEC6 at 20 cm, and we therefore adopt the redshift .
The DEIMOS spec- of AzTEC9 was reported to be 1.357, and its corresponding photo- was found to be (Smolčić et al. 2012b ). However, the spec- value is based on a relatively weak spectrum (M. Salvato et al., in prep.), and is therefore quite uncertain. Koprowski et al. (2014) reported that the above redshift values refer to an object as far as about from the SMA position (Younger et al. (2009)). Again, this is not the case, but the DEIMOS spectrum was extracted from the SMA position (the slit centre was offset from the SMA peak by ; see Fig. 9). Koprowski et al. (2014) stated that the submm/radio flux-density ratio of AzTEC9 is inconsistent with a redshift value close to unity [they derived , while our result based on the Carilli & Yun (2000) redshift formula is ]. They also derived a high photo- of for AzTEC9 (counterpart lying from the SMA position). There is a Spitzer/IRAC source from the SMA position, and the Wardlow et al. (2011) redshift formula gives a redshift of , which is similar to the redshift we inferred from the radio/submm flux-density ratio, but considerably lower than the redshifts derived by Koprowski et al. (2014). In the present study, we adopt the photo- of from Smolčić et al. (2012b) because the corresponding distribution exhibits a clear minimum at that value (see Fig. 6 in Smolčić et al. 2012b ).
For AzTEC10, the photo- derived by Smolčić et al. (2012b) is , while Koprowski et al. (2014) determined a photo- of for the optical/NIR source about from the SMA position. The most up-to-date COSMOS spectroscopic-redshift catalogue gives a likely (quality flag 2) DEIMOS redshift value of towards AzTEC10 (only offset from the SMA position; M. Salvato et al., in prep.). As illustrated in Fig. 9, the DEIMOS slit however picked up emission from a foreground galaxy at (ID 302846 in the new UltraVISTA catalogue) that lies NW of AzTEC10. Since AzTEC10 is not detected at 1.4 GHz, it appears to lie at a high redshift. In the present study, we adopt the photo- from Smolčić et al. (2012b), but note that because of the multiple nearby counterparts of this source (three within ) it is difficult to obtain accurate photometry for AzTEC10.
Both AzTEC13 and AzTEC14-E have neither optical nor IRAC counterparts, and we derived lower limits of and for their radio/submm flux-ratio based redshifts [these differ from the values and derived by Smolčić et al. (2012b) because of the different assumptions that we used here]. These lower limits are consistent with the corresponding values of Koprowski et al. (2014), i.e. and , respectively. The updated COSMOS spec- catalogue gives a high quality (flag 4) DEIMOS redshift of for a target that is away from the SMA position of AzTEC13 (M. Salvato et al., in prep.), where the spectroscopic slit centre was positioned away from the SMA peak). This redshift is much lower than the other estimates mentioned above. However, as shown in Fig. 9, there are two foreground galaxies lying SE and SW from AzTEC13 (UltraVISTA IDs 268116 and 268129 with the photo- values of 0.49 and 0.45, respectively); these could have contaminated the spectral line measurements, although they do not lie within the slit boundaries. A low redshift of AzTEC13 would indeed be inconsistent with the radio non-detection (cf. AzTEC6). For both AzTEC13 and AzTEC14-E, we adopt the redshifts derived from the radio/submm flux ratio ( and ).
Appendix C Multiwavelength counterparts and redshifts of the SMGs AzTEC16–30
Below we describe the multiwavelength appearances of our PdBI SMGs and provide notes of their redshifts.
AzTEC16. The point-like 1.3 mm emission feature near the edge of the PB FWHM appears to have no counterparts at other wavelengths. Altogether four negative sources were found in this field with , three of which lie outside the PB. Hence, AzTEC16 could be spurious despite its relatively high significance. We note that west of the target field centre, there is a (35.6 Jy beam-1) VLA 20 cm source, which also appears to be detected at Spitzer/IRAC and 24 m wavelengths. This source can be identified as the galaxy J095950.03+024416.5 from the COSMOS optical/NIR catalogue (Capak et al. (2007)); its UltraVISTA DR1 photometric-redshift catalogue ID is 319194 (; Ilbert et al. (2013)). The radio non-detection of AzTEC16 suggests a lower limit of to its redshift. In Table 1 of Smolčić et al. (2012b), the source called AzTEC16 at a spectroscopic redshift of 1.505 (based on high-resolution CO observations with CARMA; K. Sheth et al., in prep.) corresponds to AzTEC42 in our nomenclature (cf. Scott et al. (2008); Table 1 therein).
AzTEC17. The 1.3 mm source AzTEC17a (lying SW of the pointing centre, and detected at a significance level of ) is clearly associated with the 20 cm source COSMOSVLADP-J095939.19+023403.6 ( Jy), and a VLA 10 cm source (37 Jy beam-1 or ). The source also shows Spitzer/MIPS and IRAC emission. There is a Herschel 250 m source east of AzTEC17a [ID 1753 in the COSMOS SPIRE 250 m Photometry Catalogue from HerMES (Oliver et al. (2012))]. The search for Herschel counterparts was performed by using a search radius of , i.e. half the SPIRE beam FWHM at m. AzTEC17a has an optical-NIR counterpart about SW of the 1.3 mm emission peak [ID 1475165 in the COSMOS photometry catalogue (Capak et al. (2007))]. We note that the source visible in the UltraVISTA and ACS -band images, lying NW in projection from AzTEC17a, is the galaxy COSMOS J095939.12+023405.1 (Capak et al. (2007)), which has a photometric redshift of (the source 271694 in the DR1 UltraVISTA photometric-redshift catalogue; Ilbert et al. (2013)). Cross-correlation with the COSMOS photometry catalogue yielded a candidate optical counterpart for AzTEC17b (ID 1475223), about SW of the PdBI emission peak. However, AzTEC17b has no counterparts at UltraVISTA bands or at MIR or cm wavelengths. There are two negative sources ( and ) within of the phase centre. As AzTEC17a is a confirmed SMG, this could mean that the source AzTEC17b is spurious.
For AzTEC17a, the primary photo- solution is . Because the source of this photo- lies about from the PdBI position, it is questionable whether it is related to AzTEC17a (although it is within the synthesised beam). The primary photo- value is however comparable to the very secure (quality flag 3) spectroscopic redshift measured towards AzTEC17a ( offset from the PdBI position) with Keck/DEIMOS (M. Salvato et al., in prep.). We note that for the measurements the slit was centred on a position away from AzTEC17a (see Appendix E), and that there are no HST/ACS -band sources within the slit boundaries. For comparison, the angular offset between the 1.4 GHz radio source and the PdBI detection peak is only , and the redshift derived from the radio/submm flux density ratio is . A comparable redshift of was derived from the Wardlow et al. [2011; their Eq. (1)] redshift estimator based on the Spitzer/IRAC 3.6 m and 8 m flux densities. The last two values agree with a shallow “bowl” in the distribution at , but the value is adopted in the present work. For AzTEC17b we derive a photo- of . There is a dip in the distribution also at . However, the 1.4 GHz non-detection towards AzTEC17b results in a lower limit to its redshift of , which is consistent with the above photo- value of .
AzTEC18. The 1.3 mm source seen towards AzTEC18 has counterparts at optical and NIR wavelengths ( from the PdBI position), and is therefore considered a potential SMG. This is further supported by the fact that only one negative source, being of significance, was detected in this field.
AzTEC18 has a photo- solution of , which is consistent with the redshift derived from the radio/submm flux-density ratio of .
AzTEC19. AzTEC19a lies NE of the SCUBA-2 source SMMJ100028.6+023201 (or 450.00 or 850.07) identified by Casey et al. (2013). This angular offset is within the JCMT/SCUBA-2 beam size (FWHM) of at 450 m. With the deboosted flux densities of mJy and mJy, this was the strongest 450 m source found by Casey et al. (2013) in the COSMOS field. These authors identified two possible optical counterparts to SMMJ100028.6+023201 (see their Table 6), but our higher-resolution observations show that only one of them – lying west of the PdBI peak position – can be taken as a candidate counterpart (the other source lies SW of the PdBI peak). AzTEC19a was also detected by Herschel. In the COSMOS SPIRE 250 m Photometry Catalogue, the source ID is 2277 ( offset). AzTEC19a is associated with both a 20 and 10 cm radio-continuum source. In the VLA Deep Catalogue, the corresponding source has the name COSMOSVLADP-J100028.70+023203.7 ( Jy). The 10 cm peak flux density is Jy beam-1, making it a detection. The source is also associated with Spitzer IR emission. The 1.3 mm source AzTEC19b lying at the border of the PdBI PB has some Spitzer/IRAC 3.6 m and lower wavelength emission just north of it. This emission can be associated with the galaxy COSMOS J100029.24+023211.5 (Capak et al. (2007)), which has a photo- of about 1.27 (source 262768; Ilbert et al. (2013)). As it lies NW of the 1.3 mm peak, it is probably unrelated to AzTEC19b. However, there is also a NIR source within the contour of 1.3 mm emission, about from the mm peak. In the COSMOS ACS -band photometry catalogue (Leauthaud et al. (2007)), the ID of this source is 1486, while in the DR1 UltraVISTA catalogue its ID is 262766, and its reported photo- value is about 1.30 (Ilbert et al. (2013)). Three negative sources (, , ) were detected in the AzTEC19 field. However, only one of them () lies within the PB FWHM ( from the phase centre), while the remaining two lie outside the PB ( away from the phase centre). Because AzTEC19a is confirmed, and AzTEC19b has a high 1.3 mm detection S/N of 9.7 and is associated with multiwavelength emission, we are not expecting to have any spurious sources in this field.
The optical/IR counterpart of AzTEC19a (CFHT ), located only from the PdBI position, has a photo- solution of . There is a spec- value of 1.048 measured for a source only from the PdBI position of AzTEC19a with the VLT Visible Multi-Object Spectrograph (VIMOS) in the zCOSMOS project. However, the corresponding quality flag is 1.1, meaning that the value is insecure ( reliability). For the 1.4 GHz source – situated from the PdBI position – we derived a radio/submm-based redshift of , which is comparable within the errors with our photo- solution. For comparison, Casey et al. (2013) derived a photometric redshift of for their SMG source SMMJ100028.6+023201, which is associated with AzTEC19a. A comparable value of can be derived from the Spitzer IRAC/MIPS flux densities [Pope et al. (2006); their Eq. (2)], and the value is obtained when using the IRAC 3.6 m and 8 m flux densities (Wardlow et al. (2011)). In the present paper, we adopt our photo- solution of for AzTEC19a. For AzTEC19b, the photo- solution of is adopted as the redshift of the aforementioned SMG, while the 1.4 GHz non-detection suggests a very high radio/submm-based redshift of , where no SMGs have been discovered to date. There is, however, a degeneracy between the dust temperature of the source and its redshift (both affecting the source SED), and the radio dimness of AzTEC19b could in principle be the result of a low dust temperature (e.g. Blain et al. (2002); Kovács et al. (2006)).
AzTEC20. Interestingly, the source about north of the phase centre shows no emission at other wavelengths. The features of 1.3 mm emission seen near the phase centre appear instead to be associated with a source seen at several different wavelengths from 20 cm to NIR. The UltraVISTA catalogue ID of the latter source is 306331 (; Ilbert et al. (2013)). The 20 cm source has a peak flux density of 42.3 Jy beam-1, hence has a S/N ratio of about 3.5. We note that the VLA Deep catalogue contains sources down to or about 48 Jy beam-1 (Schinnerer et al. (2010)). About west of this source, a slightly stronger 20 cm source candidate (45 Jy beam-1 or ) can be seen. The 10 cm source near the PdBI phase-tracking centre is a detection (28.1 Jy beam-1). The Spitzer/MIPS 24 m emission is quite extended, but is clearly resolved into two sources in the IRAC 3.6 m image and yet more sources in the UltraVISTA NIR images. The Herschel/HerMES/SPIRE 250 m catalogue (Oliver et al. (2012)) contains a source (ID 3076) near the phase centre, from our PdBI source. There is one negative source of significance in this field, located on the SE side of our 1.3 mm source. Although the positive source is more significant () compared to the negative feature, and it fulfils our detection criterion of , it has no optical-to-IR counterparts that could confidently confirm that it is real. The lack of radio emission from AzTEC20 yields a lower redshift limit of .
AzTEC21. The south-western clump of the detected filamentary structure, AzTEC21a, is associated with a 20 cm source of peak flux density of 63 Jy beam-1 (). This also coincides with the position of a Spitzer IR source. AzTEC21b is probably part of the same structure (see below). The bright galaxy lying SE of AzTEC21c is COSMOS J100002.93+024639.9 (; Capak et al. (2007)). The ID of this galaxy in the DR1 UltraVISTA catalogue is 327783, and its photo- is about 0.34 (Ilbert et al. (2013)). We note that the source ID in the zCOSMOS catalogue is 846495, but its spectroscopic redshift measurement could not be attempted (confidence class 0; Lilly et al. (2007), 2009).
For AzTEC21a, the photo- solution is (for a source with the CFHT colour ). The optical/NIR source lies only away (NE) from the PdBI source according to the previous COSMOS/UltraVISTA catalogue (ID 1688587), but in the most recent UltraVISTA-TERAPIX DR the nearest source (ID 328878) lies NE, i.e. 8.5 times further away from our source, making the reliability of the proposed counterpart questionable. The 1.4 GHz non-detection (only ) suggests a high redshift of . On the other hand, the Spitzer photometric redshift is estimated to be about 1.5 (Pope et al. (2006)), and the value is derived using the Wardlow et al. (2011) IRAC flux-density method. The last value is comparable to our photo- of . For AzTEC21b, we derived a redshift of (source from the PdBI peak; CFHT/), while the radio/submm based value is , consistent with our photo- solution. The most recent UltraVISTA DR does not contain a nearby () counterpart to AzTEC21b. We note that the overall 1.3 mm emission morphology (Fig. 7) could indicate a relation between AzTEC21a and 21b, and this is further supported by their comparable photo- values of and (i.e. their redshifts could be identical). For AzTEC21c, we derived a lower limit of from the upper limit to the 1.4 GHz flux density.
AzTEC22. The candidate point-like PdBI source at the southern edge of the field has no counterparts at other wavelengths. The detection of two negative features with and 5.9 in this field provides a hint that the 1.3 mm detection is spurious. A submm source was detected with Herschel towards our phase centre (250 m ID 5470), about north from the above mentioned PdBI feature. Moreover, about from our pointing centre, there is the 20 cm source COSMOSVLADPP-J095950.57+022827.5 ( Jy), which is also seen in the VLA 10 cm image (58.6 Jy beam-1 or ). The Spitzer IR images show a “double source”, and a stronger 24 m emitter is associated with the above-mentioned radio-continuum source J095950.57+022827.5. A trace of 20 cm emission (43.8 Jy beam-1 peak surface brightness) can also be seen towards the position of the weaker 24 m source. The two Spitzer sources can be seen in the UltraVISTA NIR images: the NW one has the ID 244762 (), while the SE source is 244405 at (Ilbert et al. (2013)). For our PdBI detection the lack of a radio counterpart suggests a redshift of .
AzTEC23. The 1.3 mm feature seen towards this source ( NW of the AzTEC centroid) has counterparts at optical-NIR wavelengths ( from the PdBI position). Cross-correlation with the Herschel/SPIRE 250 m catalogue shows the presence of a source (ID 2659) about NW from the 1.3 mm feature. A visual inspection of the VLA 20 cm image reveals an EW-oriented, elongated emission feature, whose western emission peak ( from the 1.3 mm source) has a peak surface brightness of 43.5 Jy beam-1 and the eastern peak has the surface brightness of 39.8 Jy beam-1.
We derived a primary photo- of with a secondary solution at , while the radio non-detection implies the lower limit . We adopt the redshift but note that the distribution of AzTEC23 is quite complex.
AzTEC24. This source is called AzTEC/C48 in the ASTE/AzTEC 1.1 mm catalogue of Aretxaga et al. (2011). The ASTE/AzTEC peak position lies NE of the JCMT/AzTEC centroid. We have found three candidate PdBI sources of significance (outside/at the border of the PB), but none of them have counterparts at other wavelengths. Altogether five negative sources with were detected in the field, and two of them lie outside the PB FWHM. Hence, the identified positive 1.3 mm sources might be spurious and should be treated with caution. About SW from AzTEC24b there is a Herschel submm source (250 m ID 4991). Moreover, SW from AzTEC24b there is the VLA 20 cm source COSMOSVLADP-J100039.28+023845.3 ( Jy). Aretxaga et al. (2011) associated this source with the radio counterpart of their source AzTEC/C48 ( separation). In the VLA 10 cm image, a source with a peak flux density of 28.5 Jy beam-1 () can be seen at the 20 cm source position. The cm radio-continuum source is also associated with Spitzer IR emission. When referring to the COSMOS catalogue of Capak et al. (2007), the source can be identified as the galaxy COSMOS J100039.29+023845.4, and in the UltraVISTA catalogue the source ID is 293896 (; Ilbert et al. (2013)). For the three radio non-detected components AzTEC24a, 24b, and 24c we derived lower redshift limits of , , , respectively.
AzTEC25. In this field, none of the 1.3 mm point-like features fulfilled our detection criteria. We note that of the feature (the most south-western feature shown in Fig. 7) there is the source 1925434 from the COSMOS+UltraVISTA catalogue, but its CFHT/-band magnitude ( mag) with respect to the CFHT/-band and UltraVISTA -band magnitudes ( mag and mag, respectively) suggests a very blue colour index, hence it is unlikely related to the 1.3 mm feature.131313If the dust column density in the SMG is high, it is expected to appear reddened. However, if the spatial distribution of dust is inhomogeneous, the unobscured star formation could cause the galaxy to appear blue. Moreover, the viewing angle can contribute to the observed effective colour of the galaxy (see e.g. Wang et al. (2013)). There are also two negative sources ( and ) in the field, inside the PB FWHM. In the VLA 20 cm map, a source candidate with a peak surface brightness of 58.7 Jy beam-1 (only ) is visible close to our pointing centre ( away). However, no shorter-wavelength emission can be seen towards this source.
AzTEC26. Two 1.3 mm point sources were detected around the phase centre of this source, and the source we called AzTEC26a has an optical-to-NIR counterpart ( from the 1.3 mm peak). The weaker, source AzTEC26b has no multiwavelength counterparts. The VLA 20 cm image detects some emission near both sources, but the S/N ratio of the radio detection is less than 2.
For AzTEC26a, we derived a photo- value of . Although the Subaru/-CFHT/ colour of this source, 1.06, is relatively blue, the radio/submm-based redshift of supports the aforementioned solution. The radio non-detection of AzTEC26b gives a lower redshift limit of .
AzTEC27. There is a hint of 20 cm emission associated with the elongated 1.3 mm source, although its 20 cm peak surface brightness is only 32.1 Jy beam-1 or about . No other wavelength counterparts are detected. At the projected distance of NE of the 1.3 mm peak position, there is the bright () galaxy COSMOS J100039.47+024055.5 (Capak et al. (2007)). The UltraVISTA catalogue gives a photo- of about 0.25 for this galaxy (ID 303584; Ilbert et al. (2013)). About SW of the 1.3 mm peak position, there is another galaxy, namely COSMOS J100039.07+024050.2 (Capak et al. (2007)), whose photometric redshift is about unity (source 303782 in the UltraVISTA catalogue; Ilbert et al. (2013)). As described in Appendix D, AzTEC27 appears to be subject to gravitational lensing by the foreground galaxies J100039.47 and J100039.07, and our lens model suggests that their combined lens effect amplifies the mm flux density by a factor of . At the distance of north from AzTEC27, there is a Herschel/HerMES 250 m source (ID 1500; Oliver et al. (2012)). Based on its radio dimness, we derived a redshift of for AzTEC27, which makes this source potentially the highest-redshift SMG among AzTEC16–30.
AzTEC28. This clearly detected 1.3 mm source, SE of the phase centre, has no counterparts at other wavelengths shown in Fig. 7. Casey et al. (2013) detected AzTEC28 with SCUBA-2 (their source SMMJ100004.5+023042 or 450.20), with the 450 m peak lying about NW of the PdBI peak position. The deboosted flux density at 450 m was reported to be mJy. The optical counterpart (at ) reported by Casey et al. (2013) lies north of the PdBI 1.3 mm peak, hence is unrelated to the SMG. We also note that the ASTE-detected source AzTEC/C150 from Aretxaga et al. (2011) lies NE of our PdBI 1.3 mm source – still within the beam of ASTE/AzTEC at 1.1 mm. About NE of AzTEC28, there is the Herschel 250 m source 4388 from the HerMES survey (Oliver et al. (2012)).
AzTEC29. There are no clear signatures of PdBI 1.3 mm emission inside the PB. The source candidate AzTEC29a () lies at the border of the PB and the strong source AzTEC29b () at the northern edge of the map, is outside the PB. The latter could be associated ( offset) with the source 1685295 from the COSMOS+UltraVISTA catalogue. Two negative sources of and were detected in the field outside the PB FWHM. Hence, AzTEC29a, which does not show up at other wavelengths, could be spurious. The VLA 20 cm image of the source region detects emission in its south-western corner (peak surface brightness of 50.5 Jy beam-1 or ). The Spitzer/MIPS 24 m emission near the field centre can be associated with the galaxy COSMOS J100026.79+023749.4 (Capak et al. (2007)) or 289240 in the UltraVISTA catalogue (; Ilbert et al. (2013)).
For AzTEC29a, we derived a radio/submm-based redshift of . The photo- of derived for AzTEC29b (Subaru/-CFHT/) is much lower than the unrealistically high value derived from the radio/submm flux-density ratio, hence the photo- value is adopted.
AzTEC30. A candidate point source with no counterparts is detected in this field. There is a Spitzer/MIPS 24 m source in the NW part of the field, SE of our tentative source, that is also visible at the IRAC wavelengths but has no catalogue identification. The radio non-detection of AzTEC30 gives a redshift of .
Finally, we note that none of our sources are detected in X-rays, implying that none host a prominent AGN. Cross-correlation with the Chandra-COSMOS Bright Source Catalogue v2.1 and COSMOS XMM Point-like Source Catalogue v2.0 revealed that the nearest X-source to any of our SMGs is XMMU J100002.8+024635, lying south of the PdBI phase centre towards AzTEC21. However, it is possible that some of the studied SMGs host an extremely Compton-thick AGN (i.e. with obscuration due to high column densities of dust) that remains undetected in the existing X-ray images.
Appendix D Gravitational lens modelling of AzTEC27
There are two foreground galaxies seen in projection close to the SMG AzTEC27 (see Fig. 8). The north-eastern galaxy, at from the 1.3 mm peak position of AzTEC27, is COSMOS J100039.47+024055.5. The photometric redshift and stellar mass of J100039.47 are and (Ilbert et al. (2013)). On the south-western side, at from AzTEC27, the foreground galaxy is COSMOS J100039.07+024050.2 at with a stellar mass of . AzTEC27 is potentially subject to gravitational lensing by these two intervening galaxies, and therefore to better understand its intrinsic physical properties requires a lens model.
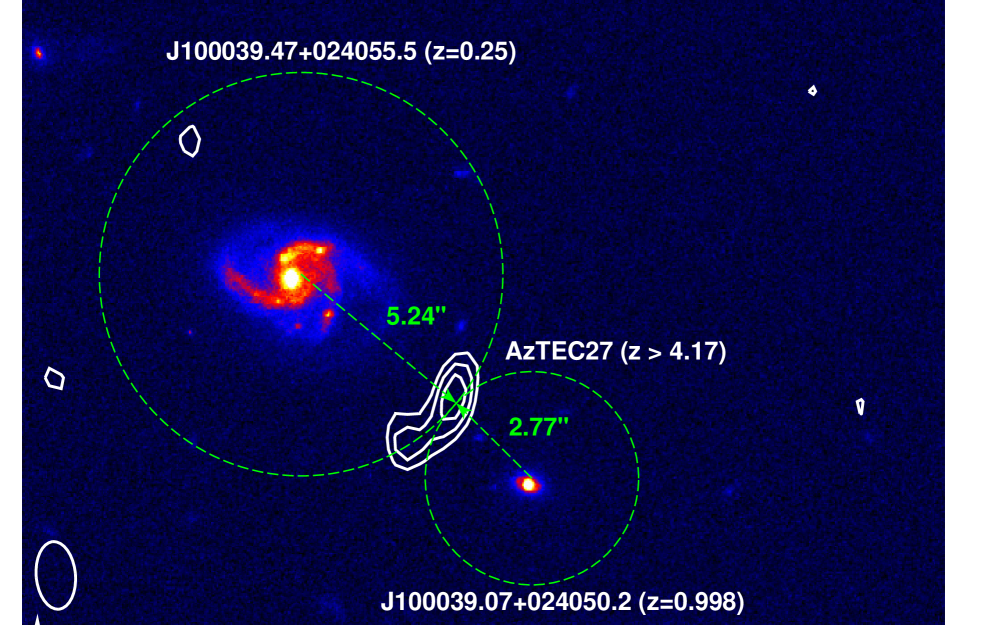
To estimate the strength of the lensing effect for AzTEC27, we carried out a gravitational lens modelling using the publicly available Python software called uvmcmcfit141414https://github.com/sbussmann/uvmcmcfit that will be described in detail by R. S. Bussmann et al. (in prep.). The code is a modified version of the one used in the papers by Bussmann et al. (2012, 2013) and uses the visibilities to determine the goodness of fit. To sample the posterior probability density function of our model parameters, we used the MCMC sampling code emcee (Foreman-Mackey et al. (2013)).
The lensed background source in the model is assumed to be an elliptical Gaussian source, described by the following parameters: the total intrinsic (unlensed) flux density (), the effective radius (, where and are the semi-major and semi-minor axes), the projected angular offset from the model image centroid, the axial ratio (), and the position angle (P.A. measured E of N). The lens is assumed to be a singular isothermal ellipsoid (SIE), parameterised by the angular Einstein radius (), the angular offset from the model image centroid, the axial ratio, and the P.A. The magnification factor is then computed as , where is the source’s total lensed flux density in the best-fit model.
The modelling was performed assuming three different scenarios: i) J100039.07 at is acting as a lens; ii) J100039.47 at is responsible for lensing; and iii) both the above intervening galaxies act as lenses. The magnification factor in these three cases was found to be , , and , respectively. Both the galaxies J100039.07 and J100039.47 are therefore causing only a weak lensing effect, the former one, having a times higher stellar mass and lying at a higher redshift (i.e. closer to AzTEC27) than the latter, being the slightly more stronger lens. The weak lensing is consistent with the fact that we see only a single image of AzTEC27 in the PdBI 1.3 mm map. In the present paper we assume the two-lens system and adopt the value for AzTEC27.
Appendix E The DEIMOS spectrograph slit parameters
In Table 5 we list the central coordinates, sizes (length and width), and position angles of the slits used for the Keck/DEIMOS spectral line observations towards AzTEC2, 5, 6, 9, 10, 13, and 17a. The DEIMOS slits are also illustrated in Fig. 9 where we show the UltraVISTA -band NIR images towards the above sources.
| Source | Length | Width | P.A. | Offseta𝑎aa𝑎aAngular offset between the SMG position and the slit centre (cf. Fig. 9). | ||
|---|---|---|---|---|---|---|
| [h:m:s] | [::] | [] | [] | [] | [] | |
| AzTEC2 | 10 00 07.98 | +02 26 12.2 | 7.7 | 1.0 | 90 | 0.98 |
| AzTEC5 | 10 00 19.69 | +02 32 04.4 | 8.0 | 1.0 | 90 | 0.90 |
| AzTEC6 | 10 00 06.54 | +02 38 37.6 | 7.2 | 1.0 | 90 | 0.61 |
| AzTEC9 | 09 59 57.28 | +02 27 30.6 | 8.7 | 1.0 | 90 | 0.45 |
| AzTEC10 | 09 59 30.88 | +02 40 33.9 | 10.5 | 1.0 | 90 | 1.80 |
| AzTEC13 | 09 59 37.01 | +02 33 20.0 | 10.1 | 1.0 | 90 | 0.60 |
| AzTEC17a | 09 59 39.30 | +02 34 03.7 | 9.4 | 1.0 | 90 | 1.60 |