Magnetic fields in the nearby spiral galaxy IC 342:
A multi-frequency radio polarization study
††thanks: Based on observations with the VLA of the NRAO at Socorro and the
100-m telescope of the Max-Planck-Institut für Radioastronomie at Effelsberg.
Abstract
Context. Magnetic fields play an important role in the formation and stabilization of spiral structures in galaxies, but the interaction between interstellar gas and magnetic fields has not yet been understood. In particular, the phenomenon of “magnetic arms” located between material arms is a mystery.
Aims. The strength and structure of interstellar magnetic fields and their relation to spiral arms in gas and dust are investigated in the nearby and almost face-on spiral galaxy IC 342.
Methods. The total and polarized radio continuum emission of IC 342 was observed with high spatial resolution in four wavelength bands with the Effelsberg and VLA telescopes. At the data from both telescopes were combined. I separated thermal and nonthermal (synchrotron) emission components with the help of the spectral index distribution and derived maps of the magnetic field strength, degree of magnetic field order, magnetic pitch angle, Faraday rotation measure, and Faraday depolarization.
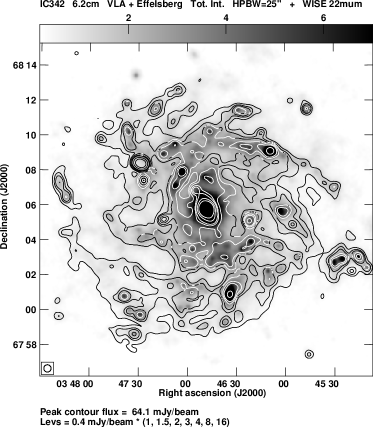
Results. IC 342 hosts a diffuse radio disk with an intensity that decreases exponentially with increasing radius. The frequency dependence of the scalelength of synchrotron emission indicates energy-dependent propagation of the cosmic-ray electrons, probably via the streaming instability. The equipartition strength of the total field in the main spiral arms is typically , that of the ordered field about . The total radio emission, observed with the VLA’s high resolution, closely follows the dust emission in the infrared at 8 m (SPITZER telescope) and 22 m (WISE telescope). The polarized emission is not diffuse, but concentrated in spiral arms of various types: (1) a narrow arm of about 300 pc width, displaced inwards with respect to the eastern arm by about 200 pc, indicating magnetic fields compressed by a density wave; (2) a broad arm of 300–500 pc width around the northern arm with systematic variations in polarized emission, polarization angles, and Faraday rotation measures on a scale of about 2 kpc, indicative of a helically twisted flux tube generated by the Parker instability; (3) a rudimentary magnetic arm in an interarm region in the north-west; (4) several broad spiral arms in the outer galaxy, related to spiral arms in the total neutral gas; (5) short features in the outer south-western galaxy, probably distorted by tidal interaction. Faraday rotation of the polarization angles reveals an underlying regular field of only strength with a large-scale axisymmetric spiral pattern, probably a signature of a mean-field dynamo, and an about stronger field that fluctuates on scales of a few 100 pc. The magnetic field around the bar in the central region of IC 342 resembles that of large barred galaxies; it has a regular spiral pattern with a large pitch angle, is directed outwards, and is opposite to the large-scale regular field in the disk. Polarized emission at is strongly affected by Faraday depolarization in the western and northern parts of the galaxy. Helical fields extending from disk to halo may account for this asymmetry.
Conclusions. Interstellar magnetic fields interact with the gas and gas flows. Density-wave compression generates polarized radio emission at the inner edge of some spiral arms. Fast MHD density waves can generate coincident spiral arms in gas and magnetic fields in the outer parts of IC 342. Magnetic armsar e offset from the spiral pattern in gas and dust; their generation and development by mean-field dynamo action probably need a spiral pattern that is stable over a few galactic rotation periods, which is probably the case for the galaxy NGC 6946. The mean-field dynamo in IC 342 is slow and weak, probably disturbed by the bar, tidal interaction, or a transient spiral pattern.
Key Words.:
Galaxies: spiral – galaxies: magnetic fields – galaxies: ISM – galaxies: individual: IC 342 – radio continuum: galaxies – radio continuum: ISM1 Introduction
The role of magnetic fields in the interstellar medium (ISM) of galaxies is far from being understood. Radio polarization observations have revealed magnetic fields of considerable strength in all galaxies containing a significant level of star formation (Beck & Wielebinski 2013; Beck 2015b). The magnetic energy density, measured with the help of radio continuum emission, was found to be comparable to that of turbulent gas motions and cosmic rays (Beck 2007; Tabatabaei et al. 2008). However, the processes cannot be identified in detail by observations with the resolution of current radio telescopes.
Numerical simulations of density-wave perturbations of the ISM in galaxies, including magnetic fields, are scarce and inconclusive so far. According to Gómez & Cox (2002, 2004) a moderately strong magnetic field modifies the gas response to a spiral density perturbation, causing radial and vertical gas flows outwards and upwards in front of the spiral arm, and inwards and downwards behind the arm. The magnetic field is carried along with the flow, and the magnetic pitch angle changes sign when moving across the spiral arm. Dobbs & Price (2008) find that gaseous spiral arms are smoother and better defined when strong magnetic fields are included, because instabilities are suppressed and that the magnetic field follows the gaseous spiral arm. In the MHD simulation of an evolving galaxy (Pakmor & Springel 2013), spiral arms develop dynamically in gas and magnetic fields. All simulations so far agree that the magnetic field is mostly ordered in the regions of the highest gas density in the spiral arms, while radio polarization observations show that the strongest ordered fields are located mostly between the spiral arms.
IC 342 is an ideal object for investigating magnetic fields and their relation to gas and dust with high spatial resolution. It is an outstanding late-type spiral galaxy because of its large angular size (30′ in optical light and in the infrared, more than 90′ in the line of atomic neutral gas) and its favourably low inclination. Beyond M 31 and M 33, IC 342 is the nearest spiral galaxy.111Assuming a distance of Mpc (Saha et al. 2002; Karachentsev et al. 2003; Tikhonov & Galazutdinova 2010), 1′ corresponds to kpc and the optical radius to 11 kpc. Optical observations of IC 342 are hampered by the location behind the Galactic disk () and hence high extinction along the line of sight. A moderately high overall star-formation rate is inferred from the far–infrared luminosity of L⊙ (Young et al. 1996), scaled to the distance of 3.5 Mpc assumed in this paper.
According to kinematic data, the galaxy plane is inclined by 31∘ to the plane of the sky and has a position angle of 37∘ (Crosthwaite et al. 2000). The spiral structure is multi-armed and partly broken into segments in the optical range (White & Bothun 2003), in the infrared (Jarrett et al. 2013), in molecular gas (Crosthwaite et al. 2001) and in neutral hydrogen () gas (Newton 1980b; Crosthwaite et al. 2000). Assuming trailing spiral arms, the north-western side of IC 342 is nearest to us, and the galaxy is rotating counter-clockwise. The spiral pattern is two-armed in the inner disk and four-armed in the outer disk, possibly with two different pattern speeds (Meidt et al. 2009). Velocity residuals indicate a large-scale bipolar pattern, which indicates a bar potential, so that IC 342 may be in the transition phase from a barred to a two-armed spiral galaxy (Crosthwaite et al. 2000). The lack of velocity perturbations km/s indicates that density waves are weak (Newton 1980b).
The first radio continuum study of IC 342 by Baker et al. (1977) revealed a diffuse disk with a steep spectrum of synchrotron origin and emission ridges mostly following the optical arms. The average intensity of the radio disk is much higher than that of the nearest spiral galaxy, M 31, though not as high as that of NGC 6946. The high star-formation rate per surface area of about 0.016 M⊙ yr-1 kpc-2 (Calzetti et al. 2010) also yields a high surface brightness of the disk of IC 342 in the infrared bands (Jarrett et al. 2013). IC 342 was one of the first four galaxies for which a tight correlation between radio and infrared intensities within the disks was found (Beck & Golla 1988), indicating that the energy densities of cosmic rays and magnetic fields are related to star-forming activity (Niklas & Beck 1997).
| VLA | Effelsberg | |
| Frequency (GHz) | 8.435 & 8.485 | 10.55 |
| Wavelength (cm) | 3.55 & 3.53 | 2.84 |
| Bandwidth (MHz) | 100 | 500 |
| Array configuration | D | – |
| Pointings | 3 | – |
| Observing dates | 1991 Mar 23, 2003 Feb 24 | 1994 June – Oct |
| Project IDs | AB591, AB953 | 122-93 |
| On-source observing time (h) | 13 | 79 |
| Resolution of final maps | 12″ & 15″ | 68″ & 90″ |
| Rms noise in ; and () | 10; 5 & 13; 7 | 650; 250 & 500; 150 |
| Frequency (GHz) | 4.835 & 4.885 | 4.85 |
| Wavelength (cm) | 6.20 & 6.14 | 6.18 |
| Bandwidth (MHz) | 100 | 500 |
| Array configuration | D | – |
| Pointings | 5 | – |
| Observing dates | 1988 Sep 23 + 2003 Feb 28 + 2007 May 20 | 2000 Apr – Aug |
| Project ID | AK201, AB1066, AB1228 | 18-00 |
| On-source observing time (h) | 24 | 29 |
| Resolution of final maps | 15″ (NW pointing) & 25″ | 147″ & 180″ |
| Rms noise in ; and () | 20; 10 & 20; 12 | 600; 80 & 500; 70 |
| Reference | Krause (1993) (NW pointing) | |
| Frequency (GHz) | 2.675 | |
| Wavelength (cm) | 11.2 | |
| Bandwidth (MHz) | 80 | |
| Observing dates | 2000 Apr to Aug | |
| Project ID | 19-00 | |
| On-source observing time (h) | 24 | |
| Resolution of final maps | 260″ & 300″ | |
| Rms noise in ; and () | 1000; 650 & 800; 450 | |
| Frequency (GHz) | 1.490 | 1.400 |
| Wavelength (cm) | 20.1 | 21.4 |
| Bandwidth (MHz) | 100 | 40 |
| Array configuration | D + C | – |
| Pointings | 3 | – |
| Observing date | 1984 Jul 29 & 1986 Dec 20 + 1987 Mar 16 | 2000 Nov – Dec |
| Project ID | AK107, AH248 | 19-00 |
| Net observing time (h) | 16 | 7 |
| Resolution of final maps | 15″ & 25″ & 51″ | 560″ & 600″ |
| Rms noise in ; and () | 30; 20 & 45; 25 & 100; 40 | 2500; 2000 & 2000; 1500 |
| Reference | Krause et al. (1989) (D array, central pointing) |
Linearly polarized emission from IC 342 was first detected with the VLA at by Krause (1987) and with the Effelsberg telescope at and by Gräve & Beck (1988), who found an ordered magnetic field with a smooth spiral pattern. According to the detection of a large-scale pattern of Faraday rotation measures between and and between and (Krause 1987; Gräve & Beck 1988; Krause et al. 1989; Sokoloff et al. 1992); some part of the ordered field is regular 222The orientation of polarization “vectors” is ambiguous by multiples of 180∘. As a consequence, “ordered” magnetic fields as traced by linearly polarized emission can be either “regular” (“large-scale”) fields, preserving their direction over large scales, “anisotropic turbulent”, or “anisotropic tangled” fields with multiple field reversals within the telescope beam. To distinguish between these fundamentally different types of magnetic field observationally, additional Faraday rotation data is needed. on spatial scales larger than a few kpc. These azimuthal variation of rotation measures signified for the first time that the large-scale field pattern in a spiral galaxy can be described by an “axisymmetric spiral” (ASS), probably generated by a mean-field dynamo 333A mean-field dynamo can also be excited by the effect, which is weaker in galactic disks than the effect (Elstner et al. 1992). In the following, “mean-field dynamo” means “mean-field dynamo”.. The variation in rotation measures between and has a lower amplitude than between and , indicating significant Faraday depolarization at (Krause et al. 1989; Sokoloff et al. 1992).
Until today, IC 342, NGC 6946 (Ehle & Beck 1993) and M 31 (Fletcher et al. 2004) are candidates of an ASS-type field pattern, whereas many other spiral galaxies show more complicated field structures (Fletcher 2010; Beck & Wielebinski 2013). The ASS field is the basic mode predominantly excited by the mean-field galactic dynamo (Ruzmaikin et al. 1988; Beck et al. 1996), but it takes several billion years before full coherence is reached (Arshakian et al. 2009). Fields of opposite polarity need to merge (see e.g. the simulations by Hanasz et al. (2009) and Moss et al. (2012). A major distortion by the passage of companion galaxy may delay or interrupt the field evolution (Moss et al. 2014). IC 342 lacks a companion, so that the mean-field dynamo can operate without major disturbances. Still, the previous results on IC 342 were based on low-resolution observations and affected by Faraday and beam depolarization. The detection of higher dynamo modes and field patterns that are generated by other processes, such as non-axisymmetric gas flows or instabilities, needs higher resolution.
The observations by Krause et al. (1989) revealed at least two long, polarized spiral arms in the outer south-eastern and eastern regions of IC 342. These features have smaller pitch angles than the spiral arms delineated by Newton (1980b) and seem to cross them. This behaviour is different from the “magnetic arms” in NGC 6946 that are located between the gaseous arms and aligned parallel to the arms (Beck & Hoernes 1996; Beck 2007). The western and north-western regions showed very little polarized emission at owing to strong Faraday depolarization. At , where depolarization is lower, Krause (1993) discovered three narrow filaments in the inner galaxy, one of them located between gaseous arms, resembling the magnetic arms of NGC 6946 (Beck 2007).
Studying the phenomenon of magnetic arms in many galaxies may help to develop and constrain future models of the evolution of the magnetic ISM in galaxies. The nearest spiral galaxy M 31 is not suited owing to its high inclination. M 33 has ill-defined material arms and only a radio-weak magnetic arm in the northern region (Tabatabaei et al. 2008). IC 342 is a nearby, radio-bright, almost face-on galaxy, and it allows observations with high spatial resolution.
This paper presents observations from the VLA and Effelsberg radio telescopes in four wavelength bands with higher resolution and higher sensitivity than with the previous data. The highest resolution of 12″ corresponds to a spatial resolution of about 200 pc at the assumed distance of 3.5 Mpc. Similar spatial resolutions in radio continuum have been achieved at in M 31 (Beck et al. 1998) and in M 33 (Tabatabaei et al. 2007b), but magnetic field investigations were hampered by Faraday depolarization that is strong in that wavelength band.
The radio maps in total and polarized intensity are presented in Section 3.1, maps of spectral index, thermal and nonthermal emission in Sect. 3.2, polarized emission in Sect. 3.4, magnetic field strength in Sect. 3.5, Faraday rotation measures in Sect. 3.9, and Faraday depolarization in Sect. 3.10. Polarized background sources are discussed in Sect. 3.11 and the unusual central region in Sect. 3.12. The propagation of cosmic-ray electrons (CREs) is discussed in Sect. 4.1, energy densities in Sect. 4.2, the extent of magnetic fields in Sect. 4.3, dynamo action in Sect. 4.4, the detection of a large-scale helical field in Sect. 4.6, and the origin of magnetic arms in Sect. 4.7.
2 Observations and data reduction
The main parameters of the radio continuum observations with the Very Large Array (VLA), operated by the NRAO 444The NRAO is a facility of the National Science Foundation operated under cooperative agreement by Associated Universities, Inc., and the Effelsberg telescope 555The Effelsberg 100-m telescope is operated by the Max-Planck-Institut für Radioastronomie in Bonn on behalf of the Max-Planck-Gesellschaft (MPG). are given in Table LABEL:tab:obs. Data was processed with the standard routines of the software packages AIPS and NOD2, respectively.
The final Effelsberg map at is a combination of 45 coverages scanned in azimuthal direction with the four-horn secondary-focus system, using software beam-switching (Emerson et al. 1979). The average baselevels were subtracted by fitting linear baselines. All coverages were transformed into the RA, DEC coordinate system. The final Effelsberg map at is a combination of 20 coverages scanned in azimuthal direction with the two-horn secondary-focus system, using software beam-switching, baselevel subtraction, and transformation into the RA, DEC coordinate system. The final Effelsberg maps at and were obtained from 21 and 7 coverages, respectively, scanned alternating in RA and DEC with the one-horn secondary-focus systems and combined using the spatial-frequency weighting method by Emerson & Gräve (1988). The radio sources 3C138 and 3C286 were used for the calibration of flux density and polarization angle. During the VLA observations, the secondary calibrator 0410+769 was observed once every 20–30 minutes and used for calibrating telescope gains and phases and for correcting instrumental polarization.
The accuracy of polarization angle calibration is better than 1∘ for both telescopes. The level of instrumental polarization of the VLA is less than 1% at the centre of the primary beam, but increases to a few percentage points at the half-power radius (Condon et al. 1998). Because the observations presented here were obtained from data observed over a wide range of parallactic angles, the instrumental polarization is smoothed out. The instrumental polarization of the Effelsberg telescope emerges from the polarized sidelobes with 0.3–0.5% of the peak total intensity at the frequencies of the observations presented in this paper.
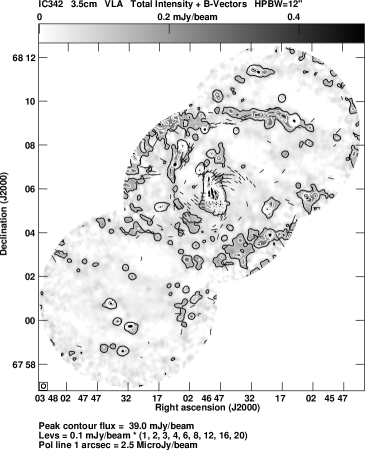
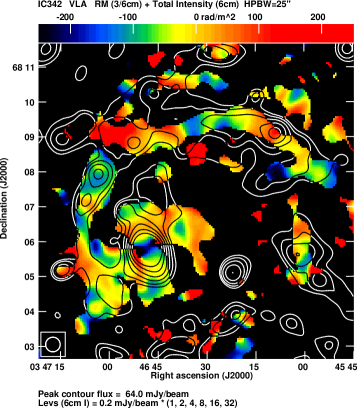
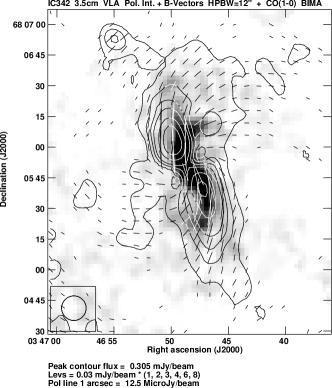
At the VLA D array maps in Stokes , and from three pointings with centres separated by 5′ were combined in the image plane and corrected for primary beam attenuation. Using natural weighting (Brigg’s robust=5) of the data, we obtained maps with an angular resolution of 12″ (about 200 pc) that were further smoothed to 15″ (about 250 pc) in order to increase the signal-to-noise ratio (Fig. 1). Merging with the Effelsberg data at was not possible because the region covered by the VLA observations is much smaller than the Effelsberg map.
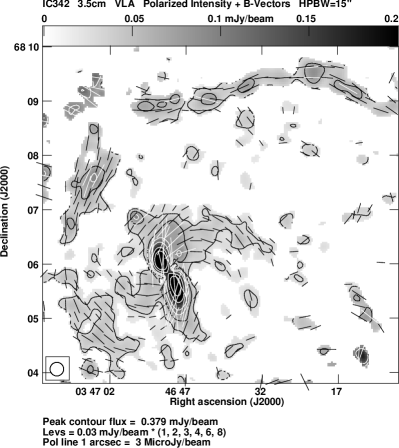
At four different pointings were observed with the VLA D array, centred on the south-east, south-west, north-east, and far north-west of the centre and separated by about 8′. Two pointings in the north-west and south-east were already observed by Krause (1993). The data from the north-western pointing were included in this work, while the south-eastern field was re-observed to improve the signal-to-noise ratio. Robust weighting (Brigg’s robust=0) of the data was applied only to the north-western pointing (with the strongest intensity), which gave an angular resolution of about 14″; the resulting maps were smoothed to a resolution of 15″. Natural weighting of the data from the five pointings gave maps with angular resolutions between 19″ and 23″, which were smoothed to a common resolution of 25″. The VLA maps in Stokes , and from all pointings were corrected for primary beam attenuation and combined in the image plane.
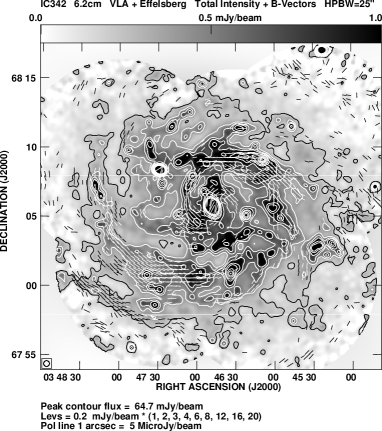
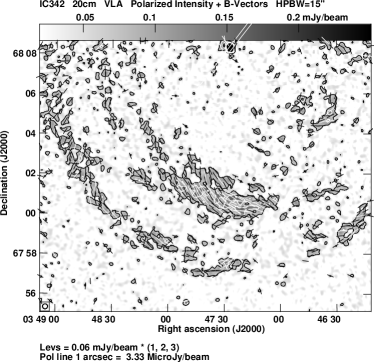
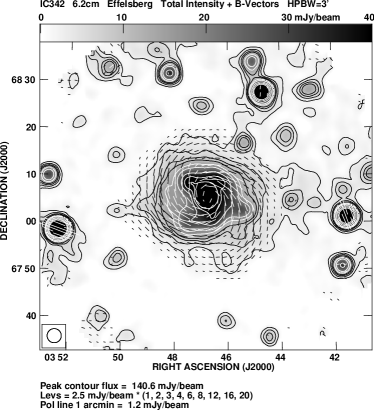
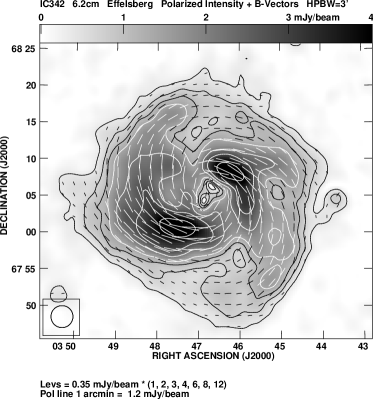
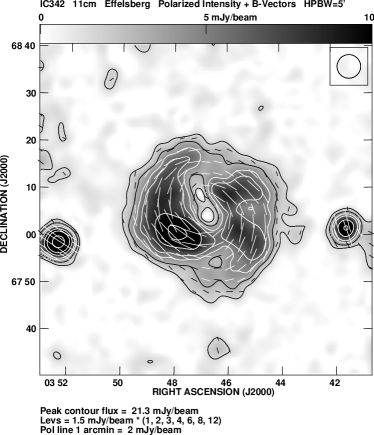
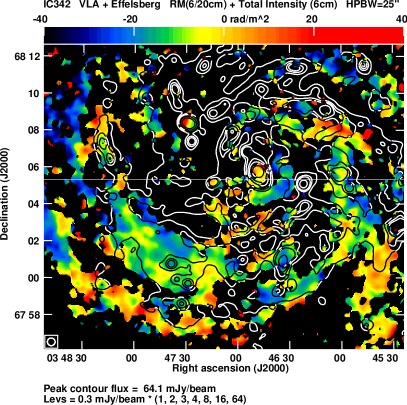
The Effelsberg maps at and (Fig. 6 and 7) reached rms noise levels that are several times lower than for the previous maps by Gräve & Beck (1988). At the maps in Stokes , and from both telescopes were combined (Fig. 2) with an overlap in the data for antenna baselines of 300–400. At this wavelength the minimum baseline of the VLA is about 300, while the maximum baseline of the Effelsberg telescope is about 1600. The VLA map alone contains about 38% of the total flux density and 75% of the polarized flux density within 7′ radius.
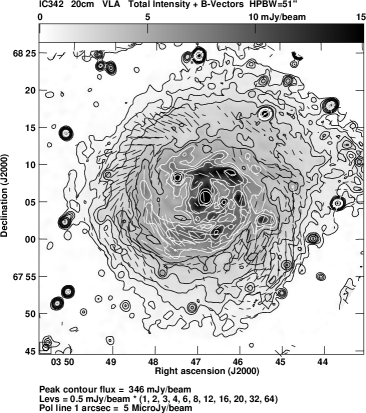
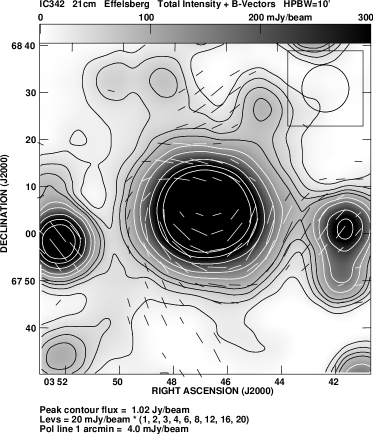
At the previous VLA D array data from Krause et al. (1989) centred on the nucleus (at RA, DEC (J2000) = , +68∘ 05′ 47″) were combined with the C array data in the plane. Maps were generated at 15″ resolution (uniform weighting) and corrected for primary beam attenuation (Fig. 3). Effelsberg data were observed at a similar wavelength (Fig. 8). Integration of the Effelsberg map gave a lower total flux density than for the VLA map, indicating that some extended emission is missing in the Effelsberg map owing to the baselevel subtraction. There is no indication of any missing large-scale emission in the VLA maps, so that no combination was performed.
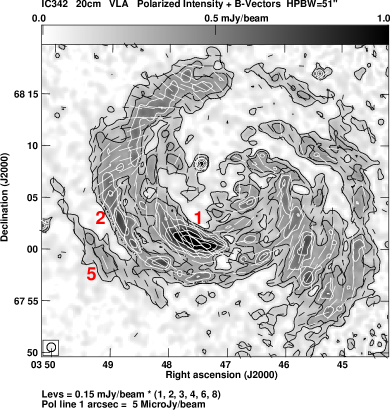
To search for emission in the outer disk east of IC 342, another pointing aimed at RA, DEC (J2000) = , +68∘ 05′ 48″ was observed at with the VLA D array and combined with the central pointing, to obtain maps with 51″ resolution (Fig. 4). The maps in Stokes and at each wavelength and at each resolution were combined with maps of linearly polarized intensity including the correction for positive bias due to noise. In the maps the noise distribution is non-Gaussian, and computing a Gaussian standard deviation would underestimate the noise. As a result, only the rms noise values for the maps in Stokes , and are given in Table LABEL:tab:obs.
3 Results
3.1 Total intensity
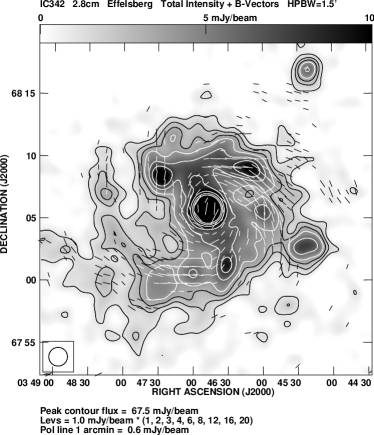
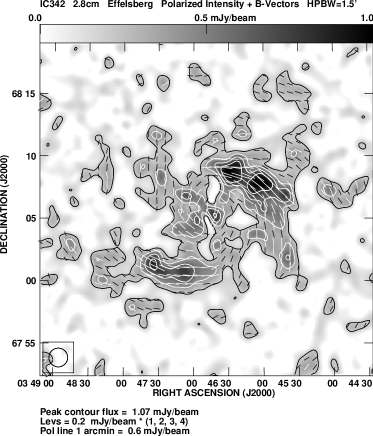
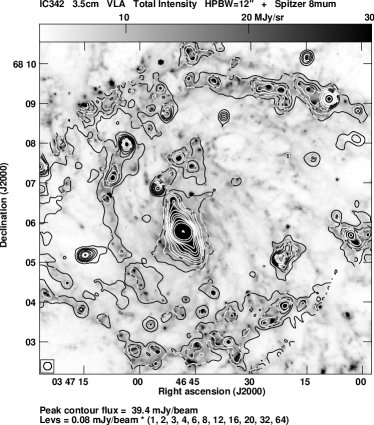
Figures 1–8 show the maps of total (left panels) and polarized (right panels) radio intensities. Figure 1 is based on VLA data alone, Fig. 2 on combined VLA+Effelsberg data, and Figs. 5–8 on Effelsberg data alone.
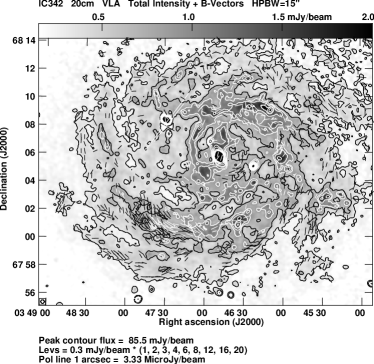
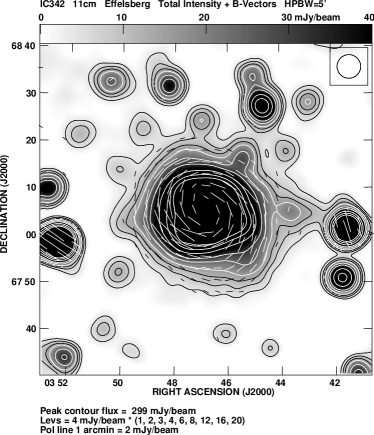
The total intensity in the maps at is strongest in the nuclear bar and in the inner eastern and northern spiral arms, the regions that are also brightest in the optical and infrared spectral ranges. The northern – north-western arm, centred on RA, DEC (J2000) = , +68∘ 09′ 20″, is the most pronounced and the narrowest one, with a width of only pc measured at (Fig. 1 left and Fig. 9 right), corrected for beam smearing. The narrow inner arm just east of the central region, centred on RA, DEC (J2000) = , +68∘ 06′ 40″, has a similar width of pc measured at . The main southern – south-eastern spiral arm, centred on RA, DEC (J2000) = , +68∘ 01′ 30″ (Figs. 2 left and 3 left, named no. 1 in Fig. 2 right) is much broader, with a width of kpc measured at , but may consist of several arms. Another broad but faint spiral arm is visible in the far south – south-east (Figs. 2 left and 3 left; no. 2 in Fig. 2 right). Only the peaks of these broad southern arms are visible at (Fig. 1 left), delineating the major star-forming regions (Fig. 9 right). The two outer arms are also visible (though unresolved) in the Effelsberg map at (Fig. 5).
3.2 Thermal and nonthermal emission
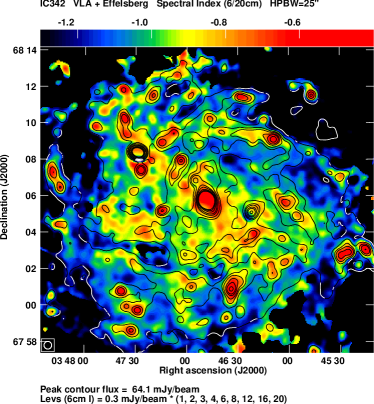
The maps of total intensities at and at 25″ resolution are used to determine the radio spectral index , defined as (Fig. 10). The spectrum is generally flatter (i.e. a lower absolute value of ) in the spiral arms than outside the arms, indicating a greater fraction of thermal emission in the arms and/or a flatter spectrum of the nonthermal (synchrotron) emission.
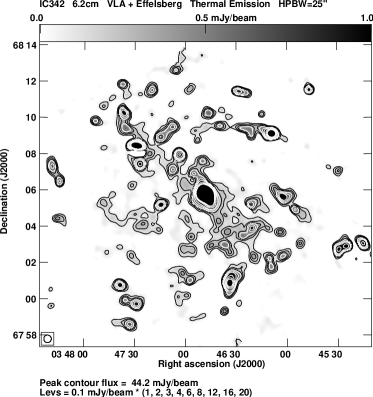
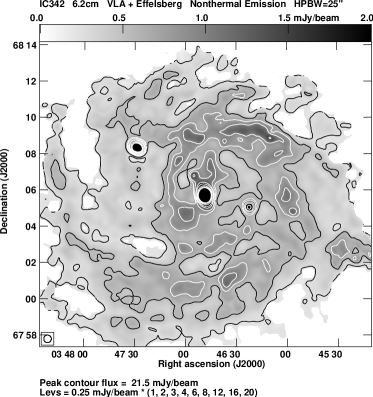
The thermal and nonthermal components are separated in the “classical” way by assuming a constant spectral index of for the thermal and for the diffuse nonthermal emission, taken from the average spectral index of the interarm regions, resulting in the maps shown in Fig. 11. The typical thermal fraction at is about 50% in the central region, 20% to 30% in the spiral arms and 10% or less in the interarm regions.
The separation method based on the spectral index means that all spectral variations are interpreted as variations in the thermal fraction, while it is known that the synchrotron spectrum depends on the age of cosmic-ray electrons (CREs) propagating from the spiral arms, so is expected to be flatter in the spiral arms than in the interarm regions. As a result, the thermal fraction is overestimated in the spiral arms.
The H map by Hernandez et al. (2005) is similar to the map of thermal intensity (Fig. 11 left), but it shows more extended diffuse emission than the radio map. Spectral steepening due to energy losses of cosmic-ray electrons in the interarm regions leads to a synchrotron spectrum that can be steeper than the assumed slope of , so that the thermal fraction is underestimated in such regions.
For the purpose of the present study that determines magnetic field strengths (Sect. 3.5), the classical approach to separate thermal and nonthermal components is sufficient. The advanced method introduced by Tabatabaei et al. (2007a), which was first applied to the galaxy M 33, uses an extinction-corrected H map as a template for thermal emission and will be applied to IC 342 in a future paper. Low-frequency observation obtained with the LOFAR Highband Array (115–175 MHz) will reveal an almost purely synchrotron map of IC 342 and allow an improved investigation of the variation in synchrotron spectral index, as recently performed for M 51 (Mulcahy et al. 2014).
3.3 Radial distributions of radio intensity
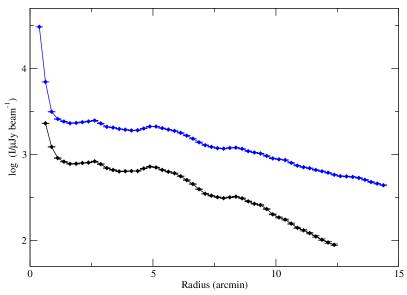
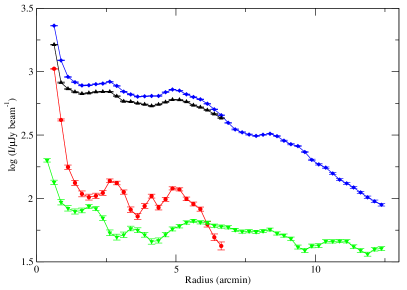
The radial distributions of total radio intensity at and (Fig. 12 left) reveal breaks beyond about a 5′ radius, similar to the break radius of the distribution of thermal intensity (Fig. 12 right) at about 6′ radius and that of total neutral gas at about 7′ radius (Crosthwaite et al. 2001), where the star-formation rate drops to a lower level. Inside of the break radius, in the inner disk, the distributions of total radio intensities are flat, with two maxima related to the main spiral arms, and can be described as smoothed versions of the distribution of thermal intensity (Fig. 12 right). Breaks in the radial distributions of total radio intensity around the break radius of the star-formation rate were also found in M 33 (Tabatabaei et al. 2007b) and in M 51 (Mulcahy et al. 2014).
| (cm) | Total (inner) | Total (outer) | Synchrotron (inner) | Synchrotron (outer) | Polarized synchrotron (outer) |
|---|---|---|---|---|---|
| 6.2 | |||||
| 20.1 |
The smooth radial distributions of total and nonthermal intensities can be described by exponential functions (Fig. 12), while the thermal and polarized intensities fluctuate strongly in the inner disk (1′– 6′ radius). The exponential scalelengths are given in Table LABEL:tab:length. As a result of the method that separates thermal from nonthermal emission (Sect. 3.2), the nonthermal intensities at and have identical scalelengths and only differ in amplitude. In the outer disk (6′– 125 radius), the nonthermal and thermal intensities cannot be measured because the accuracy of the spectral index is not sufficient for a reliable separation. The scalelength of the nonthermal intensity in the outer disk can be assumed to be the same as for the total intensity because the thermal contribution is small in this region. The ratio of scalelengths between and in the outer disk is , which is probably the result of frequency-dependent propagation of CREs (Sect. 4.1).
Many spiral galaxies do not exhibit breaks in the radial distribution of total radio intensity, so that for a comparison, the average exponential scalelengths of IC 342 in the ring 1′– 125 of kpc at and at are used. These are larger than those in the disks of other spiral galaxies: e.g. kpc at for M 81 (Beck et al. 1985), kpc at (nonthermal) for NGC 6946 (Walsh et al. 2002) and 1–5 kpc at various wavelengths in several other spiral galaxies (Klein & Emerson 1981; Harnett 1987; Basu & Roy 2013). A large optical size cannot account for the large scalelengths in IC 342 because is similar for IC 342 (11 kpc), M 81 (12 kpc), and NGC 6946 (9 kpc). The radio continuum disk of IC 342 appears to extend farther beyond the optical disk than that of many other spiral galaxies.666A distance of 3.5 Mpc is assumed here, while a distance of 1.8 kpc as derived by McCall (1989) would give smaller scalelengths. However, recent papers converge to the distance of about 3.5 Mpc.
3.4 Linearly polarized intensity
The polarized emission in the three Effelsberg maps at the three shortest wavelengths (Figs. 5–7, right panels) emerges from a spiral configuration of the large-scale ordered field. Depolarization within the large Effelsberg beams causes the central holes. In the most sensitive maps at and , a diffuse disk of polarized emission extends to a radius of about 20′ at the level of five times the rms noise, so much further than in the previous maps by Gräve & Beck (1988). This extent is greater than seen in total emission (Figs. 6 and 7 left) because the rms noise values , composed of instrumental noise and the confusion noise from unresolved background sources, are lower in polarized emission than in total emission (Table LABEL:tab:obs). The detection limit of Jy per 180″ Effelsberg beam at corresponds to Jy per 25″ beam, so much lower than for the VLA image of Jy. Deep single-dish imaging in polarization allows us to detect weak ordered fields (see Sect. 3.5).
Since the polarized foreground of the Milky Way is smooth on the scales of the telescope beams, it was mostly removed by subtracting linear baselevels from the maps in Stokes and . Only the Effelsberg polarization map at (Fig. 8 right) is affected by foreground emission. At this wavelength, the variations in the foreground Faraday rotation measure lead to splitting of the emission in and into patches with spatial scales smaller than the map size, which are not removed by subtracting linear baselevels.
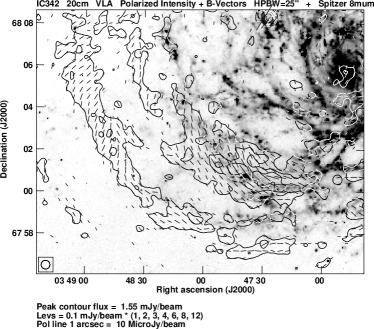
At the high resolution of the VLA maps, all four main spiral arms of IC 342 seen in total intensity, which is a signature of the total field (Sect. 3.1), are partly polarized, with different degrees of polarization (see below). The polarized emission, a signature of the ordered magnetic field in the sky plane, follows that of the total emission of the narrow northern and the two broad southern arms (Fig. 2), indicating that a fraction of the isotropic turbulent field is compressed or sheared and becomes anisotropic turbulent.
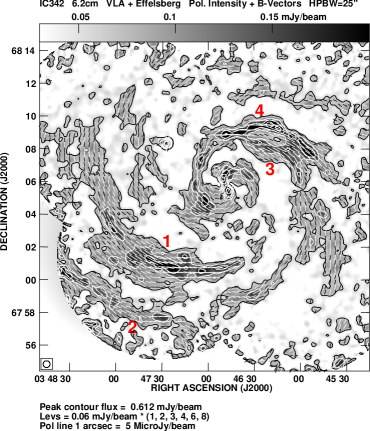
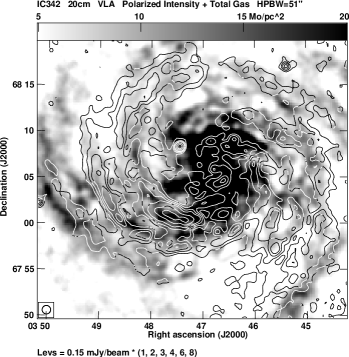
The dominant structures in the VLA polarization maps at and and in the combined VLA+Effelsberg map at (Figs. 1–4 right panels, Figs. 13 and 27) are the well-defined spiral arms. The longest one on the eastern side (no. 1 in Figs. 2 and 4, right panels) extends from the south (at about 5′ radius) to the far north (at about 12′ radius) over at least 30′ in length. Two other spiral arms with at least 20′ length are seen in the south-east at larger radii, running almost parallel to the inner one (nos. 2 and 5 in Fig. 4 right). All three polarization spiral arms are related to spiral structures in total neutral gas (Fig. 15), though partly displaced inwards (see Sect. 4.5).
Another prominent polarization arm seen at (Figs. 2 right and 13 left) is the inner spiral arm extending from the east (at about 2′ distance from the galaxy centre) to the north-west (between about 3′ and 7′ distance from the centre). Its brightest sections are also seen at (Fig. 1 right), but not at (Figs. 3 and 4 right) due to Faraday depolarization.
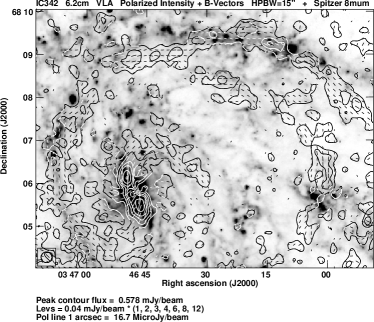
The narrow arm section located close (east – north-east) to the central region is different from all other arms: while clearly resolved in total intensity, it is not resolved in polarized emission at (Fig.2 right) and at even at the best available resolution of 12″, so that its intrinsic width (corrected for beam smearing) is smaller than 200 pc (at the assumed distance of 3.5 Mpc). Furthermore, the location of the ridge line of polarized emission at and is shifted inwards (towards the centre) with respect to that of the total radio and infrared emission (Fig. 13 left) by about 10″ (170 pc).777The location of a feature observed with a high signal-to-noise ratio can be measured with an accuracy of , where is the half-power with of the telescope beam. Here, is about 10 in polarization and even higher in total intensity, so that the measured shift is highly significant. Such a displacement is a probable signature of a density wave that first compresses the field and then induces star formation and turbulence. A similar displacement has also been detected in the density-wave spiral galaxy M 51 (Patrikeev et al. 2006).
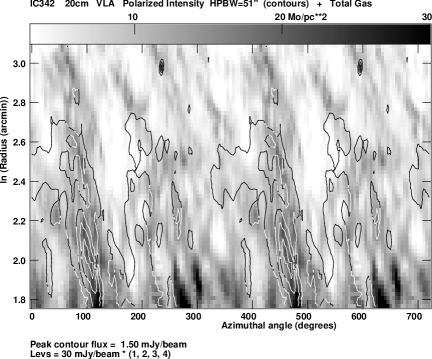
The northern section of the polarized spiral arm is split into two parts. The ridge line of its northern part (no. 4 in Fig. 2 right) oscillates around the infrared spiral arm inwards and outwards with shifts of up to about 500 pc (Fig. 13 left), which is indicative of a helical field (Sect. 4.6). It is also detected in polarization at (Fig. 1 right), but not at where Faraday depolarization is strong. Wavelength-dependent Faraday depolarization could originate in the dense magneto-ionic gas of the spiral arm (Krause 1993), enhanced by depolarization in the halo field on the north-eastern (receding) side of the major axis (see Sect. 3.10).
The southern part of the polarized northern filament (no. 3 in Fig. 2 right) is located in the interarm region around RA, DEC (J2000) , +68∘ 08′, resembling a magnetic arm, though its length of about 5 kpc is much less than that of the magnetic arms in NGC 6946 (see discussion in Sect. 4.7). It is also detected in the low-resolution map at (Fig. 4 right) because Faraday depolarization is smaller in interarm regions.
On the western – south-western side of the galaxy another three spiral filaments can be traced at (Fig. 4 right, without numbers), but they are shorter and less well defined than on the eastern side. The two inner ones are also visible at (Fig. 2 right). The outermost filament is located at the inner edge of a filament in total neutral gas (Fig. 15 left). Optical data suggest that the south-western region is affected by tidal interaction with the Local Group (Buta & McCall 1999), which may have disturbed the formation of long polarized filaments.
The degrees of polarization of the nonthermal emission at vary between about 15% in the inner southern and eastern arms and in the northern arm, about 20% in the northern magnetic arm and more than 30% in the outer southern and south-eastern arms, with a peak value of about 60% in the outermost arm (no. 2 in Fig. 2 right). The degrees of polarization at are similar. These results indicate that the magnetic field structure in the spiral arms of IC 342 is different from that in NGC 6946 (Beck 2007), where the typical degrees of polarization are lower in the spiral arms (between 5% and 10%) but higher in the magnetic arms (35% on average, up to 45% locally). In IC 342 the field is less turbulent in the spiral arms than in those of NGC 6946. The northern magnetic arm of IC 342 is shorter and its field is less ordered (more turbulent) than in that of NGC 6946 (see Sect. 4.7).
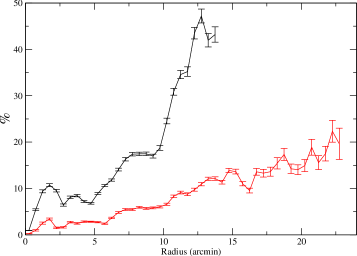
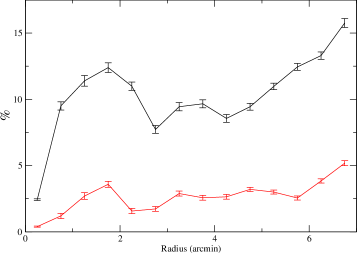
The degrees of polarization of the nonthermal emission at are low, about 3% in the eastern arm, 5% in the northern arm, and 10% in the outer south-eastern arms. The average degree of polarization in rings (Fig. 16) is also lower at than at , a sign of Faraday depolarization (Sect. 3.10). Here, increases with distance from the galaxy centre because towards the outer galaxy the degree of field order increases (Fig. 18) and Faraday depolarization decreases (Fig. 23).
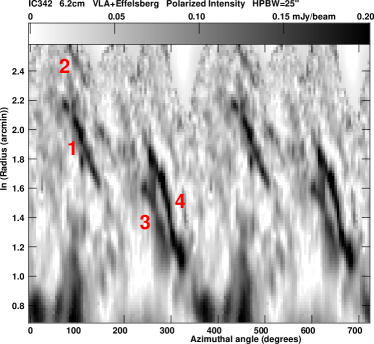
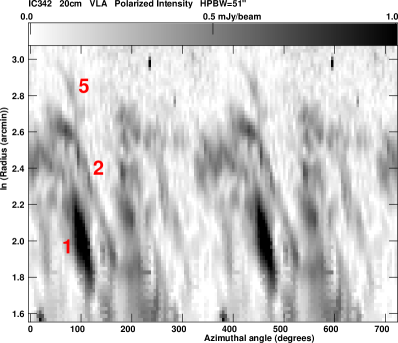
Spiral arms with constant pitch angles are linear structures in polar coordinates , , where is the radius and the azimuthal angle. Figure 14 shows the transforms of Figs. 2 (right) and 4 in polar coordinates. In Fig. 14 (left) the spiral arms nos. 3 and 4 form adjacent features, with pitch angles of -23 to -43∘ and -27∘ (Table LABEL:tab:pitch). The average degrees of polarization at (at 25″ resolution) are 14% in the eastern and northern arms and 18% in the magnetic arm. After subtracting the thermal emission from the total emission, the polarization degrees of synchrotron emission become similar (16% and 18%, respectively).
Several of the polarization spiral arms discussed above show little or no similarity to spiral arms of total intensity. There must therefore be mechanisms for generating ordered fields other than compression or shear, probably mean-field dynamo action. Another major difference is that the bright diffuse disk seen in total emission lacks polarized emission. This indicates that isotropic turbulent magnetic fields are responsible for the diffuse emission seen in total intensity, while the ordered field is mostly concentrated in spiral filaments. Because most of the polarized emission is already detected with the VLA alone, the diffuse disk of polarized emission seen in the Effelsberg maps at and consists of unresolved polarization spiral arms.
The properties of the different types of polarization arms are summarized and discussed in Sect. 4.5.
3.5 Magnetic field strengths
The strength of the total magnetic field and its ordered component on the sky plane is derived from both the total synchrotron intensity and its degree of linear polarization (Sect. 3.4), if equipartition between the energy densities of total magnetic fields and total cosmic rays is valid. In addition, the ratio between the number densities of cosmic-ray protons and electrons, the pathlength through the synchrotron-emitting medium, and the synchrotron spectral index need to be known (Beck & Krause 2005). Here, , a pathlength through the thick disk of kpc/cos(i) (where is the galaxy’s inclination), and (constant over the galaxy) are assumed. The distribution of total field strengths is shown in Fig. 17.
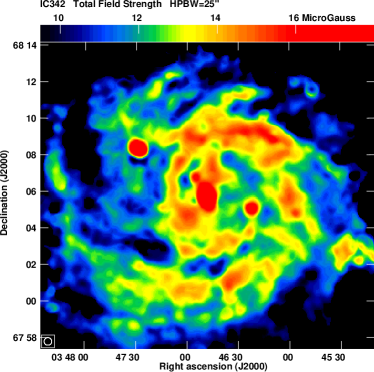
The total field strength varies from in the inner region to at a radius of 5′, to at a radius of 10′ and to at the disk edge in Fig. 17. The average total field strength is within a 3′ radius and within a 6′ radius. The ordered field decreases slowly from near the centre to at a 5′ radius, but increases again to at 8′ radius. Typical values of the total field strength in the main optical spiral arms are , those of the ordered field . The strengths of the ordered field in the northern magnetic arm is . The strongest ordered fields of are found in the outer southern and south-eastern arms. The average strengths of the total and ordered fields within a 7′ radius are and , respectively (Table LABEL:tab:flux).
The uncertainty in field strength is given by the uncertainties of the assumptions. The largest uncertainties are in the values assumed for the pathlength and the ratio . Changing one of these values by a factor changes the field strength by a factor of . Even a large uncertainty of would decrease the field strength by only 16%.
The total magnetic field strength derived from synchrotron intensity is overestimated if the field fluctuates along the line of sight (Beck et al. 2003). If the amplitude of the fluctuations in field strength is similar to its mean value, the field is too strong by a factor of about 1.4. Such extreme fluctuations may occur in turbulent star-forming regions, but hardly in the average ISM.
The assumption of a constant synchrotron spectral index in galaxies is only valid on average, because the synchrotron spectrum is known to be flatter in spiral arms and steeper between the arms (Tabatabaei et al. 2007a). This means that the magnetic field strength is underestimated in the arms and overestimated in the interarm regions. A consideration would require an improved separation of thermal and nonthermal emission, which is not expected to modify the results significantly. An extreme variation in by would change the field strengths by about .
The results for magnetic field strengths and magnetic energy densities in this paper are based on the assumption of energy density equipartition. The general concept of energy equipartition has often been questioned. For example, a correlation analysis of radio continuum maps from the Milky Way and from the nearby galaxy M 33 by Stepanov et al. (2014) showed that equipartition does not hold on small scales, which is understandable in view of the propagation length of cosmic-ray electrons (Sect. 4.1). Using the radio–IR correlation, Basu et al. (2012) and Basu & Roy (2013) argue that the equipartition assumption is valid on kpc scales. Further arguments for equipartition on large scales come from the joint analysis of radio continuum and –ray data, allowing an independent determination of magnetic field strengths, such as in the Large Magellanic Cloud (LMC; see (Mao et al. 2012) and in M 82 (Yoast-Hull et al. 2013).
Another limitation of the equipartition condition emerges from energy losses of cosmic-ray electrons. Energy equipartition is valid between the total magnetic fields and the total cosmic rays that are dominated by protons. Synchrotron radio waves are emitted by cosmic-ray electrons (CREs) that herewith lose energy. Further loss processes are the inverse Compton effect with photons of the galaxy’s radiation field and the CMB, bremsstrahlung and ionization losses with atoms of the neutral gas, and adiabatic losses in expanding outflows. The energy losses of cosmic-ray protons are much greater. As a result, the CR proton-to-electron ratio increases away from CR sources, and the magnetic field strengths are underestimated.
The average surface brightness of radio synchrotron emission (in mJy/arcsec2) of IC 342 is less than half of that in the spiral galaxy NGC 6946 (Beck 2007). As a result, the average total equipartition magnetic field within 7 kpc radius of (Table LABEL:tab:flux) is about 20% weaker in IC 342 than in NGC 6946, and the average ordered field of is even about 30% weaker in IC 342.
The strength of the total magnetic field and the star-formation rate per surface area are related as (Tabatabaei et al. 2013b; Heesen et al. 2014). However, , derived from IR and H data, is about 10% smaller in IC 342 than in NGC 6946 (Calzetti et al. 2010), so that is expected to be only about 1% to 3% smaller in IC 342, which disagrees with the observations. This indicates that the relation between and is not universal, but it varies between galaxies. Parameters other than determine the magnetic field strength, such as the efficiency of magnetic field amplification or the propagation of cosmic-ray electrons (Sect. 4.1). Still, IC 342 does not deviate from the global radio–IR correlation of integrated flux densities (Sect. 3.7).
This paper presents some of the most sensitive radio continuum maps of any spiral galaxy obtained so far. The faintest total intensity detected in IC 342 with the VLA at is about Jy per 25″ beam (3 times the rms noise) (Fig. 2 left), while the faintest total intensity of IC 342 detected with the Effelsberg telescope is mJy per 3′ beam (Fig. 6 left). These values correspond to total field strengths of about and , respectively. The detection of polarized intensity of mJy per 3′ beam with the Effelsberg telescope (Fig. 6 right) corresponds to a strength of the ordered field of in IC 342 (assuming a degree of polarization of 20%). Similarly weak emission was detected with Effelsberg observations of other galaxies (e.g. NGC 5907 (Dumke et al. 2000)).
3.6 Degree of field order
The degree of synchrotron polarization is a measure of the ratio of the field strength of the ordered field in the sky plane and the isotropic turbulent field, the degree of field order, . The field observed in polarization can be a regular field or an anisotropic turbulent field (see footnote (2)). For equipartition between the energy densities of cosmic rays and magnetic field, Eq. (4) from Beck (2007) applies. If cosmic rays are uncorrelated with the magnetic field or constant in energy density, Eq. (2) from Beck (2007) should be used. The equipartition case yields about 15% lower values of than the non-equipartition case.
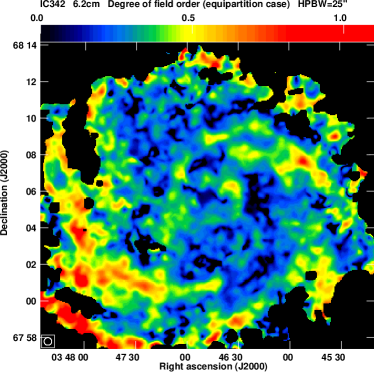
According to Fig. 18, the degree of field order is about 0.3 in the inner galaxy and increases to about 0.4 in the outer parts. In the polarized filaments east and north of the centre, the ordered field can be locally half as strong as the isotropic turbulent field. In the highly polarized outermost arms in the south-east, the ordered field in the sky plane becomes comparable in strength to that of the isotropic turbulent one. Mean-field dynamo models predict a ratio of 0.3–0.5 (Gressel et al. 2008), which increases with decreasing star-formation rate. This is in good agreement with the observations presented here.
The average degree of field order within 7′ radius is (Table LABEL:tab:flux), similar to that in M 33, but less than in M 31, M 51, and NGC 6946 (Tabatabaei et al. 2013a). A low degree of field order predicts a small diffusion coefficient of CREs along the ordered field (e.g. Shalchi 2009, Eq. 3.41) (see discussion in Sect. 4.1).
3.7 Global properties of the radio emission
| (cm) | (mJy) | (mJy) | (%) | (%) | () | () | () | |
|---|---|---|---|---|---|---|---|---|
| 6.2 | ||||||||
| 20.1 | – | – | – |
Table LABEL:tab:flux gives the flux densities of the total and polarized emission of IC 342 at and , integrated in rings in the galaxy’s plane to the optical radius of ′ (about 11 kpc), and the resulting value of the average degree of polarization . A bright background source (no. 2 in Table LABEL:tab:sources) was subtracted before integration. The average degree of synchrotron polarization refers to the radial range for which the map of synchrotron intensity (Fig. 11 right) is complete. The errors in the integrated flux densities are dominated by the uncertainties of the general zerolevel far away from the galaxy.
The average values of the total equipartition field , the turbulent field , the ordered field , and the average degree of field order in Table LABEL:tab:flux are derived from the average synchrotron intensity and at in the radial range . Because the average synchrotron intensities at and are related due to the method of subtracting the thermal emission, they yield the same value for . at is strongly affected by Faraday depolarization and cannot be used to measure .
The flux densities at , integrated to 15′ radius, are mJy for the total and mJy for the polarized intensity, which are the same within the error bars as those measured by Gräve & Beck (1988).
IC 342 is similar to the spiral galaxy NGC 6946 in many aspects. The infrared (m) and radio (20 cm) flux densities of NGC 6946 integrated to kpc are 246 Jy (Dale et al. 2012) and 1.44 Jy (Tabatabaei et al. 2013b), respectively. The ratio of 170 is in the typical range for most spiral galaxies (Murphy et al. 2008). The corresponding values for IC 342 are 448 Jy (Dale et al. 2012) and 2.55 Jy (Table LABEL:tab:flux), which yields a ratio of 175. Both galaxies follow the global radio–IR correlation. The lower radio surface brightness of IC 342 (Sect. 3.5) appears to be compensated by the larger size of IC 342, which is kpc compared to kpc of NGC 6946.
3.8 Pitch angles of the spiral magnetic field and the spiral structures
To determine the intrinsic magnetic pitch angle 888The pitch angle is positive (negative) for a spiral that is winding outwards in the counterclockwise (clockwise) direction., the observed vector is corrected for Faraday rotation, transformed into the galaxy’s plane and the position angle of the local circumferential orientation subtracted. The intrinsic orientation of the ordered magnetic field in the sky plane can be determined from a map of polarization angles at a sufficiently short wavelength where Faraday rotation does not play a role or from a map of polarization angles at (at least) two wavelengths, corrected for Faraday rotation.
| (cm) | No. | Azimuthal range (∘) | Radial range (′) | Structure pitch angle (∘) | Magnetic pitch angle (∘) |
|---|---|---|---|---|---|
| 6.2 | 1 | 70-150 | 4.8-7.9 | ||
| 2 | 80-120 | 9.7-13.7 | |||
| 3 | 230-290 | 2.7-5.2 | |||
| 4 | 240-330 | 2.7-7.4 | … | ||
| 20.1 | 1 | 80-130 | 5.7-10 | ||
| 2 | 80-170 | 6.3-13 | |||
| 5 | 60-100 | 14-20 |
The Effelsberg map at (Fig. 5) has signal-to-noise ratios that are too low to provide reliable maps of intrinsic magnetic field orientations. At the signal-to-noise ratios of the polarized intensity are high enough to measure magnetic pitch angles in restricted regions of the northern and eastern spiral arms and in the central region. The local extrema of Faraday rotation of about (Fig. 22 left) correspond to small rotation angles of up to at . The intrinsic magnetic pitch angle shows systematic variations between and along the northern arm, is roughly constant (about ) in the eastern arm (Fig. 1 right), and obtains high absolute values in the central region (Fig. 24).
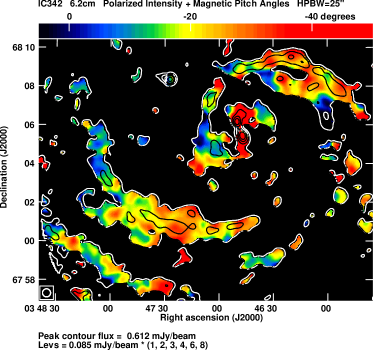
The polarized intensities at 25″ resolution have higher signal-to-noise ratios. Faraday rotation angles are stronger (up to ) than at , but cannot be corrected over the galaxy disk with help of a second frequency, because the polarized emission at is too weak, and the polarized emission at is affected by Faraday depolarization, so that the polarization angles at refer to the upper disk and halo. The apparent vectors at (Fig. 2), which have not been corrected for Faraday rotation, are transformed into the galaxy’s plane. The position angle of the local circumferential orientation is subtracted at each point, resulting in a map of magnetic pitch angles (Fig. 19).
The ordered fields in the main spiral arms in the north – north-west (no. 4 in Fig. 2 right) and south-east (no. 1) have similar average magnetic pitch angles of . (Average pitch angles are still useful because the average Faraday rotation over a spiral arm is small.) The central region shows very large pitch angles of in the northern lobe and in the southern lobe owing to the bar (see Fig. 24). The outer arm in the south-east (no. 2) has a small magnetic pitch angle of .
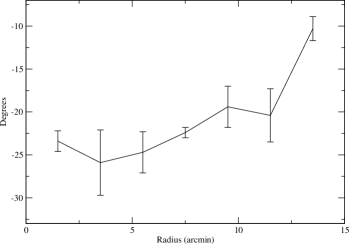
The intensities in Stokes and at are averaged in sectors of 10∘ width in azimuthal angle and 2′ in radius in the plane of the galaxy. The average polarization angles are transformed into magnetic pitch angles with respect to the local azimuthal orientation in the galaxy plane and then averaged along each ring. The average pitch angle of the ordered field increases from about at 1.5′ radius to about at 13′ radius (Fig. 20). The average Faraday rotation measure in the azimuthal averages is that of the Galactic foreground of (Sect. 3.9), which corresponds to a rotation of about at and hence does not significantly affect the pitch angles in Fig. 20.
By fitting the variation between and with azimuthal angle in the galaxy’s plane, Gräve & Beck (1988) found average pitch angles of the axisymmetric spiral (ASS) field of in the ring and in the ring . The variation between and gave and in the same rings (Sokoloff et al. 1992). These values are in good agreement with Fig. 20. The pitch angles of the azimuthal variation derived from the new Effelsberg maps (Fig. 21) are also consistent with Fig. 20.
In the thin-disk approximation of the mean-field dynamo, the magnetic pitch angle 999The magnetic pitch angle is not related to the pitch angle of the spiral structures of the ordered field, though both numbers are generally observed to be similar. is given by where and are the dynamo numbers (Shukurov 2005). Simplified estimates for the dynamo numbers and a flat rotation curve, which is valid beyond a radius of about 7′ in IC 342 (Newton 1980a), give where is the turbulence scale (about 50 pc, Fletcher et al. (2011)), and is the scale height of the ionized gas. The radial variation of in Fig. 20 indicates that the scale height is approximately constant until 12′ radius and increases by about a factor of two between 12′ and 14′ radius. Such flaring is in good agreement with the results for the scaleheights of disks in spiral galaxies (Bagetakos et al. 2011), suggesting that the disk of ionized gas also flares. However, there has been no such hint from H observations of edge-on spiral galaxies so far (Hoopes et al. 1999). Alternatively, the magnetic pitch angle may be affected by gas flows, for instance, by outflows that become weaker towards the outer disk and can decrease the effective dynamo number (Shukurov et al. 2006; Sur et al. 2007).
The pitch angles of the spiral structures of the ordered magnetic field are measured by the slope of the linear features in the map of polarized intensity plotted in polar coordinates (Fig. 14), where five spiral arms can be distinguished. The average structural pitch angles are given in Table LABEL:tab:pitch. Their absolute values decrease with increasing radius. Arm no. 1 at is the extension of arm no. 1 observed at , but with a smaller pitch angle. Arm no. 2 has a similar pitch angle at both wavelengths. The magnetic arm (no. 3) has a similar pitch angle as those of the other arms. The adjacent main inner spiral arm (no. 4) has a smaller pitch angle of about in the central part (Fig. 14 left), while the inner and outer parts of this arm have larger pitch angles of about .
The average magnetic pitch angles and their dispersions given in the last column of Table LABEL:tab:pitch are determined at (Fig. 19). Magnetic pitch angles cannot be measured at due to strong Faraday rotation at this wavelength.
Table LABEL:tab:pitch shows that the orientation of the magnetic field at is on average well aligned with the polarization spiral arms. The variations within each structure (standard deviations of ) are larger than the noise fluctuations of rad for signal-to-noise-ratios of , as used in Fig. 19. This indicates intrinsic fluctuations in Faraday rotation and/or in the orientations of the magnetic field.
3.9 Faraday rotation
| Ring | |||
|---|---|---|---|
| 75 – 125 | |||
| 125 – 175 |
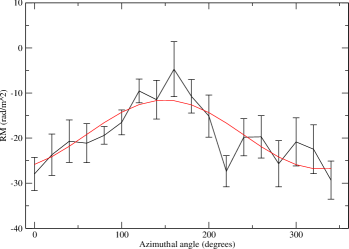
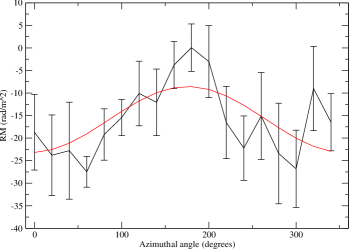
The Effelsberg maps in Stokes parameters and at and are smoothed to a common beam of 5′. Faraday rotation measures () between the polarization angles at these two wavelengths are computed in rings of 5′ radial width in the plane of the galaxy (Fig. 21). The points in each ring are fitted by a function predicted for an axisymmetric spiral (ASS) field, the basic mode generated by mean-field dynamo action (Krause 1987; Gräve & Beck 1988; Krause et al. 1989), namely , where is the of the Galactic foreground, is the amplitude of the variation, the azimuthal angle, and the phase. For the axisymmetric spiral (ASS) field pattern, is identical to the average pitch angle of the field in the corresponding ring. The results of the fits for the outer two rings are given in Table LABEL:tab:rm. The data points for the ring 25 – 75 do not show a significant cosine variation. These results are generally consistent with the previous results at the same wavelengths for the radial rings 55 – 100 and 100 – 144 by Gräve & Beck (1988), but have smaller errors than the previous data. The values of in Table LABEL:tab:rm are significantly smaller than those in Gräve & Beck (1988).
The inclination-corrected amplitude of the ASS field of is and in the two rings of IC 342, which is several times smaller than in M 31 (Fletcher et al. 2004) and M 51 (Fletcher et al. 2011) and about ten times smaller than in NGC 6946 (Ehle & Beck 1993). The is related to the strength of the ASS field as . Assuming an average electron density along the line of sight of and a scale height of the ionized gas of pc, and , similar to the values for M 33, but much lower than in NGC 6946 (Ehle & Beck 1993) and several other spiral galaxies (Van Eck et al. 2015).
The weak ASS-type field and the pitch angles of about and at 10′ and 15′ (Fig. 20) are inconsistent with the relation between these quantities found by Van Eck et al. (2015) (their Fig. 9d), so that the significance of this relation needs further investigation.
The values of from Table LABEL:tab:rm are not well constrained and can be determined at longer wavelengths with higher accuracy (see below). The spiral pitch angles , with large errors, are consistent with those derived independently from the polarization vectors (Fig. 20), supporting an ASS-type field pattern.
Using the VLA-only data that do not include the emission on large scales, a map of (Fig. 22 left) is computed from the maps of polarization angles at and . A second map (Fig. 22 right) is obtained from the polarization angles at from the combined VLA+Effelsberg data and the VLA data, both of which also include the large-scale emission. Ambiguities in values (owing to the ambiguity of polarization angles) of between and and between and are larger than the average values in Fig. 22 and can be excluded.
The average value in of is adopted as the foreground from our Galaxy. It agrees with the value given by Taylor et al. (2009) and Oppermann et al. (2012) at the Galactic coordinates of IC 342 (l=138.2∘, b=+10.6∘) and with the results by Gräve & Beck (1988) and Krause et al. (1989). This value has to be subtracted to obtain intrinsic to IC 342.
The distribution of (Fig. 22 left) at 25″ (about 400 pc) resolution does not show the large-scale pattern of the ASS field seen in Fig. 21, because emission at scales beyond about 2 kpc is missing in these data and the ASS field is very weak. Typical on smaller scales seen in Fig. 22 (left) are about ten times stronger than the amplitude of the underlying ASS field (Table LABEL:tab:rm). The variations in are probably the result of local gas motions and instabilities. In particular, varies systematically along the northern arm, indicating helically twisted field loops (Sect. 4.6).
This result may explain why Van Eck et al. (2015) could not find compelling evidence of any mean-field dynamo action from the current polarization data of nearby spiral galaxies: The regular field with an ASS pattern contributes only a small fraction to the ordered field, and the observational signatures of mean-field dynamo action are hidden by other processes shaping the field on scales of a few 100 pc.
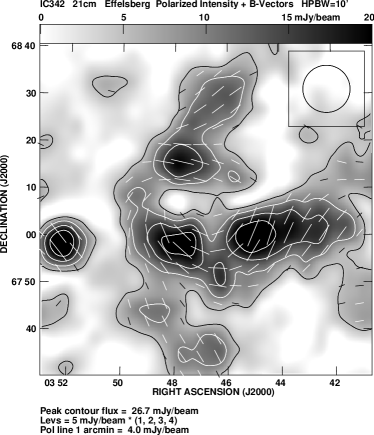
The values of in IC 342 (Fig. 22 right) are generally lower than , as expected for strong Faraday depolarization at (Sect. 3.10). At this wavelength, emission from the inner disk is almost completely depolarized, leaving emission from the upper disk and the halo, as in M 51 (Fletcher et al. 2011).
The noise in the maps of polarized intensity accounts for fluctuations of , where and are the signal-to-noise ratios of the polarized intensities at and . The rms noise in is taken to be the mean rms noise in and . The noise error of between and (Fig. 22 left) is dominated by the fluctuations caused by the low signal-to-noise ratios at ; it increases from in the brightest part of the northern arm, to on average over the northern and eastern arms and to at the cutoff limit of . This agrees with the measured dispersion of in the northern arm.
The noise error of between and (Fig. 22 right) increases from in the brightest part of the south-eastern arm, to over the whole south-eastern arm and to at the cutoff limit of . The measured dispersion in the south-eastern arm is larger () and indicates a contribution of ISM turbulence and field loops to the dispersion.
A detailed analysis of the polarization angles at all four wavelengths will follow in a subsequent paper.
3.10 Faraday depolarization
Faraday depolarization is usually measured by the ratio of the degrees of polarization of the synchrotron intensities at two wavelengths, where means no depolarization and means total depolarization. The determination of the degree of synchrotron polarization requires subtracting the thermal emission from the total emission, which is subject to the uncertainty of the synchrotron spectral index (see Sect. 3.2). Furthermore, the noise in the four input maps of total and polarized intensities at both wavelengths contributes to the uncertainties in . To reduce these problems, is computed as
| (1) |
where is the polarized intensity at frequency , and is the synchrotron spectral index that is assumed to be constant () across the galaxy. Deviations from the assumed affect less severely than the uncertainties of thermal fractions.
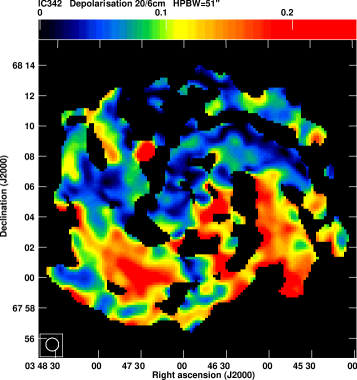
The polarization maps at and at 51″ resolution yield a map of Faraday depolarization (Fig. 23). The is around 0.15 in the southern and western magnetic arms. Lower values around 0.05, i.e. stronger depolarization, are found in the northern and north-eastern parts of the galaxy, located around the side of the major axis (at ), where the galaxy’s rotation is receding (i.e. the radial velocities are positive). Similar asymmetries along the major axis of the projected galaxy disk in the sky plane were found in many other galaxies, for which the minimum polarized emission at owing to strong depolarization is always located on the receding side (Braun et al. 2010; Vollmer et al. 2013). A combination of spiral fields in the disk and vertical fields in the halo, as observed in edge-on galaxies (Krause 2014) and predicted by dynamo models (i.e. large-scale helical fields), is able to explain such asymmetries.
Differential Faraday rotation within the emitting layer leads to depolarization that varies with as a function, with (Sokoloff et al. 1998). At strong is expected for , with lines of zero polarization (“canals”) along level lines with . Because these are not seen in Fig. 4 (right), differential Faraday rotation is probably unimportant in IC 342, and turbulent fields are responsible for Faraday depolarization, as already concluded by Krause et al. (1989) and Krause (1993).
Internal Faraday dispersion by turbulence in the magneto-ionic ISM along the line of sight is computed as (Sokoloff et al. 1998):
| (2) |
where , and is the dispersion in intrinsic rotation measure . The average value of between and requires a dispersion of .
Faraday dispersion in the turbulent ISM is described as , where is the average thermal electron density of the diffuse ionized gas along the line of sight (in ), the random field strength (in ), the pathlength through the thermal gas (in pc,), the turbulent scale (in pc,), and the volume filling factor of the Faraday-rotating gas. Faraday dispersion occurs only if where is the beamsize at the galaxy’s distance ( pc for the beam used for Fig. 23).
While the thermal optical and thermal radio emission is dominated by regions with a small filling factor, Faraday rotation and depolarization occur in the diffuse ionized medium with a large filling factor. Values of , , , and , which are standard values for the ISM of galaxies, yield the required .
The intrinsic rotation measures between and (after subtracting the Galactic foreground contribution) are generally smaller than those between and . The disks of IC 342 and many other galaxies studied so far are not transparent to polarized decimetre radio waves, they are “Faraday thick”. Berkhuijsen et al. (1997) modelled the similar situation in the spiral galaxy M 51 by assuming Faraday dispersion, which depolarizes most of the disk, plus a foreground layer in the upper disk or in the halo, which has a lower polarized intensity and rotation measure than those of the full disk.
3.11 Unresolved sources
A compact, bright, and unpolarized source with a flat spectrum located in the northern spiral arm (at RA, DEC (J2000) , +68∘ 09′ 07″) is seen at all wavelengths, but is particularly prominent in the map (Fig. 1 left). The flux densities are mJy at , mJy at and mJy at . It is also seen in the infrared maps (Figs. 9 and 13), so can be identified as a compact star-forming region.
| No. | RA(J2000) | DEC(J2000) | RM(6/11) | RM(6/20,21) | ||||||
|---|---|---|---|---|---|---|---|---|---|---|
| 1 | 03 41 23 | +68 01 00 | ||||||||
| 2A | 03 47 27.3 | +68 08 20 | – | – | – | |||||
| 2B | 03 47 29.8 | +68 08 24 | – | – | – | |||||
| 3 | 03 52 21 | +67 58 20 |
Most unresolved sources in the radio images presented here are too bright to be regions or supernova remnants in IC 342; they are distant QSOs or radio galaxies in the background. The largest number of sources is detected at (Fig. 4 left). This is partly due to the large primary beam of the VLA at this wavelength and partly due to the steep synchrotron spectrum of most distant radio sources.
Four background sources show significant degrees of polarization between 2% and 12% at and at 51″ resolution. Only one of these polarized sources is also included in the field observed at (Fig. 2). It consists of two components (named 2A and 2B in Table LABEL:tab:sources). The of the western component of is similar to that of the Galactic foreground, while the of the eastern component has a significant internal rotation. The ambiguity cannot be solved with help of the data at other wavelengths because the sources are located outside of the VLA fields observed at . With the large Effelsberg beams at and they cannot be distinguished from the diffuse emission.
Polarization from two strong, compact background sources (named 1 and 3 in Table LABEL:tab:sources) is detected in the Effelsberg maps at , and . Their are wavelength-dependent and hence partly of internal origin. Both sources are interesting targets for detailed investigations of future multi-frequency data to be obtained with JVLA and LOFAR.
3.12 Magnetic fields in the central region
The central region of IC 342 hosts a bar of dust and cold gas with a wealth of molecular lines (Eckart et al. 1990; Schulz et al. 2001; Helfer et al. 2003; Meier & Turner 2005; Lebrón et al. 2011) and starburst activity (Ishizuki et al. 1990). The recent nuclear starburst event is 4–30 Myr old, and the present star-formation rate is reduced because fueling the nucleus is currently prevented by feedback from stellar winds and supernova shock fronts (Schinnerer et al. 2008). The nuclear region is also bright in radio continuum (Turner & Ho 1983) and in X-rays (Bregman et al. 1993; Bauer et al. 2003). In terms of size, dynamical mass, molecular mass, and star-formation rate, the nucleus of IC 342 is a potential twin of the Galactic centre (Meier 2014).
While the central bar in total intensity at the highest available resolution (Fig. 1 left) coincides with the central bar in the CO line emission of molecular gas (e.g. Helfer et al. 2003), the polarized emission reveals a “double-lobe” structure that is displaced from the CO bar (Fig. 24). The average degree of polarization (uncorrected for thermal emission) is about 8% in the northern lobe and about 4% in the south. The northern peak in polarized intensity is offset by about 5″ ( pc) from the CO ridge towards the east and the southern peak by 2″ ( pc) towards the west. Since the galaxy is rotating counter-clockwise, the ordered field is strongest on the preceding side of the bar. The orientations of the ordered field lines follow the ridge of the bar, but around the bar the field is oriented at large angles with respect to the bar ridge, forming a spiral pattern with large pitch angles.
These results resemble the observations of polarized emission in the galaxies NGC 1097 and NGC 1365 hosting large bars (Beck et al. 2005). According to numerical modelling of gas in a bar potential (Athanassoula 1992), the flow velocity of gas and magnetic fields is faster than the pattern speed of the bar and enters the bar from the receding side. Field compression is greatest on the preceding side of the bar. The ordered field in the central region of IC 342 traces the flow pattern that is a down-sized version of the field pattern around large bars. The magnetic field may support the outward transport of angular momentum that is required to fuel the central region with gas.
The average Faraday rotation between and is positive in the northern “lobe” and negative in the southern one (Fig. 22 left). Taking the orientation of the galaxy’s disk into account, the radial component of the regular magnetic field is directed away from the centre of IC 342 on the northern and the southern sides. This direction is opposite to the radial component of the axisymmetric disk field that points inwards (Gräve & Beck 1988; Krause et al. 1989), with a field reversal between the central region and the spiral arm region.
Mean-field dynamo models can generate field reversals (e.g. Moss et al. 2012), but these are not associated with large jumps in magnetic pitch angles as observed in IC 342. As a result, the magnetic field in the central region is probably disconnected from the axisymmetric field in the disk. A similar dichotomy between the central and the outer disk field has also been found in M 31 (Gießübel & Beck 2014). Independent mean-field dynamos may operate in the disk and in the central region of a galaxy. The central disk in M 31 is strongly inclined with respect to the outer disk. The inclination of the bar region of IC 342 is hard to measure, but is probably different from that of the disk, too (Crosthwaite et al. 2001).
4 Discussion
4.1 Propagation of cosmic-ray electrons
Beyond of 5′ radius in the disk of IC 342, there is a rapid decrease in thermal intensity (Fig. 12 right). Thermal emission is a measure of the star-formation rate and of the production of massive stars, the progenitors of supernova remnants, which are the probable sites of cosmic-ray acceleration. The total intensity in the outer disk is mostly synchrotron emission and reflects the distribution of cosmic-ray electrons (CREs) diffusing and radiating in the interstellar magnetic field. The break in radio synchrotron intensity at about 6′ radius (Fig. 12 right) indicates a break in the distribution of cosmic-ray sources. The smooth distribution beyond the break radius can be explained by diffusion of the CREs of a few kpc before they leave the star-forming disk. The wavelength-dependent distributions (Fig. 12 left) can also be understood as the result of CRE diffusion, as suggested previously by Basu & Roy (2013), Tabatabaei et al. (2013a), and Berkhuijsen et al. (2013).
In the case of propagation by energy-independent diffusion, the CRE particles are scattered by the irregularities in the magnetic field. The diffusion length () depends on the diffusion coefficient () and the CRE lifetime () as . If, however, CREs propagate with respect to the gas by the streaming instability (e.g. Kulsrud 2005), the propagation length is , where is the Alfvén velocity. It is generally assumed that (where is the gas density), so that const. If the CRE lifetime is limited by synchrotron loss, , where is the frequency at which the CREs of energy radiate in the total field in the sky plane (). If the CRE lifetime is limited by inverse Compton loss, , where is the equivalent magnetic field strength having the same energy density as the radiation field. As a result, we expect for diffusive propagation or for streaming propagation.
The frequency dependence of synchrotron scalelengths in the outer disk of IC 342 (Table LABEL:tab:length) yields , which is in good agreement with streaming propagation. Forthcoming observations at lower frequencies with LOFAR will allow us to test this dependence with higher accuracy. The streaming propagation length for a given CRE lifetime is longer than that for diffusive propagation, which may also explain the large scalelengths of the radio disk of IC 342 (Sect. 3.3) and the low radio surface brightness (Sect. 3.5).
LOFAR and VLA data of the spiral galaxy M 51 also reveal breaks in the radial distribution of the nonthermal emission at a radius of about 10 kpc, beyond which the star-forming activity decreases sharply (Mulcahy et al. 2014), suggesting a similarity of the underlying physical processes between M 51 and IC 342. However, the difference in exponential scalelengths at between the inner and the outer disks is shorter in M 51 than in IC 342. Furthermore, the exponential scalelengths in the outer disk of M 51 have a frequency dependence that is weaker than in IC 342 and is consistent with diffusive propagation. Basu & Roy (2013) studied the ratio of scalelengths between and in five spiral galaxies. For two galaxies (NGC 4736 and NGC 6946) the values are consistent with diffusive propagation, and three cases are unclear.
CRE propagation seems to be different between galaxies, but the reason remains unclear. M 51 has a weak large-scale regular field but a strong anisotropic turbulent field (Fletcher et al. 2011) that may support diffusive propagation along the field. A regular magnetic field generated by a mean-field dynamo like in IC 342 (Fig. 6) may favour streaming propagation. However, the field is more regular in NGC 6946 (Beck 2007) where diffusive propagation seems to dominate (Basu & Roy 2013). These contradictory results call for further studies of a larger sample of galaxies.
4.2 Energy densities
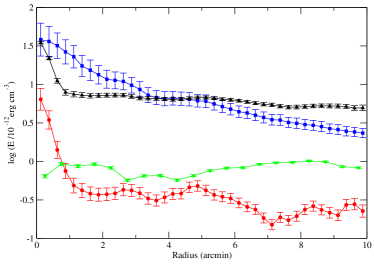
The energy densities of the various components of the ISM in IC 342 (Fig. 25) are determined in rings in the plane of the galaxy that is inclined by . The energy density of the total equipartition magnetic field () in the disk, identical to that of the total cosmic rays in case of the equipartition assumption, is derived from the map of synchrotron intensity at at 25″ resolution (Fig. 11 right), assuming a constant pathlength through the emitting medium of 1 kpc/cos(i). The energy density of the ordered magnetic field is derived from the average synchrotron intensity and the degree of synchrotron polarization at in the same rings (Fig. 16 right). The thermal energy density () of the warm ionized gas ( K) is calculated from the map of thermal radio emission (giving the emission measure , which is dominated by regions (see Fig. 11 left), using a pathlength of 100 pc/cos(i) and a constant volume filling factor of 5% (Ehle & Beck 1993). The average number density of the regions decreases from about at 1′ radius to about at 5′ radius.
The number density of the total neutral gas (molecular + atomic) is taken from Crosthwaite et al. (2001). Here, decreases from about at 1′ radius to about at 5′ radius. The molecular gas traced by the CO emission dominates the total neutral gas until about 3′ radius. To compute the kinetic energy density ( vtur) of the turbulent motion of the total neutral gas, its turbulent velocity is assumed to be v, taken from the average velocity dispersion derived for the gas, which is almost constant in the inner disk of IC 342 (Crosthwaite et al. 2000). The velocity dispersion derived for the molecular gas in the inner 3′ is larger (Crosthwaite et al. 2001), but this is due to non-circular motions on larger scales than the turbulent scale. Similar values for the velocity dispersions in and CO of about have been derived by Caldú-Primo et al. (2013) for a sample of 12 nearby spiral galaxies.
The energy densities of the turbulent motion and the total magnetic field are similar in the inner disk (Fig. 25), and both are more than an order of magnitude higher than the thermal energy density. Turbulence in IC 342 is supersonic, and its ISM is a low– plasma (where is the ratio of thermal to magnetic energy densities).
Beyond about 5′ radius, the magnetic energy density decreases only slowly and is higher than that of all other energy densities. This result is similar to those found in NGC 6946 (Beck 2007), M 33 (Tabatabaei et al. 2008) and the four galaxies studied by Basu & Roy (2013). The total magnetic energy density is overestimated if the field strength fluctuates along the line of sight (Sect. 3.5), but can hardly remove the dominance of magnetic energy. On the other hand, the dominance of magnetic energy is probably even greater in the outer parts of the galaxy because of energy losses of cosmic-ray electrons (Sect. 3.5) and because vtur decreases with radius in the outer disk, as indicated by the velocity dispersion (Crosthwaite et al. 2000).
The energy density of the ordered field in IC 342 is roughly constant to about 5′ radius 101010In the innermost ring, the value is a lower limit due to beam depolarization. and increases in the outer galaxy (Fig. 25), which is a challenge for classical mean-field dynamo models (see Sect. 4.4). Other than in IC 342, a slow decrease was found in NGC 6946 (Beck 2007). However, the values for NGC 6946 were erroneously determined by assuming equipartition between cosmic rays and the ordered magnetic field, leading to overestimates at short radial distances and underestimates at large radial distances. Applying the correct method to the data of NGC 6946 leads to similar behaviour to Fig. 25.
4.3 Magnetic field extent
In case of equipartition and constant ratio between the number densities of cosmic-ray protons and electrons, the scalelength of the total magnetic field is 4 times larger than the synchrotron scalelength at high frequencies, where flattening by CRE diffusion is unimportant. With kpc in the outer disk (Table LABEL:tab:length), kpc. This value is still a lower limit because is expected to increase with radius. The total magnetic field of IC 342 probably extends far out into intergalactic space. A similar result was obtained for NGC 6946 (Beck 2007).
The weakest total and ordered fields detected in the outer disk of IC 342 are about and , respectively (Sect. 3.5). At the low frequencies observable with LOFAR, the synchrotron intensity is higher and maps of magnetic field strengths can be obtained with high accuracy, such as for M 51 (Beck et al. 2013; Mulcahy et al. 2014). Detection of even weaker fields 111111For total magnetic fields of strength at redshift the energy loss of cosmic-ray electrons is dominated by the inverse Compton effect in the CMB background. will become possible with more sensitive instruments like the JVLA and the planned Square Kilometre Array (SKA) (Beck 2015a).
Weak regular magnetic fields can also be measured by their Faraday rotation of polarized emission from background sources, but also requires deep integrations to obtain a sufficiently large number of sources (Stepanov et al. 2008). The observations presented in this paper detected only one source behind the inner disk of IC 342 and another three behind the outer disk (see Sect. 3.4), insufficient to separate the Faraday rotation contributions of IC 342 from that of the Milky Way. The SKA will be able to increase this number significantly.
4.4 Dynamo action in the outer disk
In IC 342 (like in NGC 6946 and M 33) the magnetic energy density decreases more slowly than the turbulent energy density and dominates beyond about 5′ radius, while models of field amplification by small-scale and mean-field dynamos predict a close similarity between these energy components (Beck et al. 1996; Gent et al. 2013). This may point towards an additional source of turbulence supporting mean-field dynamo action in the outer disk. For example, the magneto-rotational instability (MRI) (Balbus & Hawley 1998) is able to explain the velocity dispersion in the line of galaxies in the outer disk () (Tamburro et al. 2009).
The radially increasing energy density of the ordered field in Fig. 25 is even more surprising. Present-day Faraday rotation data (Sect. 3.9) are insufficient to decide whether the ordered field in the outer disk is regular (i.e. of dynamo type) or anisotropic turbulent (due to enhanced shear or compression). In the latter case, the field anisotropy would need to increase with radius. One source of anisotropy is shear (). However, for a flat rotation curve, decreases with increasing radius, so that other sources of enhanced shear would be needed, for example, through the interaction with a companion galaxy or with the intergalactic medium.
If the ordered field in the outer disk is regular, the mean-field dynamo should have a radially increasing efficiency to overcome the general decrease in the total equipartition field. The mean-field dynamo can also operate in the outer disk of galaxies (Mikhailov et al. 2014). The dynamo efficiency in the thin-disk approximation can be estimated by a few parameters, rotational shear at radius given by , turbulent velocity vtur, and scale height of the ionized gas (Arshakian et al. 2009). For a flat rotation curve and constant vtur, the dynamo efficiency scales as and may increase with radius if increases faster than linearly with radius . However, the radial variation of magnetic pitch angles (Fig. 19) gives no indication for a significant increase in until 10′ radius.
The regular field generated by a mean-field dynamo could be transported to the outer disk by the joint action of a dynamo and turbulent diffusivity (Moss et al. 1998). With a propagation speed of a few kpc per Gyr (Mikhailov et al. 2014), this process is slow and needs continuous dynamo action without disturbing merger events.
Finally, advanced dynamo simulations indicate that the mean-field dynamo (that dominates in the outer disk) can generate regular fields with an energy density significantly larger than that of turbulent gas motions (Shapovalov & Vishniac 2011; Brandenburg 2014). The saturation level is given by the balance between the Lorentz force and forces exerted by large-scale gas motions. A radially increasing strength of the regular field would require a higher energy density of gas motions, such as an increasing rotation curve, as indicated from data in the outer disk (Newton 1980a; Crosthwaite et al. 2000).
Vice versa, Ruiz-Granados et al. (2010) propose that the extended regular magnetic field exerts forces to the gas in the outer parts of the galaxy and may explain the increase in the rotation velocity in M 31 beyond 30 kpc radius. The velocity increase in IC 342 beyond about 20 kpc (Crosthwaite et al. 2000; Meidt et al. 2009) may also have a magnetic origin. A proper estimate of magnetic forces will become possible when the radial profiles of the turbulent and regular magnetic fields are measured with high accuracy (Elstner et al. 2014).
Future sensitive Faraday rotation measure () data, preferably measuring an grid of polarized background sources with the Square Kilometre Array (SKA) and its precursor telescopes ASKAP and MeerKAT could shed light on the mystery of the strong magnetic fields in outer galactic disks (Beck 2015a).
4.5 The polarization spiral arms in IC 342
Five types of polarization spiral arms are observed in IC 342:
(1) A narrow arm (about 300 pc wide, corrected for beam smoothing) seen at (Fig. 13 left, north of DEC=+68∘ 06′) is located at the inner edge of the dust arm, east of the central region, and runs parallel to the adjacent material arm with an inward shift of about 200 pc. This indicates compression by density waves, as in the galaxy M 51 (Patrikeev et al. 2006). The eastern arm is similarly narrow (200–300 pc) in both dust and total radio emission (Fig. 9 right), indicating compression of magnetic field and gas by a density wave. Indeed, the CO line emission shows distortions in the velocity field (Crosthwaite et al. 2001). The magnetic pitch angle is aligned with the spiral structure (Fig. 1 right), as expected from density-wave compression. The polarization degree of synchrotron emission of about 16% at is similar to that observed in the spiral arms of M 51 (Fletcher et al. 2011).
(2) A broad arm (300–500 pc wide) with a ridge line that oscillates around the northern dust arm (no. 4 in Fig. 2 right, seen also in Fig. 1 right and 13 left). Polarized intensity, magnetic pitch angle, and Faraday rotation measures are also oscillating. These field distortions are probably due to the Parker instability (Sect. 4.6). Why this phenomenon occurs only in this region of the galaxy remains unclear.
(3) A broad arm south of the north-western spiral arm seen at (no. 3 in Fig. 2 right) that is located between the main dust arms and associated with weak dust emission (Fig. 13 left). This spiral arm has a constant pitch angle (Fig. 14 left) and a width of about 500 pc. Location, width, and pitch angle qualify it as a magnetic arm. However, the average polarization degree of synchrotron emission of 18%, the extent of about 5 kpc and the ordered field strength of about are significantly lower than those for the magnetic arms of NGC 6946 (Beck 2007), so that this arm is called a rudimentary magnetic arm.
(4) Broad and long spiral arms in the outer south-eastern galaxy seen at , roughly coincident with arms of dust and total neutral gas (nos. 1, 2 and 5 in Fig. 4 right, also seen in Figs. 13 right and 15). The typical degrees of polarization at 25″ resolution are 10%, 20%, and 30% for the inner, middle, and outermost arms. The ordered field strength is about . There are no signs of crossing between the polarization and gaseous arms, as claimed by Krause et al. (1989) based on older data. Aligned arms of gas and magnetic fields can be a signature of fast MHD density waves (Lou et al. 1999; Lou & Fan 2002). The almost constant pitch angles of the polarization arms (Table LABEL:tab:pitch) further support that this is a large-scale wave phenomenon. In mean-field dynamo models, the magnetic pitch angle is independent of the spiral structure in the gas, so that no alignment is expected from dynamo action alone.
4.6 A helically twisted Parker loop
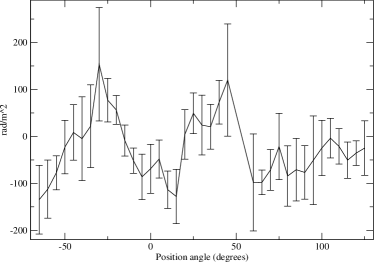
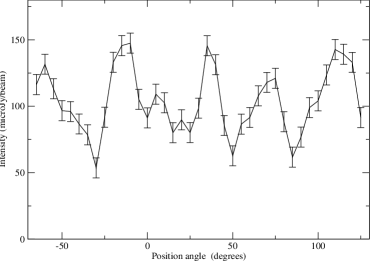
Faraday rotation measures (Fig. 22 left) are found to vary quasi-periodically along a half-circle delineating the northern spiral arm (no. 4 in Fig. 2 right), with two pronounced maxima at about ∘ and +40∘ position angles, one pronounced minimum at about +10∘ and a broad minimum around +80∘ (Fig. 26 left). The average distance between extrema of about 35∘ corresponds to about 2.1 kpc at the radius of the half circle. This feature can be interpreted as a magnetic loop (“Parker instability”) extending out of the galaxy’s disk and out of the sky plane, giving rise to a periodic pattern in . A regular field bending out of the plane should lead to minima in polarized intensity (tracing the field component in the sky plane) at locations where (tracing the field component along the line of sight) is at its maximum. Indeed, Fig. 26 (right) shows minima of polarized intensity roughly at the locations of extrema in , with a similar distance between the maxima or minima of about 37∘ or 2.2 kpc.
This is the second indication of a Parker loop in the magnetic field of a nearby galaxy, after M 31 (Beck et al. 1989). The numerical models by Kim et al. (2002) (who assume ) predict a wavelength of the most unstable symmetric mode between and , where is the scale height of the gas. The peak-to-peak wavelength of about 4 kpc measured in IC 342 corresponds to pc, which is larger than typical scale heights of gas disks of spiral galaxies (Bagetakos et al. 2011). The reason for this discrepancy may be that the assumption of is incorrect, because observations indicate (Sect. 4.2).
The magnetic field in the northern arm diverts not only in the vertical direction, but also in the disk plane. The ridge line of the polarization spiral arm (Fig. 13 left), as well as the magnetic pitch angle at (Fig. 1 right), oscillates around the northern dust arm with similar periodicity. This gives indication for a large-scale, helically twisted flux tube, as predicted by models of the Parker instability (Shibata & Matsumoto 1991; Hanasz et al. 2002).
Further radio polarization observations with higher resolution may uncover more helical loops in spiral galaxies.
4.7 Origin of magnetic arms
In most spiral galaxies observed so far, the highest polarized intensities (i.e. strongest ordered fields) are detected between the optical arms, filling a large fraction of the interarm space, sometimes concentrated in magnetic arms, as in NGC 6946 (Beck 2007). The southern-sky spiral galaxy NGC 2997 hosts compressed magnetic fields at the inner edges of material arms, as well as one well-developed magnetic arm (Han et al. 1999). The stronger density waves in NGC 2997 lead to higher degrees of polarization at of typically 25% at the inner edge of the northern arm, similar to those in M 51 (Fletcher et al. 2011). The degree of polarization of the magnetic arm of 40% and its length of at least 10 kpc are similar to that in NGC 6946; both values are much higher than in IC 342. Like IC 342, M 51 has a short, rudimentary magnetic arm with a low degree of polarization (Fletcher et al. 2011). NGC 1566 shows signatures of a magnetic arm in the south-east (Ehle et al. 1996), but the angular resolution of these radio observations was too coarse to clearly detect magnetic arms. In large barred galaxies, ordered magnetic fields also fill most of the interarm space, but do not form well-defined magnetic arms, as seen in NGC 1672 (Beck et al. 2002), NGC 2442 (Harnett et al. 2004), NGC 1097, and NGC 1365 (Beck et al. 2005).
Several mechanisms have been proposed to explain the higher degree of field order in interarm regions:
(1) Magnetic field ropes as a result of a magnetic buoyancy instability in a turbulent high– plasma
(Kleeorin & Rogachevskii 1990) however, the ISM of galaxies is a low– plasma,
meaning that the thermal pressure is lower than the magnetic pressure (Sect. 4.2);
(2) slow MHD density waves in the rigidly rotating inner region of a galaxy (Lou et al. 1999; Poedts & Rogava 2002) however,
slow MHD density waves in 3-D can be subject to the Parker and shearing instabilities (Foglizzo & Tagger 1995);
(3) more efficient action of the mean-field dynamo between the optical
arms due to lower turbulent velocity in interarm regions (Moss 1998; Shukurov 1998);
however, the observed turbulent velocity is not lower in the interarm regions (Crosthwaite et al. 2001);
(4) more efficient mean-field dynamo action between the optical arms due to a smaller correlation length in
interarm regions (Rohde et al. 1999); however, no indication of such a variation in correlation length has
been found from observations so far;
(5) introduction of a relaxation time of the magnetic response in the dynamo equation, leading to a phase
shift between the material and magnetic spiral arms (Chamandy et al. 2013a, b) however, the resulting
magnetic arms are restricted to a relatively small region around the corotation radius and have a much smaller
pitch angle than do gaseous arms;
(6) magnetic arms generated by multiple interfering spiral patterns (Chamandy et al. 2014) they are more extended than
those mentioned under (5), but these still have too small pitch angles;
(7) drift of magnetic fields with respect to the gaseous arms in a non-axisymmetric gas flow caused by a spiral
perturbation (Otmianowska-Mazur et al. 2002) or by a bar (Kulpa-Dybeł et al. 2011);
(8) suppression of the mean-field dynamo in the material arms by continuous injection and amplification of
turbulent fields by supernova shock fronts (Moss et al. 2013);
(9) suppression of the mean-field dynamo in the material arms by star-formation-driven outflows
(Chamandy et al. 2015);
(10) magnetic arms as a transient phenomenon during the evolution of galactic magnetic fields,
possibly related to the short lifetimes of spiral patterns seen in numerical simulations
(e.g. Sellwood 2011; Wada et al. 2011; Dobbs & Baba 2014).
Models (7) – (10) are the most promising ones. However, all these models are simplified and consider either
gravitational perturbations or dynamo action.
Self-consistent MHD models of galaxies, including the gravitational potential
with spiral perturbations and mean-field dynamo action, are still missing.
The origin of the rudimentary magnetic arm in IC 342 deserves a detailed discussion. The absence of long magnetic arms in IC 342 is surprising in view of the apparent similarities between IC 342 and NGC 6946, like the rotation curve (Crosthwaite et al. 2000; Boomsma et al. 2008) and the star-formation surface density (Calzetti et al. 2010). One difference is the “lopsided” spiral structure of NGC 6946, with a spiral arm with massive star formation in the north-east and an asymmetric rotation curve in (Crosthwaite et al. 2000). Although lopsidedness enhances angular momentum transport (Jog & Combes 2009), it hardly modifies the mass distribution and hence cannot stabilize the spiral pattern.
Increasing the star-formation surface density in mean-field dynamo models decreases the general field order, while magnetic arms become more pronounced (Moss et al. 2013). However, the star-formation rate per surface area () is only about 10% higher in NGC 6946 than in IC 342 (Calzetti et al. 2010) and hence cannot explain the difference in the magnetic pattern between these two galaxies.
The timescale of mean-field dynamo amplification in a galaxy with a flat rotation curve can be approximated as (v (Gießübel & Beck 2014). The maximum rotation velocity vrot is almost the same in both galaxies. Assuming that and are also similar, the dynamo timescale of IC 342 is about 1.7 times larger owing to its larger disk radius , measured by the optical radius . The timescale of field ordering also depends linearly on radius (Arshakian et al. 2009), so that the dynamo in IC 342 needs more time to develop a stable magnetic pattern.
The evolution of a spiral magnetic pattern in IC 342 may be hampered further by the possible tidal interaction with the Local Group (Buta & McCall 1999) and/or by the complex spiral pattern in the gas of IC 342, described by a superposition of a two- and four-armed spiral pattern with different pattern speeds (Meidt et al. 2009), which may lead to an unstable spiral pattern (Crosthwaite et al. 2000). The mean-field dynamo needs a least a few rotation periods to build up a regular field (e.g. Moss et al. 2012). A short lifetime of a stable pattern may not allow the formation of magnetic arms. The existence of two regions of magnetic fields with opposite directions in disk and central region (Sect. 3.12) and the relatively weak ordered field (Sect. 3.7) are further hints that the large-scale field structure is not (yet) fully developed in IC 342.
The spiral pattern in the gas of M 51 is also distorted and short-lived, so that only a weak large-scale regular field and a rudimentary magnetic arm could develop. On the other hand, NGC 6946 has a two-armed spiral pattern with a well-defined pattern speed (Fathi et al. 2007), the spiral field extends smoothly into the central region (Beck 2007) and the large-scale regular field is strong (Ehle & Beck 1993)
In summary, the existence of magnetic arms may indicate a stable spiral arm pattern over several galactic rotation periods, which may not be given in IC 342.
Models of spiral perturbations in stars and gas (e.g. Wada et al. 2011) have neglected the effect of magnetic fields so far. The only dynamo model for the amplification and ordering of magnetic fields including the spiral perturbations of gas density and gas velocity is the kinematical model by Otmianowska-Mazur et al. (2002), in which the back reaction of the field onto the gas flow was not included. The MHD model of Pakmor & Springel (2013) includes self-gravity and spiral perturbations, but no mean-field dynamo action. There is urgent need for a synergy between these approaches to achieve a comprehensive description of the evolving magnetized ISM in galaxies.
Further polarization observations with higher resolution of IC 342, NGC 2997, NGC 6946, and other galaxies with magnetic arms in different evolutionary stages are needed for a better understanding of this phenomenon.
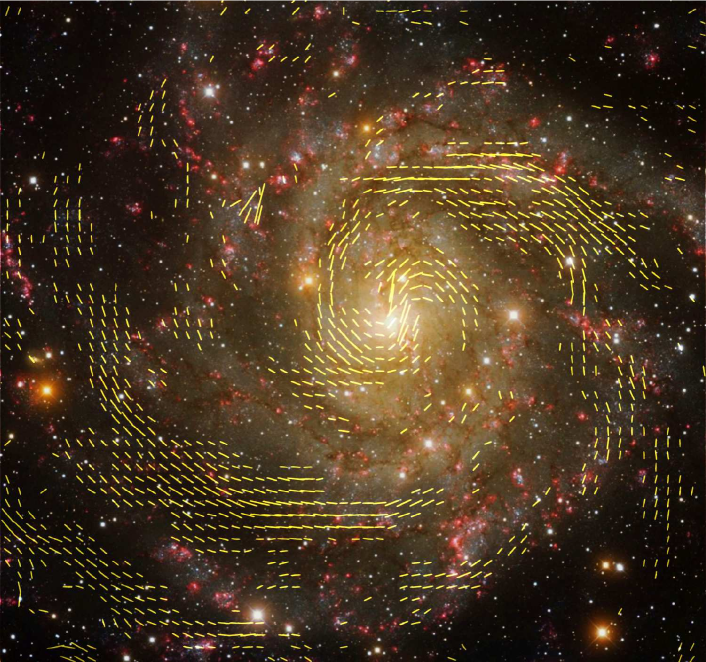
5 Summary and conclusions
The total and polarized radio continuum emission from the nearby spiral galaxy IC 342 was observed in four wavelength bands with the Effelsberg and VLA telescopes. The main results are the following.
(1) The total intensity maps of IC 342 show many spiral filaments embedded in a diffuse disk. The VLA map at alone misses most of the diffuse emission and contains only about 38% of the total flux density, while about 75% of the polarized emission at was detected with the VLA alone. The diffuse disk of polarized emission seen in the Effelsberg maps at and is resolved into spiral arms of ordered fields with the VLA, while in total emission, the diffuse disk of turbulent magnetic fields is seen at low and high resolution.
(2) The total radio emission closely follows the dust emission in the infrared at 8 m (SPITZER) and at 22 m (WISE). This relation shows that the amplification of total (mostly turbulent) magnetic fields occurs in star-forming regions, probably by the turbulent dynamo (Beck et al. 2012; Schleicher & Beck 2013; Pakmor et al. 2014).
(3) The radial distributions of the total synchrotron emission at and can be described by different exponential functions in the inner and outer disks with a break radius at about 6′, similar to the break radius in the distribution of the thermal emission and of the total neutral gas between the inner (strongly star-forming) and outer disks. The radial scalelength in the outer disk at is about 1.7 times larger than at , indicating a larger propagation length of the lower-energy cosmic-ray electrons (CREs) radiating at the longer wavelength, probably via the streaming instability. The average radial scalelengths of the radio disk of IC 342 of kpc at and at are the largest ones found in any galaxy so far, which may be related to fast CRE propagation by the streaming instability.
(4) The equipartition strength of the total field in the main spiral arms is typically , that of the ordered field . The strongest ordered fields of about are found in the outer southern and south-eastern arms. The average strengths of the total and ordered fields within a 7′ radius of the disk are and , respectively. The average ordered field of is about 30% weaker than that in NGC 6946, indicating less efficient mean-field dynamo action in IC 342.
(5) The average surface brightness of the total radio synchrotron emission of IC 342 is less than half that of the spiral galaxy NGC 6946. Consequently, the average total equipartition field in IC 342 is about 20% weaker than in NGC 6946, which is smaller than expected from the star-formation rate per surface area. Other parameters seem to influence the total field strength, such as the efficiency of magnetic field amplification or the propagation characteristics of cosmic-ray electrons.
(6) The energy densities of the turbulent gas motions and the total magnetic field are similar in the inner disk, and both are more than an order of magnitude higher than the thermal energy density. Turbulence in IC 342 is supersonic, and its ISM is a low– plasma. Beyond about 5′ radius the magnetic energy density becomes dominant, indicating that the saturation level of the field is determined by forces exerted by large-scale gas motions.
(7) The average magnetic pitch angle of the ordered field varies from about at 1.5′ radius to about at 13′ radius. In terms of the mean-field dynamo, such a variation indicates an increase in the scale height of the ionized gas by about a factor of two between 12 kpc and 14 kpc radius, similar to the flaring of disks.
(8) Faraday rotation measures (RM) of the polarization angles seen in the Effelsberg maps confirm that the large-scale regular field has an underlying axisymmetric spiral (ASS) structure, as previously found by Krause (1987), Gräve & Beck (1988), and Krause et al. (1989). The strength of the ASS field of is about one order of magnitude weaker than the field observed on scales of a few 100 pc in the map derived from the VLA data.
(9) The ridge line of polarized emission in the north (no. 4 in Fig. 2 right), the polarization angles, and the Faraday rotation measures show that the magnetic field oscillates around the northern arm on a scale of about 2 kpc, indicative of a helically twisted flux tube, which was probably generated by the Parker instability.
(10) In the eastern inner spiral arm (near to the central region), the magnetic field is compressed by a density wave, forming a narrow polarization arm of about 300 pc width that is displaced inwards with respect to the dust arms by about 200 pc. The polarization degree of synchrotron emission of about 16% indicates mild compression. The magnetic field is well aligned along the ridge line.
(11) A rudimentary magnetic arm with constant pitch angle is located in an interarm region in the north-west (no. 3 in Fig. 2 right). The much longer magnetic arms in NGC 2997 and NGC 6946 are possibly due to more efficient mean-field dynamo action in a more stable density-wave environment, while the dynamo in IC 342 is slow and weak, probably disturbed by the bar, tidal interaction, or a transient spiral pattern. Magnetic arms may be a signature of a mean-field dynamo supported by a spiral arm pattern that is stable over several rotation periods.
(12) Several broad polarization arms in the outer galaxy (nos. 1, 2, and 5 in Fig. 4 right) are of spiral shape and mostly coincide with arms in the total neutral gas. The magnetic pitch angles are as small as the pitch angle of the structure itself. Fast MHD density waves can generate such coincident spiral arms in the gas and magnetic field.
(13) The magnetic field in the central region resembles that of large barred galaxies like NGC 1097. It has a regular spiral pattern with a large pitch angle and is directed outwards, opposite to the direction of the disk field. Independent mean-field dynamos may operate in the central region and in the disk.
(14) Polarized emission at is strongly affected by Faraday depolarization in the northern part of the galaxy, where the galaxy’s rotation is receding. Similar asymmetries were found in many other mildly inclined galaxies. Helical fields extending from disk to halo as predicted by mean-field dynamo models can account for this.
Acknowledgements.
This work is based on observations with the VLA, operated by the NRAO, and the 100-m telescope of the MPIfR (Max-Planck-Institut für Radioastronomie) at Effelsberg. – This work is based in part on archival data obtained with the Spitzer Space Telescope, which is operated by the Jet Propulsion Laboratory, California Institute of Technology under a contract with NASA. This publication makes use of data products from the Wide-field Infrared Survey Explorer (WISE), which is a joint project of the University of California, Los Angeles, and the Jet Propulsion Laboratory/California Institute of Technology, funded by the National Aeronautics and Space Administration. The author thanks the operators at the Effelsberg telescope for their support, the VLA team for performing the observations and help during data reduction, Bill Sherwood for processing the Effelsberg data at and Uli Klein for help with generating Fig. 27. Aritra Basu, Michal Hanasz, Marita Krause, Woong-Tae Kim, and Fatemeh Tabatabaei are acknowledged for useful discussions and comments. Special thanks go to Marita Krause and Elly M. Berkhuijsen for careful reading of the manuscript, and to the anonymous referee for suggestions that helped to improve the paper. Financial support from DFG Research Unit FOR1254 is acknowledged.References
- Arshakian et al. (2009) Arshakian, T. G., Beck, R., Krause, M., & Sokoloff, D. 2009, A&A, 494, 21
- Athanassoula (1992) Athanassoula, E. 1992, MNRAS, 259, 345
- Bagetakos et al. (2011) Bagetakos, I., Brinks, E., Walter, F., et al. 2011, AJ, 141, 23
- Baker et al. (1977) Baker, J. R., Haslam, C. G. T., Wielebinski, R., & Jones, B. B. 1977, A&A, 59, 261
- Balbus & Hawley (1998) Balbus, S. A. & Hawley, J. F. 1998, Reviews of Modern Physics, 70, 1
- Basu & Roy (2013) Basu, A. & Roy, S. 2013, MNRAS, 433, 1675
- Basu et al. (2012) Basu, A., Roy, S., & Mitra, D. 2012, ApJ, 756, 141
- Bauer et al. (2003) Bauer, F. E., Brandt, W. N., & Lehmer, B. 2003, AJ, 126, 2797
- Beck et al. (2012) Beck, A. M., Lesch, H., Dolag, K., et al. 2012, MNRAS, 422, 2152
- Beck (2007) Beck, R. 2007, A&A, 470, 539
- Beck (2015a) Beck, R. 2015a, in Astrophysics and Space Science Library, Vol. 407, Astrophysics and Space Science Library, ed. A. Lazarian, E. M. de Gouveia Dal Pino, & C. Melioli, 3
- Beck (2015b) Beck, R. 2015b, in Astrophysics and Space Science Library, Vol. 407, Astrophysics and Space Science Library, ed. A. Lazarian, E. M. de Gouveia Dal Pino, & C. Melioli, 507
- Beck et al. (2013) Beck, R., Anderson, J., Heald, G., et al. 2013, Astronomische Nachrichten, 334, 548
- Beck et al. (1998) Beck, R., Berkhuijsen, E. M., & Hoernes, P. 1998, A&AS, 129, 329
- Beck et al. (1996) Beck, R., Brandenburg, A., Moss, D., Shukurov, A., & Sokoloff, D. 1996, ARA&A, 34, 155
- Beck et al. (2005) Beck, R., Fletcher, A., Shukurov, A., et al. 2005, A&A, 444, 739
- Beck & Golla (1988) Beck, R. & Golla, G. 1988, A&A, 191, L9
- Beck & Hoernes (1996) Beck, R. & Hoernes, P. 1996, Nature, 379, 47
- Beck & Krause (2005) Beck, R. & Krause, M. 2005, Astronomische Nachrichten, 326, 414
- Beck et al. (1985) Beck, R., Krause, M., & Klein, U. 1985, A&A, 152, 237
- Beck et al. (1989) Beck, R., Loiseau, N., Hummel, E., et al. 1989, A&A, 222, 58
- Beck et al. (2002) Beck, R., Shoutenkov, V., Ehle, M., et al. 2002, A&A, 391, 83
- Beck et al. (2003) Beck, R., Shukurov, A., Sokoloff, D., & Wielebinski, R. 2003, A&A, 411, 99
- Beck & Wielebinski (2013) Beck, R. & Wielebinski, R. 2013, in Planets, Stars and Stellar Systems. Volume 5: Galactic Structure and Stellar Populations, ed. T. D. Oswalt & G. Gilmore (New York: Springer), 641
- Berkhuijsen et al. (2013) Berkhuijsen, E. M., Beck, R., & Tabatabaei, F. S. 2013, MNRAS, 435, 1598
- Berkhuijsen et al. (1997) Berkhuijsen, E. M., Horellou, C., Krause, M., et al. 1997, A&A, 318, 700
- Boomsma et al. (2008) Boomsma, R., Oosterloo, T. A., Fraternali, F., van der Hulst, J. M., & Sancisi, R. 2008, A&A, 490, 555
- Brandenburg (2014) Brandenburg, A. 2014, ApJ, 791, 12
- Braun et al. (2010) Braun, R., Heald, G., & Beck, R. 2010, A&A, 514, A42
- Bregman et al. (1993) Bregman, J. N., Cox, C. V., & Tomisaka, K. 1993, ApJ, 415, L79
- Buta & McCall (1999) Buta, R. J. & McCall, M. L. 1999, ApJS, 124, 33
- Caldú-Primo et al. (2013) Caldú-Primo, A., Schruba, A., Walter, F., et al. 2013, AJ, 146, 150
- Calzetti et al. (2010) Calzetti, D., Wu, S.-Y., Hong, S., et al. 2010, ApJ, 714, 1256
- Chamandy et al. (2015) Chamandy, L., Shukurov, A., & Subramanian, K. 2015, MNRAS, 446, L6
- Chamandy et al. (2014) Chamandy, L., Subramanian, K., & Quillen, A. 2014, MNRAS, 437, 562
- Chamandy et al. (2013a) Chamandy, L., Subramanian, K., & Shukurov, A. 2013a, MNRAS, 428, 3569
- Chamandy et al. (2013b) Chamandy, L., Subramanian, K., & Shukurov, A. 2013b, MNRAS, 433, 3274
- Condon et al. (1998) Condon, J. J., Cotton, W. D., Greisen, E. W., et al. 1998, AJ, 115, 1693
- Crosthwaite et al. (2000) Crosthwaite, L. P., Turner, J. L., & Ho, P. T. P. 2000, AJ, 119, 1720
- Crosthwaite et al. (2001) Crosthwaite, L. P., Turner, J. L., Hurt, R. L., et al. 2001, AJ, 122, 797
- Dale et al. (2012) Dale, D. A., Aniano, G., Engelbracht, C. W., et al. 2012, ApJ, 745, 95
- Dobbs & Baba (2014) Dobbs, C. & Baba, J. 2014, PASA, 31, 35
- Dobbs & Price (2008) Dobbs, C. L. & Price, D. J. 2008, MNRAS, 383, 497
- Dumke et al. (2000) Dumke, M., Krause, M., & Wielebinski, R. 2000, A&A, 355, 512
- Eckart et al. (1990) Eckart, A., Downes, D., Genzel, R., et al. 1990, ApJ, 348, 434
- Ehle & Beck (1993) Ehle, M. & Beck, R. 1993, A&A, 273, 45
- Ehle et al. (1996) Ehle, M., Beck, R., Haynes, R. F., et al. 1996, A&A, 306, 73
- Elstner et al. (2014) Elstner, D., Beck, R., & Gressel, O. 2014, A&A, 568, A104
- Elstner et al. (1992) Elstner, D., Meinel, R., & Beck, R. 1992, A&AS, 94, 587
- Emerson & Gräve (1988) Emerson, D. T. & Gräve, R. 1988, A&A, 190, 353
- Emerson et al. (1979) Emerson, D. T., Klein, U., & Haslam, C. G. T. 1979, A&A, 76, 92
- Fathi et al. (2007) Fathi, K., Toonen, S., Falcón-Barroso, J., et al. 2007, ApJ, 667, L137
- Fazio et al. (2004) Fazio, G. G., Hora, J. L., Allen, L. E., et al. 2004, ApJS, 154, 10
- Fletcher (2010) Fletcher, A. 2010, in Astronomical Society of the Pacific Conference Series, Vol. 438, Astronomical Society of the Pacific Conference Series, ed. R. Kothes, T. L. Landecker, & A. G. Willis, 197
- Fletcher et al. (2011) Fletcher, A., Beck, R., Shukurov, A., Berkhuijsen, E. M., & Horellou, C. 2011, MNRAS, 412, 2396
- Fletcher et al. (2004) Fletcher, A., Berkhuijsen, E. M., Beck, R., & Shukurov, A. 2004, A&A, 414, 53
- Foglizzo & Tagger (1995) Foglizzo, T. & Tagger, M. 1995, A&A, 301, 293
- Gent et al. (2013) Gent, F. A., Shukurov, A., Sarson, G. R., Fletcher, A., & Mantere, M. J. 2013, MNRAS, 430, L40
- Gießübel & Beck (2014) Gießübel, R. & Beck, R. 2014, A&A, 571, A61
- Gómez & Cox (2002) Gómez, G. C. & Cox, D. P. 2002, ApJ, 580, 235
- Gómez & Cox (2004) Gómez, G. C. & Cox, D. P. 2004, ApJ, 615, 744
- Gräve & Beck (1988) Gräve, R. & Beck, R. 1988, A&A, 192, 66
- Gressel et al. (2008) Gressel, O., Elstner, D., Ziegler, U., & Rüdiger, G. 2008, A&A, 486, L35
- Han et al. (1999) Han, J. L., Beck, R., Ehle, M., Haynes, R. F., & Wielebinski, R. 1999, A&A, 348, 405
- Hanasz et al. (2002) Hanasz, M., Otmianowska-Mazur, K., & Lesch, H. 2002, A&A, 386, 347
- Hanasz et al. (2009) Hanasz, M., Wóltański, D., & Kowalik, K. 2009, ApJ, 706, L155
- Harnett et al. (2004) Harnett, J., Ehle, M., Fletcher, A., et al. 2004, A&A, 421, 571
- Harnett (1987) Harnett, J. I. 1987, MNRAS, 227, 887
- Heesen et al. (2014) Heesen, V., Brinks, E., Leroy, A. K., et al. 2014, AJ, 147, 103
- Helfer et al. (2003) Helfer, T. T., Thornley, M. D., Regan, M. W., et al. 2003, ApJS, 145, 259
- Hernandez et al. (2005) Hernandez, O., Carignan, C., Amram, P., Chemin, L., & Daigle, O. 2005, MNRAS, 360, 1201
- Hoopes et al. (1999) Hoopes, C. G., Walterbos, R. A. M., & Rand, R. J. 1999, ApJ, 522, 669
- Ishizuki et al. (1990) Ishizuki, S., Kawabe, R., Ishiguro, M., Okumura, S. K., & Morita, K.-I. 1990, Nature, 344, 224
- Jarrett et al. (2013) Jarrett, T. H., Masci, F., Tsai, C. W., et al. 2013, AJ, 145, 6
- Jog & Combes (2009) Jog, C. J. & Combes, F. 2009, Phys. Rep, 471, 75
- Karachentsev et al. (2003) Karachentsev, I. D., Sharina, M. E., Dolphin, A. E., & Grebel, E. K. 2003, A&A, 408, 111
- Kim et al. (2002) Kim, W.-T., Ostriker, E. C., & Stone, J. M. 2002, ApJ, 581, 1080
- Kleeorin & Rogachevskii (1990) Kleeorin, N. I. & Rogachevskii, I. V. 1990, in ESA Special Publication, Vol. 311, ESA Special Publication, ed. T. D. Guyenne & J. J. Hunt, 21–23
- Klein & Emerson (1981) Klein, U. & Emerson, D. T. 1981, A&A, 94, 29
- Krause (1987) Krause, M. 1987, Die Magnetfeldstrukturen der Spiralgalaxien M 81 und IC 342, PhD Thesis (Bonn: University of Bonn)
- Krause (1993) Krause, M. 1993, in IAU Symposium, Vol. 157, The Cosmic Dynamo, ed. F. Krause, K. H. Rädler, & G. Rüdiger, 305
- Krause (2014) Krause, M. 2014, ArXiv e-prints
- Krause et al. (1989) Krause, M., Hummel, E., & Beck, R. 1989, A&A, 217, 4
- Kulpa-Dybeł et al. (2011) Kulpa-Dybeł, K., Otmianowska-Mazur, K., Kulesza-Żydzik, B., et al. 2011, ApJ, 733, L18
- Kulsrud (2005) Kulsrud, R. M. 2005, Plasma physics for astrophysics (Princeton: Princeton University Press)
- Lebrón et al. (2011) Lebrón, M., Mangum, J. G., Mauersberger, R., et al. 2011, A&A, 534, A56
- Lou & Fan (2002) Lou, Y.-Q. & Fan, Z. 2002, MNRAS, 329, L62
- Lou et al. (1999) Lou, Y.-Q., Han, J. L., & Fan, Z. 1999, MNRAS, 308, L1
- Mao et al. (2012) Mao, S. A., McClure-Griffiths, N. M., Gaensler, B. M., et al. 2012, ApJ, 759, 25
- McCall (1989) McCall, M. L. 1989, AJ, 97, 1341
- Meidt et al. (2009) Meidt, S. E., Rand, R. J., & Merrifield, M. R. 2009, ApJ, 702, 277
- Meier (2014) Meier, D. S. 2014, in IAU Symposium, Vol. 303, IAU Symposium, ed. L. O. Sjouwerman, C. C. Lang, & J. Ott, 66–68
- Meier & Turner (2005) Meier, D. S. & Turner, J. L. 2005, ApJ, 618, 259
- Mikhailov et al. (2014) Mikhailov, E., Kasparova, A., Moss, D., et al. 2014, A&A, 568, A66
- Moss (1998) Moss, D. 1998, MNRAS, 297, 860
- Moss et al. (2013) Moss, D., Beck, R., Sokoloff, D., et al. 2013, A&A, 556, A147
- Moss et al. (1998) Moss, D., Shukurov, A., & Sokoloff, D. 1998, Geophysical and Astrophysical Fluid Dynamics, 89, 285
- Moss et al. (2014) Moss, D., Sokoloff, D., Beck, R., & Krause, M. 2014, A&A, 566, A40
- Moss et al. (2012) Moss, D., Stepanov, R., Arshakian, T. G., et al. 2012, A&A, 537, A68
- Mulcahy et al. (2014) Mulcahy, D. D., Horneffer, A., Beck, R., et al. 2014, A&A, 568, A74
- Murphy et al. (2008) Murphy, E. J., Helou, G., Kenney, J. D. P., Armus, L., & Braun, R. 2008, ApJ, 678, 828
- Newton (1980a) Newton, K. 1980a, MNRAS, 191, 169
- Newton (1980b) Newton, K. 1980b, MNRAS, 191, 615
- Niklas & Beck (1997) Niklas, S. & Beck, R. 1997, A&A, 320, 54
- Oppermann et al. (2012) Oppermann, N., Junklewitz, H., Robbers, G., et al. 2012, A&A, 542, A93
- Otmianowska-Mazur et al. (2002) Otmianowska-Mazur, K., Elstner, D., Soida, M., & Urbanik, M. 2002, A&A, 384, 48
- Pakmor et al. (2014) Pakmor, R., Marinacci, F., & Springel, V. 2014, ApJ, 783, L20
- Pakmor & Springel (2013) Pakmor, R. & Springel, V. 2013, MNRAS, 432, 176
- Patrikeev et al. (2006) Patrikeev, I., Fletcher, A., Stepanov, R., et al. 2006, A&A, 458, 441
- Poedts & Rogava (2002) Poedts, S. & Rogava, A. D. 2002, A&A, 385, 32
- Rohde et al. (1999) Rohde, R., Beck, R., & Elstner, D. 1999, A&A, 350, 423
- Ruiz-Granados et al. (2010) Ruiz-Granados, B., Rubiño-Martín, J. A., Florido, E., & Battaner, E. 2010, ApJ, 723, L44
- Ruzmaikin et al. (1988) Ruzmaikin, A. A., Sokolov, D. D., & Shukurov, A. M., eds. 1988, Astrophysics and Space Science Library, Vol. 133, Magnetic fields of galaxies
- Saha et al. (2002) Saha, A., Claver, J., & Hoessel, J. G. 2002, AJ, 124, 839
- Schinnerer et al. (2008) Schinnerer, E., Böker, T., Meier, D. S., & Calzetti, D. 2008, ApJ, 684, L21
- Schleicher & Beck (2013) Schleicher, D. R. G. & Beck, R. 2013, A&A, 556, A142
- Schulz et al. (2001) Schulz, A., Güsten, R., Köster, B., & Krause, D. 2001, A&A, 371, 25
- Sellwood (2011) Sellwood, J. A. 2011, MNRAS, 410, 1637
- Shalchi (2009) Shalchi, A., ed. 2009, Astrophysics and Space Science Library, Vol. 362, Nonlinear Cosmic Ray Diffusion Theories
- Shapovalov & Vishniac (2011) Shapovalov, D. S. & Vishniac, E. T. 2011, ApJ, 738, 66
- Shibata & Matsumoto (1991) Shibata, K. & Matsumoto, R. 1991, Nature, 353, 633
- Shukurov (1998) Shukurov, A. 1998, MNRAS, 299, L21
- Shukurov (2005) Shukurov, A. 2005, in Lecture Notes in Physics, Berlin Springer Verlag, Vol. 664, Cosmic Magnetic Fields, ed. R. Wielebinski & R. Beck, 113
- Shukurov et al. (2006) Shukurov, A., Sokoloff, D., Subramanian, K., & Brandenburg, A. 2006, A&A, 448, L33
- Sokoloff et al. (1992) Sokoloff, D., Shukurov, A., & Krause, M. 1992, A&A, 264, 396
- Sokoloff et al. (1998) Sokoloff, D. D., Bykov, A. A., Shukurov, A., et al. 1998, MNRAS, 299, 189
- Stepanov et al. (2008) Stepanov, R., Arshakian, T. G., Beck, R., Frick, P., & Krause, M. 2008, A&A, 480, 45
- Stepanov et al. (2014) Stepanov, R., Shukurov, A., Fletcher, A., et al. 2014, MNRAS, 437, 2201
- Sur et al. (2007) Sur, S., Shukurov, A., & Subramanian, K. 2007, MNRAS, 377, 874
- Tabatabaei et al. (2007a) Tabatabaei, F. S., Beck, R., Krügel, E., et al. 2007a, A&A, 475, 133
- Tabatabaei et al. (2013a) Tabatabaei, F. S., Berkhuijsen, E. M., Frick, P., Beck, R., & Schinnerer, E. 2013a, A&A, 557, A129
- Tabatabaei et al. (2007b) Tabatabaei, F. S., Krause, M., & Beck, R. 2007b, A&A, 472, 785
- Tabatabaei et al. (2008) Tabatabaei, F. S., Krause, M., Fletcher, A., & Beck, R. 2008, A&A, 490, 1005
- Tabatabaei et al. (2013b) Tabatabaei, F. S., Schinnerer, E., Murphy, E. J., et al. 2013b, A&A, 552, A19
- Tamburro et al. (2009) Tamburro, D., Rix, H.-W., Leroy, A. K., et al. 2009, AJ, 137, 4424
- Taylor et al. (2009) Taylor, A. R., Stil, J. M., & Sunstrum, C. 2009, ApJ, 702, 1230
- Tikhonov & Galazutdinova (2010) Tikhonov, N. A. & Galazutdinova, O. A. 2010, Astronomy Letters, 36, 167
- Turner & Ho (1983) Turner, J. L. & Ho, P. T. P. 1983, ApJ, 268, L79
- Van Eck et al. (2015) Van Eck, C. L., Brown, J. C., Shukurov, A., & Fletcher, A. 2015, ApJ, 799, 35
- Vollmer et al. (2013) Vollmer, B., Soida, M., Beck, R., et al. 2013, A&A, 553, A116
- Wada et al. (2011) Wada, K., Baba, J., & Saitoh, T. R. 2011, ApJ, 735, 1
- Walsh et al. (2002) Walsh, W., Beck, R., Thuma, G., et al. 2002, A&A, 388, 7
- White & Bothun (2003) White, P. M. & Bothun, G. 2003, PASP, 115, 1135
- Wright et al. (2010) Wright, E. L., Eisenhardt, P. R. M., Mainzer, A. K., et al. 2010, AJ, 140, 1868
- Yoast-Hull et al. (2013) Yoast-Hull, T. M., Everett, J. E., Gallagher, III, J. S., & Zweibel, E. G. 2013, ApJ, 768, 53
- Young et al. (1996) Young, J. S., Allen, L., Kenney, J. D. P., Lesser, A., & Rownd, B. 1996, AJ, 112, 1903