11email: romano@ifc.inaf.it 22institutetext: ISDC Data Center for Astrophysics, Université de Genève, 16 chemin d’Écogia, 1290 Versoix, Switzerland 33institutetext: Department of Astronomy and Astrophysics, Pennsylvania State University, University Park, PA 16802, USA 44institutetext: INAF, Istituto di Astrofisica Spaziale e Fisica Cosmica - Milano, Via E. Bassini 15, I-20133 Milano, Italy 55institutetext: Harvard–Smithsonian Center for Astrophysics, 60 Garden Street, Cambridge, MA 02138, USA 66institutetext: INAF, Osservatorio Astronomico di Roma, Via Frascati 33, I-00040, Monte Porzio Catone, Italy 77institutetext: Istituto Universitario di Studi Superiori, Piazza della Vittoria 15, I-27100 Pavia, Italy 88institutetext: INFN, Sezione di Pavia, via A. Bassi 6, I-27100 Pavia, Italy 99institutetext: INAF, Osservatorio Astronomico di Brera, Via E. Bianchi 46, I-23807 Merate, Italy 1010institutetext: Institut für Astronomie und Astrophysik, Eberhard Karls Universität, Sand 1, 72076 Tübingen, Germany
Giant outburst from the supergiant fast X-ray transient IGR J175442619: accretion from a transient disc?††thanks: Tables 1–2, and Fig. 2 are available in electronic form at the CDS via anonymous ftp to cdsarc.u-strasbg.fr (130.79.128.5) or via http://cdsweb.u-strasbg.fr/cgi-bin/qcat?J/A+A/vol/page
Supergiant fast X-ray transients (SFXTs) are high mass X-ray binaries associated with OB supergiant companions and characterised by an X-ray flaring behaviour whose dynamical range reaches 5 orders of magnitude on timescales of a few hundred to thousands of seconds. Current investigations concentrate on finding possible mechanisms to inhibit accretion in SFXTs and explain their unusually low average X-ray luminosity. We present the Swift observations of an exceptionally bright outburst displayed by the SFXT IGR J175442619 on 2014 October 10 when the source achieved a peak luminosity of erg s-1. This extends the total source dynamic range to 106, the largest (by a factor of 10) recorded so far from an SFXT. Tentative evidence for pulsations at a period of s is also reported. We show that these observations challenge, for the first time, the maximum theoretical luminosity achievable by an SFXT and propose that this giant outburst was due to the formation of a transient accretion disc around the compact object.
Key Words.:
X-rays: binaries – X-rays: individual: IGR J175442619 – accretion – accretion discs1 Introduction
Supergiant fast X-ray transients (SFXTs) are high mass X-ray binaries (HMXBs) hosting a neutron star (NS) and an OB supergiant companion (Sguera et al., 2005; Negueruela et al., 2006) which display X-ray flares reaching, for a few hours, 1036–1037 erg s-1 (see Romano et al., 2014c, for a recent review). This is at odds with normal supergiant HMXBs displaying a fairly constant average luminosity with typical variations by a factor of 10–50 on time scales of few hundred to thousands of seconds. SFXTs are also significantly sub-luminous with respect to classical Sg-HMXBs like Vela X-1 (Bozzo et al., 2015), and show a dynamical range up to 5 orders of magnitude, as their luminosities can be as low as erg s-1 during quiescence (e.g. in’t Zand, 2005; Bozzo et al., 2010).
The transient IGR~J17544$-$2619 (Sunyaev et al., 2003) is one of the SFXT prototypes, in which a NS is orbiting every 4.9260.001 d (Clark et al., 2009) an O9Ib star located at 3.6 kpc (Pellizza et al., 2006; Rahoui et al., 2008). It has been showing large flux swings since its discovery (in’t Zand et al., 2004; in’t Zand, 2005; Rampy et al., 2009; Romano et al., 2014c), with the brightest flux recorded by Swift/XRT (Burrows et al., 2005) during the 2013 June 28 outburst (Romano et al., 2013a) at erg cm-2 s-1 (0.3–10 keV, unabsorbed) corresponding to erg s-1. These properties were initially interpreted in terms of accretion onto the NS from a “clumpy wind” (in’t Zand, 2005). However, as discussed in Bozzo et al. (2013), we now know that the X-ray variability of SFXTs cannot be easily reconciled with a simple extreme clumpy wind model. Alternatives have been proposed to explain the large X-ray luminosity swings, invoking either the presence of magnetic/centrifugal barriers (Grebenev & Sunyaev, 2007; Bozzo et al., 2008) or a subsonic settling accretion regime (Shakura et al., 2014). A recent NuSTAR observation (Bhalerao et al., 2015), revealed in IGR J175442619 a cyclotron line at 17 keV, yielding the first measurement of the magnetic field in an SFXT at G, as typical of accreting NS in HMXBs.
In this Letter, we present the extraordinary set of observations collected by Swift during the 2014 October 10 outburst of IGR J175442619 (Sect. 2), during which the source reached an unabsorbed mean flux of erg cm-2 s-1 (0.3–10 keV; Sect. 3.1) thus exceeding all preceding records by a factor of 10. During this event evidence for a transient pulsation at s (Sect. 3.2) and an expanding X-ray halo around the source were found in the XRT data.
2 Observations and data reduction
IGR J175442619 triggered Swift/BAT (Barthelmy et al., 2005) on 2014 October 10 at 15:04:19 UT (image trigger=614903, Romano et al., 2014b). Swift immediately slewed to the target, so that the narrow-field instruments started observing at 132 s. The automated target (AT, sequence 00614903000) ran for four orbits, until ks). Follow-up target of opportunity observations were obtained (sequences 00035056161–166). The data cover the first 5 d after the beginning of the outburst, with 6 Swift observations for a net XRT exposure of ks (see Table 1). Based on the most recent outburst ephemeris for this source ( d, periastron at MJD ; Smith, 2014), the outburst started at phase .
The data were processed and analysed using the standard software (FTOOLS v6.16), calibration (CALDB 20140709), and methods. Background-subtracted BAT light curves were created in the standard energy bands and mask-weighted spectra were extracted during the first orbit of data. The XRT data were processed and filtered with xrtpipeline (v0.13.1). Pileup was corrected for (ObsID 00614903000 only) by adopting standard procedures (Romano et al., 2006; Vaughan et al., 2006): source events were extracted from annuli (inner/outer radii of 4/20 pix for WT, 5/30 pix for PC; 1 pixel ′′). Light curves were corrected for point spread function losses, vignetting and background subtracted. For our spectral analysis, we extracted events in the same regions as those adopted for the light curve creation and only considered grade 0 events for WT data. For our timing analysis, performed on the grade 0–2 WT events, we also converted the event arrival times to the Solar system barycentre with barycorr. Archival XRT data were also considered and similarly processed, from the following bright outbursts: 2011-03-24 (Farinelli et al., 2012, ), 2013-06-28 (Romano et al., 2013a, ); 2013-09-11 (Romano et al., 2013b, ); 2014-05-25 (Romano et al., 2014a, ).
3 Analysis and results
3.1 A giant outburst?
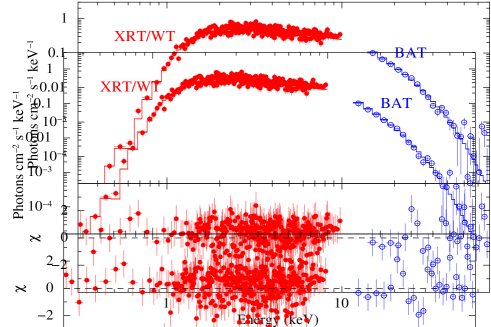
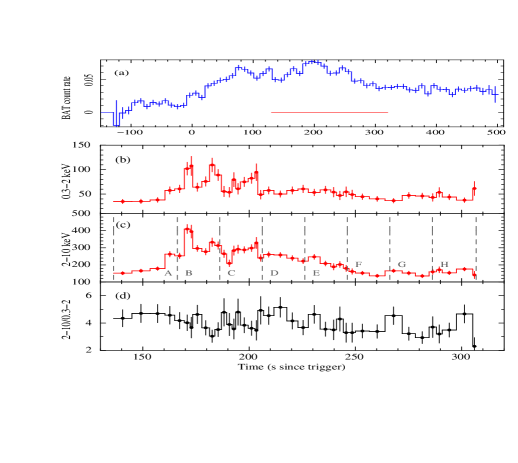
Figure 1 shows the Swift BAT and XRT light curves of the first orbit of data (before the first Earth occultation). While no spectral variations could be detected in the BAT data, the XRT data show variations in the hardness ratio. To investigate their nature, we extracted simultaneous XRT and BAT spectra in 8 time intervals (marked with A, .. , H in Fig. 1c), as well as in the total (Orb 1, see Fig. 2), and fit them in the 0.3–10 keV and 14–70 keV bands, respectively (see Table 2), with an absorbed power law with a high energy cut-off (phabs*power*highecut in XSPEC). Even this simple spectral model does not allow us to firmly establish if variations of the absorption or intrinsic emission have a leading role in the hardness ratio modulation.
The 2014 October 10 outburst exceeded all preceding records. The XRT light curve reached 668 counts s-1 when binned at a signal-to-noise ratio , which converts to a peak flux of erg cm-2 s-1 (0.3–10 keV, unabsorbed, 2.1 Crab), or erg s-1, when considering a count rate to flux conversion factor ( erg cm-2 count-1) derived from the strictly simultaneous XRTBAT spectra during interval B (Table 2).
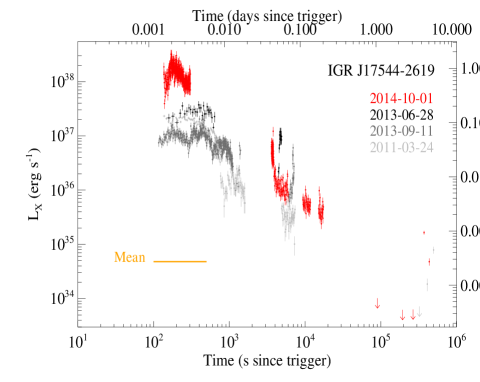
Figure 3 shows the bolometric X-ray luminosity light curve of the 2014-10-10 outburst (red) compared to the brightest ones recorded by Swift for this source. The right-hand side y-axis is the standard Eddington luminosity for spherical accretion of fully ionized hydrogen for a 1.4 M⊙ NS according to erg s-1 (Basko & Sunyaev, 1975, we neglected any effect on the Eddington luminosity due to the high NS magnetic field as this is not relevant for our conclusions, see Sect. 4). We also mark the out-of-outburst average count rate obtained during the two-year monitoring with Swift/XRT (Romano et al., 2011), counts s-1, implying an average flux of erg cm-2 s-1 (0.3–10 keV, unabsorbed) and bolometric luminosity of erg s-1.
3.2 Pulsations
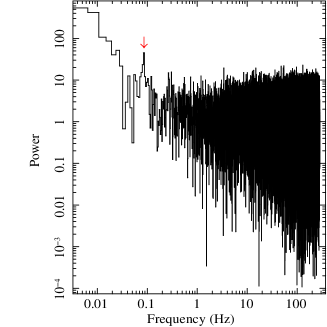
For the timing analysis, we concentrated on the WT mode (time resolution: 1.78 ms) XRT data of the first orbit, since this segment is an uninterrupted stretch of data and contains most of the counts (more than 50 % of the total). In the Fourier transform of the data, a peak () arises around 0.086 Hz (12 s, see Fig. 4, left). The period of this candidate modulation, as measured by a test, is s. We estimated for this timing feature a quality factor (van der Klis, 2000), of . Although this would be comparable to the typical quality factors of quasi-periodic oscillations (QPOs, see, e.g., van der Klis, 2006, and references therein), the low Fourier resolution for frequencies around 0.1 Hz (see Fig. 4, left) would not allow us to distinguish the case of a QPO from that of a coherent pulsation. Given the apparent modulation of the source lightcurve at a period similar to the peak of the timing feature, we tentatively ascribe the latter to the pulsation of the NS hosted in IGR J175442619. The corresponding pulse profile is sinusoidal (Fig. 4, right), with an RMS pulsed fraction of (or if the pulsed fraction is derived using a sinusoidal fit). This feature cannot be tracked down in the following WT or PC data and is embedded in a noisy spectrum, making it difficult to evaluate its significance.

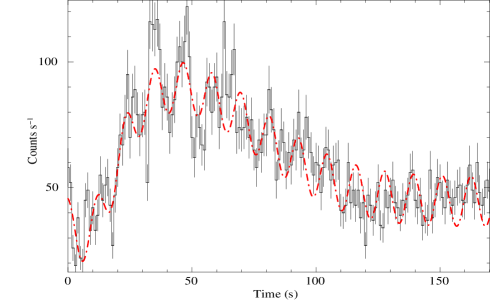
We carefully inspected the light curve to check if the 12-s signal is due to a modulation present along the whole dataset or, given the relatively short exposure, it is due to the occurrence of one or few burst-like events. As shown in Fig. 5, the light curve is characterised by strong aperiodic variability (which is the source of the red noise in the Fourier power spectrum) and by a number of superimposed peaks and dips, which are almost equidistant from each other, separated by about 11–12 s (the origin of the signal). These features are present during the greatest part of, but not all, the first orbit data. To evaluate the significance of the 12-s modulation, we fit the light curve with a model consisting of a constant plus two Gaussians (centred at about 8 and 40 s; the one at 8 s has a negative normalisation to account for the large dip around 5 s) for the continuum, and added a sinusoidal component to account for the modulation. All parameters were left free to vary, and we obtained a value of s (1) for the modulation period. We applied the F-test to assess the need for including the additional sinusoidal component. We found that the probability that the inclusion is significant is of 99.984%, corresponding to a detection at about 4 confidence level single-trial (period).
We also searched for pulsations in the data of the previous bright outbursts that afforded long observations and good counting statistics (2011-03-24, 2013-06-28, 2013-09-11, 2014-05-25) but no significant signal was found either around 0.086 Hz or at different frequencies. In all cases we obtained 3 upper limits on the source pulse fraction of 10% for a coherent signal in the range of 0.005–20 s.
4 Discussion and conclusions
In the past few years SFXTs, and IGR J175442619 in particular with its uniquely high dynamic range now reaching 106, have been challenging our understanding of wind accretion onto NSs. In all models proposed so far to interpret the peculiar behaviour of these sources in X-rays, a particular effort was dedicated to finding a mechanism to inhibit accretion and provide a reliable explanation for their unusually low averaged X-ray luminosity compared to classical systems. While different inhibition mechanisms could be considered to explain luminosities as low as 1032 erg s-1, in all cases it has been assumed that the maximum achievable luminosity is that corresponding to the so-called “direct-accretion regime”, where all inhibiting mechanisms are overcome and the Bondi-Hoyle accretion rate sets in (see e.g., Shakura et al., 2012, for a recent review). As we show below, the peak X-ray luminosity of IGR J175442619 during the exceptional outburst reported in this paper reached the standard Eddington limit expected for a NS of 1.4 and challenged for the first time the maximum (rather than the minimum) theoretical luminosity expected for an SFXT.
In the classical model of wind accretion, the maximum NS accretion rate is regulated by the accretion radius, , where is the NS mass and =+. In the latter expression, is the NS orbital velocity at a separation from its companion and is the companion wind velocity at the NS location and time . The rate at which the wind material is captured and accreted by the NS is thus given by = (where is the wind density), and the correspondingly released X-ray luminosity can be estimated as =/. Assuming the simplest case of a spherically symmetric wind and neglecting the NS orbital velocity, the wind density can be expressed at any time by =/(4), where is the wind mass loss rate. The Bondi-Hoyle mass accretion rate can be expressed as,
| (1) |
where , . In Eq. 1 we assumed a circular orbit to express the separation as a function of the total mass () and the orbital period () of the system: =2.710, where is the orbital period in units of 5 d and is the total mass of the system in units of 30 , chosen to qualitatively match the characteristic values of IGR J175442619 (see Sect. 1).
Equation (1) shows that the peak luminosity achieved by IGR J175442619 during the 2014-10-10 outburst can only be explained by assuming a very low wind velocity () or an unlikely high mass loss rate from the star111The typical velocity of the wind from an O-B supergiant can be as high as 1– cm s-1, and the mass loss rate is usually comprised to within the range 10-7–10-5 yr-1 (see, e.g., Puls et al., 2008, for a recent review). (10 yr-1). Considering the first hypothesis, it is known that the photoionization of the wind material by the X-rays emitted from the NS can lead to a substantial reduction of the stellar wind velocity, especially in bright HMXBs endowed with short orbital periods and eccentric orbits (see, e.g., Watanabe et al., 2006; Ducci et al., 2010, and references therein). orbital period of IGR J175442619 could be sufficiently short and the orbit eccentric enough (Nikolaeva et al., 2013) to allow a substantial ionization of the wind material and lead to wind velocities as low as the values indicated above (at least during the brightest outbursts when the X-ray emission is more intense). If this is the case, it is difficult to avoid the formation of a temporary accretion disc around the NS in IGR J175442619, as a disc is expected to be already in place for wind velocities 5107 cm s-1 (see discussion in Ducci et al., 2010). Fryxell et al. (1988) suggested that instabilities of inhomogeneous slow winds in HMXBs could lead not only to the rapid formation of accretion discs, but also to their quick dissipation (e.g., EXO 2030+375, Taam et al., 1988). On one hand, accretion from a disc could already provide larger mass accretion rates than those typical of wind-fed binaries. On the other hand, their dissipation was shown to produce sudden increases in the mass accretion rates and the appearance of bright X-ray flares (by a factor of 10). The typical duration of these flares is , thus compatible with the observational properties of the super-outburst from IGR J175442619 (assuming the values mentioned above for ). Additional simulations presented by Taam & Fryxell (1988) also showed that a more erratic or periodic behavior of the flares can be obtained by assuming different properties of (poorly known) density and velocity asymmetry of the accretion flow. The presence of short-lived accretion discs in SFXTs (and other NS HMXBs in general) could be tested observationally through the detection of rapid spin-up phases (Klochkov et al., 2011; Jenke et al., 2012). However, IGR J175442619 did not display convincing evidence of pulsations in the past (see Sect. 1) and we could only reveal a marginally significant pulsed signal at s during the peak of the event reported in this paper. No meaningful searches for spin period derivatives can thus be carried out.
We cannot currently rule out alternative explanations for the exceptionally bright outburst of IGR J175442619 recorded by Swift. A viable mechanism to overcome the difficulties in the standard Bondi-Hoyle accretion scenario is that of the “ingestion of a massive clump” (Bozzo et al., 2011). In this case, it is assumed that the bright outburst was due to a dense structure in the wind of the supergiant star being accreted onto the compact object. The equation relating the density and the mass loss rate from the supergiant introduced above is no longer valid, as massive structures are created by definition in asymmetric winds. A sufficiently high increase in the density of the accreting material (together with a possible decrease in the corresponding velocity) could thus be invoked to achieve sufficiently high without implying an enhanced . Even though current multi-dimensional simulations of winds from massive stars do not favour the formation of large and very dense clumps (see the discussion in Bozzo et al., 2015, and references therein), at least in the case of IGR J184100535 X-ray observations revealed some evidence for the ingestion of a dense structure onto the NS (Bozzo et al., 2011). The spectroscopic analysis of the outburst from IGR J175442619 did not reveal any change in the source spectral properties that could favour such a hypothesis. While it could still be assumed that this is due to projection effects between the velocity vector of the clump and the observed line of sight, we consider in the present case this explanation unlikely.
The detection of other bright outbursts from the SFXTs with Swift and, in the future, with the next generation of X-ray facilities providing fine X-ray spectroscopy on still unexplored short time scales (e.g, the LOFT/LAD; Feroci et al., 2014; Orlandini et al., 2015), will help clarify the origin of these events.
Acknowledgements.
We wholeheartedly thank the Swift team duty scientists and science planners for their courteous efficiency, and S.D. Barthelmy, D.N. Burrows, and N. Gehrels. We thank S.E. Motta, L. Stella, A. Beardmore, M. Capalbi, and S. Vercellone for useful discussions. We also thank our referee for swift comments that helped improve the paper. PR and SC acknowledge contract ASI-INAF I/004/11/0. PE acknowledges a Fulbright Research Scholar grant administered by the U.S.–Italy Fulbright Commission and is grateful to the Harvard–Smithsonian Center for Astrophysics for hosting him during his Fulbright exchange. LD thanks Deutsches Zentrum für Luft und Raumfahrt (Grant FKZ 50 OG 1301).References
- Barthelmy et al. (2005) Barthelmy, S. D., Barbier, L. M., Cummings, J. R., et al. 2005, SSRv, 120, 143
- Basko & Sunyaev (1975) Basko, M. M. & Sunyaev, R. A. 1975, A&A, 42, 311
- Bhalerao et al. (2015) Bhalerao, V., Romano, P., Tomsick, J., et al. 2015, MNRAS, 447, 2274
- Bozzo et al. (2008) Bozzo, E., Falanga, M., & Stella, L. 2008, ApJ, 683, 1031
- Bozzo et al. (2011) Bozzo, E., Giunta, A., Cusumano, G., et al. 2011, A&A, 531, A130
- Bozzo et al. (2015) Bozzo, E., Romano, P., Ducci, L., et al. 2015, AdSpR, 55, 1255
- Bozzo et al. (2013) Bozzo, E., Romano, P., Ferrigno, C., et al. 2013, AdSpR, 51, 1593
- Bozzo et al. (2010) Bozzo, E., Stella, L., Ferrigno, C., et al. 2010, A&A, 519, A6
- Burrows et al. (2005) Burrows, D. N., Hill, J. E., Nousek, J. A., et al. 2005, SSRv, 120, 165
- Clark et al. (2009) Clark, D. J., Hill, A. B., Bird, A. J., et al. 2009, MNRAS, 399, L113
- Drave et al. (2014) Drave, S. P., Bird, A. J., Sidoli, L., et al. 2014, MNRAS, 439, 2175
- Ducci et al. (2010) Ducci, L., Sidoli, L., & Paizis, A. 2010, MNRAS, 408, 1540
- Farinelli et al. (2012) Farinelli, R., Romano, P., Mangano, V., et al. 2012, MNRAS, 424, 2854
- Feroci et al. (2014) Feroci, M., den Herder, J. W., Bozzo, E., et al. 2014, in SPIE Conf. Ser., 9144, 2
- Fryxell et al. (1988) Fryxell, B. A. & Taam, R. E. 1988, ApJ, 335, 862
- Grebenev & Sunyaev (2007) Grebenev, S. A. & Sunyaev, R. A. 2007, Astronomy Letters, 33, 149
- in’t Zand et al. (2004) in’t Zand, J., Heise, J., Ubertini, P., Bazzano, A., & Markwardt, C. 2004, ESA Special Publication, 552, 427
- Jenke et al. (2012) Jenke, P., Finger, M. H., Wilson-Hodge, et al. 2012, ApJ, 759, 124
- in’t Zand (2005) in’t Zand, J. J. M. 2005, A&A, 441, L1
- Klochkov et al. (2011) Klochkov, D., Ferrigno, C., Santangelo, A., et al. 2011, A&A, 536, L8
- Negueruela et al. (2006) Negueruela, I., Smith, D. M., Harrison, T. E., et al. & Torrejón, J. M. 2006, ApJ, 638, 982
- Nikolaeva et al. (2013) Nikolaeva, E. A., Bikmaev, I. F., Melnikov, S. S., et al. 2013, BCAO, 109, 27
- Orlandini et al. (2015) Orlandini, M., Doroshenko, V., Zampieri, L., et al. 2015, ArXiv:1501.02777
- Pellizza et al. (2006) Pellizza, L. J., Chaty, S., & Negueruela, I. 2006, A&A, 455, 653
- Puls et al. (2008) Puls, J., Vink, J. S., & Najarro, F. 2008, A&A Rev., 16, 209
- Rahoui et al. (2008) Rahoui, F., Chaty, S., Lagage, P.-O., & Pantin, E. 2008, A&A, 484, 801
- Rampy et al. (2009) Rampy, R. A., Smith, D. M., & Negueruela, I. 2009, ApJ, 707, 243
- Romano et al. (2014a) Romano, P., Barthelmy, S. D., Lien, A. Y., et al. 2014a, ATel, 6173, 1
- Romano et al. (2014b) Romano, P., Barthelmy, S. D., Mangano, V., et al. 2014b, ATel, 6566, 1
- Romano et al. (2006) Romano, P., Campana, S., Chincarini, G., et al. 2006, A&A, 456, 917
- Romano et al. (2013a) Romano, P., Evans, P. A., Kennea, J. A., et al. 2013a, ATel, 5179, 1
- Romano et al. (2014c) Romano, P., Krimm, H. A., Palmer, D. M., et al. 2014c, A&A, 562, A2
- Romano et al. (2011) Romano, P., La Parola, V., Vercellone, S., et al. 2011, MNRAS, 410, 1825
- Romano et al. (2013b) Romano, P., Markwardt, C. B., Chester, M. M., et al. 2013b, ATel, 5388, 1
- Sguera et al. (2005) Sguera, V., Barlow, E. J., Bird, A. J., et al. 2005, A&A, 444, 221
- Shakura et al. (2012) Shakura, N., Postnov, K., Kochetkova, A., et al. 2012, MNRAS, 420, 216
- Shakura et al. (2014) Shakura, N., Postnov, K., Sidoli, L., & Paizis, A. 2014, MNRAS, 442, 2325
- Smith (2014) Smith, D. M. 2014, ATel, 6227, 1
- Stella et al. (1986) Stella, L., White, N. E., & Rosner, R. 1986, ApJ, 308, 669
- Sunyaev et al. (2003) Sunyaev, R. A., Grebenev, S. A., Lutovinov, A. A., et al. 2003, ATel, 190, 1
- Taam et al. (1988) Taam, R. E., Brown, D. A., & Fryxell, B. A. 1988, ApJL, 331, L117
- Taam & Fryxell (1988) Taam, R. E. & Fryxell, B. A. 1988, ApJL, 327, L73
- van der Klis (2000) van der Klis, M. 2000, ARA&A, 38, 717
- van der Klis (2006) van der Klis, M. 2006, AdSpR, 38, 2675
- Vaughan et al. (2006) Vaughan, S., Goad, M. R., Beardmore, A. P., et al. 2006, ApJ, 638, 920
- Watanabe et al. (2006) Watanabe, S., Sako, M., Ishida, M., et al. 2006, ApJ, 651, 421
| Sequence | Obs/Mode | Start time | End time (UT) | Expo. |
|---|---|---|---|---|
| (UT) | (UT) | (s) | ||
| 00614903000 | BAT/evt | 2014-10-10 15:00:30 | 2014-10-10 20:00:06 | 1648 |
| 00614903000 | XRT/WT | 2014-10-10 15:06:45 | 2014-10-10 19:15:26 | 420 |
| 00614903000 | XRT/PC | 2014-10-10 16:08:27 | 2014-10-10 19:56:22 | 7173 |
| 00035056161 | XRT/PC | 2014-10-11 16:02:14 | 2014-10-11 16:18:45 | 973 |
| 00035056162 | XRT/PC | 2014-10-12 20:49:24 | 2014-10-12 21:05:51 | 978 |
| 00035056163 | XRT/PC | 2014-10-13 16:29:14 | 2014-10-13 17:40:37 | 960 |
| 00035056165 | XRT/PC | 2014-10-14 22:26:08 | 2014-10-14 22:41:54 | 925 |
| 00035056166 | XRT/PC | 2014-10-15 16:07:04 | 2014-10-15 16:24:55 | 1071 |
| 00449907000a | XRT/WT | 2011-03-24 01:59:15 | 2011-03-24 03:18:22 | 657 |
| 00449907000a | XRT/PC | 2011-03-24 02:10:07 | 2011-03-24 04:01:03 | 3360 |
| 00035056150a | XRT/PC | 2011-03-27 19:54:23 | 2011-03-27 20:11:56 | 1046 |
| 00035056151a | XRT/PC | 2011-03-28 20:10:36 | 2011-03-28 20:21:58 | 662 |
| 00035056152a | XRT/PC | 2011-03-29 20:15:13 | 2011-03-29 20:23:57 | 504 |
| 00559221000 | XRT/PC | 2013-06-28 07:28:56 | 2013-06-28 08:48:24 | 1010 |
| 00570402000 | XRT/WT | 2013-09-11 16:01:52 | 2013-09-11 17:40:54 | 1024 |
| 00570402000 | XRT/PC | 2013-09-11 16:18:49 | 2013-09-11 17:59:42 | 1394 |
| 00599954000 | XRT/WT | 2014-05-25 22:33:22 | 2014-05-25 22:34:31 | 47 |
| 00599955000 | XRT/WT | 2014-05-25 22:34:54 | 2014-05-25 22:55:55 | 1235 |
| 00035056156 | XRT/PC | 2014-05-26 19:03:35 | 2014-05-26 19:20:05 | 978 |
| 00035056157 | XRT/PC | 2014-05-27 16:15:36 | 2014-05-27 16:30:56 | 920 |
| 00035056158 | XRT/PC | 2014-05-30 16:16:27 | 2014-05-30 22:38:53 | 1241 |
| 00035056159 | XRT/PC | 2014-05-31 19:11:56 | 2014-05-31 21:00:54 | 1168 |
| 00035056160 | XRT/PC | 2014-06-01 09:27:33 | 2014-06-01 21:09:54 | 1133 |
-
a
See (Farinelli et al. 2012).
| Spectruma𝑎aa𝑎aDefined in Sect. 3.1, see Fig. 1c. | Time | Fluxb𝑏bb𝑏bAverage unabsorbed 0.3–10 keV fluxes in units of 10-8 erg cm-2 s-1. | Luminosityc𝑐cc𝑐cBolometric luminosity in units of 1037 erg s-1. | /dof | ||||
|---|---|---|---|---|---|---|---|---|
| (s since ) | ( cm-2) | (keV) | (keV) | ( erg cm-2 s-1) | ( erg s-1) | |||
| (0.3–10 keV) | (0.01–1000 keV) | |||||||
| Orb 1 | 136.2–306.8 | |||||||
| A | 136.2–166.2 | |||||||
| B | 166.2–186.2 | |||||||
| Peakd𝑑dd𝑑dThe peak luminosity, calculated by converting peak count rate of 668 counts s-1 by using the spectral parameters of spectrum B. | 169.6–172.8 | – | – | – | – | – | ||
| C | 186.2–206.2 | |||||||
| D | 206.2–226.2 | |||||||
| E | 226.2–246.2 | |||||||
| F | 246.2–266.2 | |||||||
| G | 266.2–286.2 | |||||||
| H | 286.2–306.8 |