11email: gianfranco.gentile@ugent.be 22institutetext: Department of Physics and Astrophysics, Vrije Universiteit Brussel, Pleinlaan 2, 1050 Brussels, Belgium 33institutetext: Department of Solid State Sciences, Krijgslaan 281, B-9000 Ghent, Belgium 44institutetext: Netherlands Institute for Radio Astronomy (ASTRON), Postbus 2, 7990 AA Dwingeloo, the Netherlands 55institutetext: Astrophysics, Cosmology and Gravity Centre, Department of Astronomy, University of Cape Town, Private Bag X3, Rondebosch 7701, South Africa 66institutetext: Kapteyn Astronomical Institute, University of Groningen, PO Box 800, 9700 AV Groningen, the Netherlands
Disk mass and disk heating in the spiral galaxy NGC 3223††thanks: Based on observations collected at the European Southern Observatory, Chile, under proposal 68.B-0588.
We present the stellar and gaseous kinematics of an Sb galaxy, NGC 3223, with the aim of determining the vertical and radial stellar velocity dispersion as a function of radius, which can help to constrain disk heating theories. Together with the observed NIR photometry, the vertical velocity dispersion is also used to determine the stellar mass-to-light (M/L) ratio, typically one of the largest uncertainties when deriving the dark matter distribution from the observed rotation curve. We find a vertical-to-radial velocity dispersion ratio of , significantly higher than expectations from known correlations, and a weakly-constrained Ks-band stellar M/L ratio in the range 0.5–1.7, at the high end of (but consistent with) the predictions of stellar population synthesis models. Such a weak constraint on the stellar M/L ratio, however, does not allow us to securely determine the dark matter density distribution. To achieve this, either a statistical approach or additional data (e.g. integral-field unit) are needed.
Key Words.:
Galaxies: kinematics and dynamics - Galaxies: individual (NGC 3223) - Galaxies: structure1 Introduction
The structure of galaxies, and in particular their mass content and distribution, has been extensively investigated in the past decades. Studying the mass distribution of galaxies is closely related to the disk mass problem: how does one associate the observed stellar light distribution to a certain stellar mass distribution? Typically this is achieved by scaling the stellar light distribution by a factor (the mass-to-light ratio, M/L) to derive the stellar mass distribution. However, the stellar M/L ratio is not known a priori, and a number of routes exist to estimate it (De Jong & Bell 2007, Courteau et al. 2014): for instance, via stellar population synthesis models (Bell et al. 2001, McGaugh & Schombert 2014), spiral arms (Fuchs 2003), bar dynamics (Weiner et al. 2001, Pérez et al. 2004), and, most importantly for the present paper, using vertical velocity dispersions (Bottema 1997, Kregel et al. 2005, Bershady et al. 2010a, Martinsson et al. 2013). These methods give only very roughly consistent results, discrepancies can run up to factors of a few. A closely related issue is the maximum disk hypothesis: can the stellar disk contribution to the rotation curve be scaled up to its maximum possible value (van Albada et al. 1985)? Using the various methods described above to derive the stellar mass, authors have reached contrasting conclusions, ranging from close to maximum disk to submaximal disks (e.g. Weiner et al. 2001, Martinsson et al. 2013).
The determination of the stellar mass is important for the derivation of the dark matter distribution in galaxies, notably because the shape of the dark matter density distribution is related to that of the stellar mass (de Blok et al. 2008). The dark matter distribution has been the topic of a debate in the last years, where it has become apparent that there is a discrepancy between the dark matter density profiles found in dark matter-only Cold Dark Matter (CDM) simulations of galaxy formation and the observed dark matter density profiles (e.g. de Blok et al. 2001, Gentile et al. 2004, van Eymeren et al. 2009, Kuzio de Naray & Kaufmann 2011). Recently, various models involving the (unknown) effect of baryons on the dark matter distribution have been proposed, trying to reduce or remove the discrepancy between simulations and observations (e.g. Oh et al. 2011a, Governato et al. 2012, Macciò et al. 2012, Cloet-Osselaer et al. 2012, Di Cintio et al. 2014).
The internal kinematics of galaxies have been used to investigate a wide variety of topics, including the mass distribution of galaxies (e.g. Bosma 1981, Persic et al. 1996, Oh et al. 2011b, Gentile et al. 2013) and galaxy evolution, in particular disk heating (e.g. Minchev & Quillen 2006, Gerssen & Shapiro Griffin 2012, Sellwood 2014). A possible route to estimate the stellar mass is to use the relation between vertical stellar velocity dispersion and surface density, as done by the DiskMass survey team (Bershady et al. 2010a). Stellar kinematics can also be used to investigate the process called “disk heating”, the increase of the random velocity of stars in the galaxy disk with time. By measuring the vertical and radial velocity dispersions, and , one can test the validity of theories put forward to explain the disk heating phenomenon (Jenkins & Binney 1990, Shapiro et al. 2003), e.g. spiral structure (Sellwood & Binney 2002), scattering off giant molecular clouds (Hänninen & Flynn 2002), or the infall of substructure onto the galaxy (e.g. Kazantzidis et al. 2009). Note that there is still no consensus concerning the dominant mechanism(s) at play. Gerssen & Shapiro Griffin (2012) find that the variation of and with Hubble type suggest that spiral structure might be the primary radial heating agent, while giant molecular clouds are consistent with being the three-dimensional heating agent. These results are based on a handful of galaxies, and the values of of and are derived through a multi-parameter fit of the observed velocity dispersion and rotation velocity profiles. In the present paper we use a similar approach.
To tackle simultaneously the issues of disk mass and disk heating, as a pilot study we observed the Sb spiral galaxy NGC 3223, whose Hubble distance (corrected for Virgocentric flow) is about 38 Mpc. NGC 3223 was selected because of its southern declination (which made it accessible for observations with the VLT), its moderate inclination and relatively smooth optical appearance. It was part of the sample of 74 galaxies for which Palunas & Williams (2000) made 2-D H velocity fields, and then derived a rotation curve. We obtained Hi data, to extend the rotation curve to larger radii, and stellar kinematics along the minor and major axes. NGC 3223 was also part of the sample of Kassin et al. (2006a,b) who used the rotation curve of Mathewson et al. (1992) to derive the baryonic and dark matter distributions in a sample of galaxies.
2 Data acquisition and reduction
2.1 Photometry data
The BVI frames were taken at La Silla using the NTT telescope (New Technology Telescope), mounted with the SUSI-2 detector (D’Odorico et al. 1998), during the night of 3rd and 4th of February 2002. Ten frames were taken in each band, with an exposure time of 60 seconds (B-band) and 30 seconds (V- and I-band). The frames were cleaned of cosmic ray artifacts, de-biased, flat-fielded and sky subtracted with the MIDAS software package. The images were then aligned and combined together. For flux calibration, the extinction coefficients and zero points were determined using Landolt standard star fields SA98 and SA104(b) . The images of these star fields were reduced like the BVI photometric images. Sky subtraction is automatically performed when the magnitude is determined in MIDAS. A flux calibration check was done by comparing measured fluxes with data found using the Aladin sofware package (Bonnarel et al. 2000). Finally, an astrometric calibration was done using the Gaia package from Starlink.
The H- and Ks-band images were made with the infrared imager-spectrometer SOFI (Son OF Isaac, Moorwood et al. 1998). Ten frames were taken through the H-filter and ten frames through the Ks-filter, with an exposure time of 10 seconds. Between each frame an offset frame was taken to determine the sky background. The infrared sky background varies rapidly so, following the SOFI manual, the sky background images were made using a jitter template from which a median background is determined and subtracted from the NGC 3223 frames. Flat-fielding and illumination correction was done using the illumination and correction fields for the H- and Ks-band downloaded from the ESO SOFI website page. Flux calibration was performed using the standard starfields SJ9111 and SJ9144 from which the zero point and extinction coefficients were determined using a growth curve and SNR analysis. The same way as for the BVI frames, an astrometric calibration was performed with the Gaia package from Starlink.
2.2 Spectroscopic data
The spectroscopic observations were executed during the 6thand 7th of January 2012, for a total exposure time of 6.5 hours. Long slit spectra were taken along the major (PA 51 deg) and the minor axis (39 deg) of NGC 3223 with the FORS (Focal Reducer and low dispersion Spectrograph, Appenzeller et al. 1998) detector mounted on the VLT telescope using a 0.7 arcsec wide slit in combination with the Gris_1028z grism. This resulted in an instrumental velocity dispersion of 20 km s-1. The covered wavelength range is 7663-9335 Å. while the seeing fluctuated around 0.85 arcsec. Standard data reduction was performed with MIDAS. It included bias subtraction, flat-fielding, cosmic ray removal and wavelength calibration. Finally, the spectra were aligned and averaged and sky subtraction was performed. The 2-D error spectra were computed by taking into account the gain and the read out noise of the detector.
For the data analyses we used ULySS111htttp://ulyss.univ-lyon1.fr (Koleva et al. 2009). UlySS is a full spectrum fitting package that fits the observed spectrum against a linear combination of single stellar population models, parametrised by their ages and metallicities. It takes into account the extinction and the imperfections of the flux calibration (or lack thereof) by including multiplicative polynomial to the fit. In this case we used a 6th degree polynomial. As base models we use Vazdekis single stellar population models (SSPs) (Vazdekis et al. 2010) coupled with the CaT library from Cenarro et al. (2001). Those were convolved with the line-of-sight velocity distribution function (LOSVD). Thus, the free parameters in the fit were the age and metallicity of the SSPs, the velocity and the velocity dispersion of the LOSVD. We used the wavelength range between 8300Å and 8680Å, which is relatively clear of sky lines.
To access the instrumental broadening and the precision of the wavelength calibration we used ULySS to fit Gaussians to the reduced lamp calibration image. The instrumental dispersion we derived changes from 25 km s-1 at 7900Å to 15 km s-1 at 9200Å. This instrumental dispersion roughly corresponds to the 22.5 km s-1 broadening of the SSP models, so we could directly use the output of the program as a measure of the galaxy’s physical velocity dispersion. The precision of the wavelength calibration was estimated to be around 1 km s-1 . For the radial profile analyses we binned the spectra to a minimum mean signal-to-noise of 15, except for the outer points where we lowered our requirements to a signal-to-noise ratio of 5.
2.3 Hi data
The Hi observations were performed at the ATCA (Australia Telescope Compact Array) with three different array setups: the 6km configuration on May 11, 2002, the 1.5km configuration on July 21-22, 2002, and the 750m configuration on August 5-6, 2002, for a total of minutes on source. The correlator setup was chosen to have 512 16 kHz channels with a total bandwidth of 8 MHz.
The data were reduced using the Miriad software package (Sault et al. 1995). We used standard procedures to flag, calibrate, and subtract the continuum. The uv-data were then Fourier inverted (using a Gaussian taper with a width in the image plane of 10 arcsec and a “robust” parameter of 0.5), and we obtained a data cube. The “dirty” cube was Hanning-smoothed, yielding a velocity resolution of 6.6 km s-1 and an rms noise of 1.2 mJy beam-1 (corresponding to a column density of 1 1019 atoms cm-2). We then CLEANed the data cube and restored it with a Gaussian beam of FWHM 36.94 23.59 arcsec.
3 Data analysis
3.1 Photometry
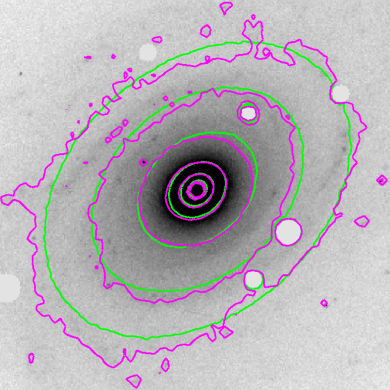
The BVIHKs images were further analysed using the software packages FitSKIRT (which uses genetic algorithms to fit optical and NIR images, including radiative transfer calculations, De Geyter et al. 2013), and BUDDA (BUlge Disc Decomposition Analysis, de Souza et al. 2004, which was designed to perform 2D bulge-disk decompositions of optical and NIR images). We performed a 2D bulge-disk decomposition of the Ks-band image because it traces best the stellar disk mass. We modelled our image as a Sérsic bulge plus an exponential disk.
The fitted isophotes with FitSKIRT are shown in Fig. 1; the best-fit effective radius of the bulge is 4 0.5 arcsec with a Sérsic index of , and the best-fit exponential scale-length of the disk is 18 2 arcsec. We double-checked this value using BUDDA and we found a consistent result. The derived apparent Ks-band magnitudes of the disk and bulge are 7.850.08 and 9.780.08, respectively. The derived inclination angle (averaged over the five BVIHKs bands) is 44.1.
3.2 Stellar kinematics
One of the main goals of the present study is to determine the stellar velocity ellipsoid, thus we have to take advantage of our observations of stellar kinematics along the major and minor axes, mostly following Gerssen & Shapiro Griffin (2012, and references therein). Simple geometrical considerations lead to the following relation between the observed stellar velocity dispersions along the major and minor axes ( and , respectively) and the three components of the velocity ellipsoid:
| (1) |
| (2) |
where , and are the radial, vertical, and tangential components of the velocity dispersion, respectively. The inclination angle is indicated with .
These are two equations and there are three unknowns, therefore a third equation needs to be added. This is usually done by assuming the epicycle approximation, which is valid in the disks of spiral galaxies because the orbits of stars are close to circular:
| (3) |
where is the circular velocity of the material in the disk at a given galactocentric distance . Equations 1, 2, and 3 represent a set of three equations and (in principle) three unknowns. However, is not necessarily exactly equal to the measured tangential velocity because of asymmetric drift:
| (4) |
where is the exponential scale length of the stellar disk and is the tilt term, which can be safely neglected in these observations of external galaxies (Gerssen et al. 1997, 2000).
If no gas kinematics are present, the four equations 1, 2, 3, and 4 are used to determine the four unknowns , and , and . In our case, we have two gas kinematics observations: 2D H kinematics from Palunas & Williams (2000) and our own Hi data (radially more extended but with a lower angular resolution). We will use the H data as an extra piece of information and as a consistency check for the circular velocities determined from stellar kinematics.
However, direct inversion of the equations to determine the unknowns as a function of radius results in very large uncertainties due to error propagation and quite noisy data to start with.
Therefore we followed the approach taken by e.g. Gerssen & Shapiro Griffin (2012, and references therein), where the radial and vertical components of the velocity dispersion are modelled as exponentials (in the radial direction):
| (5) |
| (6) |
and the circular velocity as a function of radius (the rotation curve) is modelled as a power-law:
| (7) |
Hence the problem reduces to modelling the observed , , , and gas rotation curve with six parameters (, , , , , and ).
The central parts of the galaxy are clearly dominated by the bulge. Therefore, in our analysis we only consider the radii where the disk-to-bulge brightness ratio is larger than 20. Based on the disk and bulge parameters derived in section 3.1, we thus only consider radii larger than 3.2 kpc (17.3 arcsec).
In a locally isothermal disk the vertical density distribution is given by sech where is the vertical distance from midplane and is the vertical scale-height. In this case, the disk surface density , and the scale-height are linked to the vertical velocity dispersion through the following relation:
| (8) |
As shown by e.g. Bottema (1993), if the disk mass-to-light (M/L) ratio is constant with radius, then the equation above can be rewritten as follows:
| (9) |
and is the surface brightness of the stellar disk (in the Ks-band) measured here. Assuming the kinematic scale-length (for the vertical velocity dispersion) is twice the photometric scale-length, i.e. (Bottema 1993, Binney & Merrifield 1998), we can rewrite eq. (9) to get an independent estimate of the M/L ratio:
| (10) |
In our analysis, we will investigate models where , , and is a free parameter.
3.3 Hi data cube analysis
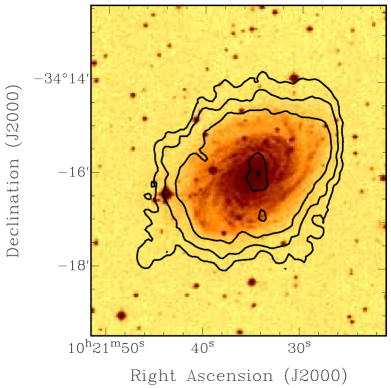
Using the primary beam-corrected data cube, we find a total Hi flux of 26.6 Jy km s-1, corresponding (at a distance of 38.1 Mpc) to 9.1 109 M⊙. The total Hi map is superimposed onto an optical image in Fig. 2.
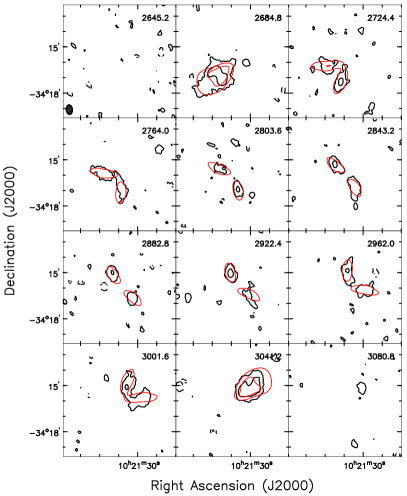
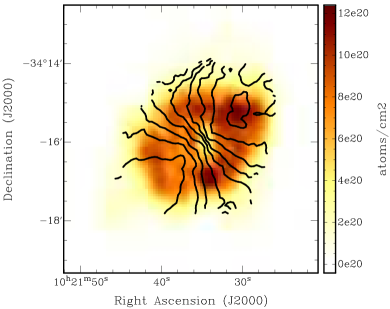
Thorough modelling of the data cube of NGC 3223 goes beyond the aim of this paper, but we made some simple models to have a good understanding of the Hi distribution and kinematics. We used the code called TiRiFiC (Józsa et al. 2007) to make models of the Hi data cube, which we iteratively compared to the observed one (see Gentile et al. 2013 for more details about the procedure). The best-fit model is shown in Fig. 3: it gives a very good representation of the observations. The data cube, Fig. 3 and the total Hi map indicate that NGC 3223 has a regularly rotating Hi disk, see the velocity field shown in Fig. 4. The gaseous disk also has an extension to the SE around position (10 21 45, -34 17 30), see Fig. 2. This extension is present in the channel maps between velocities 2678 and 2704 km s-1.
Particular attention was given to the derivation of the rotation curve. A first estimate was derived from the tilted-ring fit of the intensity-weighted velocity field, then the rotation curve was iteratively modified to match the observed data cube, in particular the position-velocity diagram along the major axis. Each data point is assigned an uncertainty that is the maximum between two quantities: (1) the difference between the two sides (receding and approaching), and (2) the velocity resolution corrected for inclination. The best-fit inclination in the inner parts (52∘, but with an uncertainty of about 10∘ because of the relatively irregular shape of the Hi contours) is slightly higher than the one derived from the optical and NIR data (44.1∘, see section 3.1). When plotting the two rotation curves together, the Hi data points were corrected for the inclination difference; we consider the inclination from the optical and NIR data to be more reliable because of the less regular shape of the Hi emission.
| Fit | ||||||
|---|---|---|---|---|---|---|
| km s-1 | km s-1 | kpc | kpc | km s-1 | ||
| All free | 18229 | 14016 | 5.11.3 | 12.73.4 | 280.61.5 | 0.0640.009 |
| = | 13512 | 16212 | 8.90.8 | = | 284.51.8 | 0.0970.014 |
| =2 | 12915 | 19211 | 10.21.8 | 6.6 (fixed) | 285.91.9 | 0.1020.014 |
| =2=2 | 23213 | 2228 | 3.3 (fixed) | 6.6 (fixed) | 275.81.2 | 0.0530.007 |
4 Results
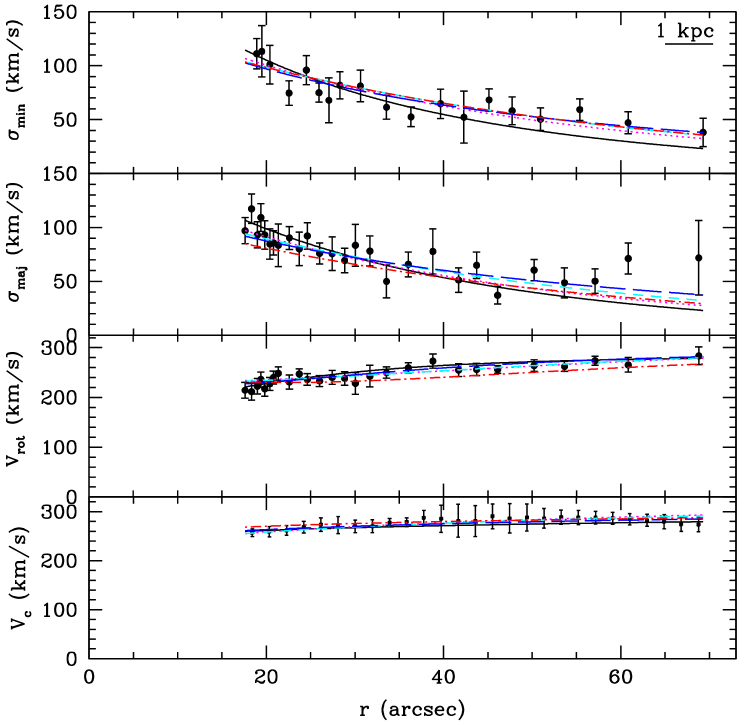
The first fit we made was with the six parameters (, , , , , and ) described in Section 3.2, fitting simultaneously the major axis stellar velocity dispersion profile, the minor axis stellar velocity dispersion profile, the major axis stellar rotation velocity profile, and the circular velocity curve as derived from the gas kinematics (H, the Hi data were used for the mass decomposition fits but not for the combined velocity dispersion/circular velocity fits). The fit quality is very good but some parameters are rather weakly constrained. The results of all the fits are tabulated in Table 1, and the fits are plotted in Fig. 5.
To investigate the real uncertainties on the parameters in a better way, we then made a fit where we forced the two kinematic scale-lengths (radial and vertical, and respectively) to have the same value, as in Shapiro et al. (2003) and Gerssen & Shapiro Griffin (2012). The next choice was to impose =2 in order to be able to use eq. (10) to estimate the stellar M/L ratio. Lastly, we made a fit with only four free parameters (, , , and ) and fixing (to have a constant Toomre stability parameter with radius) and (like above, to obtain an estimate of the stellar M/L ratio). The uncertainties on the fitted parameters were derived by creating 100 randomly generated data sets from Gaussian distributions defined by the observed data. This means for each realisation we generated a new data point, corresponding to each original data point, by randomly sampling from the original point with a Gaussian distribution with variance equal to our originally computed variance. These new data points were assumed to have the same variance as the originals. These randomly generated data were then subjected to the same fitting procedure ( minimisation) as the original data, which gives distributions of values for the best-fit parameters and hence estimates of their 1- uncertainties from Gaussian fits of their distribution.
4.1 Disk heating
From observations of eight spiral galaxies, Gerssen & Shapiro Griffin (2012) find a relation between Hubble type and ratios: it turns out that later type galaxies have lower ratios. From the relation they derive, the expected value for an Sb galaxy like NGC 3223 would be around 0.63 with an uncertainty of about 0.2. From the fit with we find , not consistent with Gerssen’s relation. If we force the ratio to be equal to 0.63, we find (Fig. 5) that the fit indeed worsens, in particular the major axis velocity dispersion and rotation velocity profiles are underestimated.
It is possible that we overestimated the inclination (44.1∘). By taking 40.5∘, the value of Kassin et al. (2006a), we find a best-fit ratio of , still higher than the value suggested by Gerssen & Shapiro Griffin (2012).
It is also possible that the choice of cutoff radius is incorrect. Changing the inner cutoff radius to 15 arcsec (instead of 17.3 arcsec) gives an almost identical value, . Changing it to 25 arcsec gives , slightly lower but (as intuitively expected) with a larger uncertainty, because there are fewer data points to constrain the parameters.
The result that NGC 3223 is more vertically heated than expected implies that NGC 3223 is an outlier in the observational relation of Gerssen & Shapiro Griffin (2012). The reason for this large vertical heating is not obvious, but recent mergers are excluded because of the regular morphology and kinematics. We note that the values we found for NGC 3223 are marginally inconsistent with the correlation between and found by Gerssen & Shapiro Griffin (2012). They plot the velocity dispersions at half the kinematic scale-length. With km s-1 and , NGC 3223 is (marginally) inconsistent with the relation found in their Fig. 6.
4.2 Constraint on the M/L ratio
The evaluation of constraints on the stellar M/L was done using the results of the fits made with the scale length of the vertical velocity dispersion distribution fixed at twice the stellar exponential scale length (see Section 4).
Applying eq. (10) to the fits using =2 and =2=2 in Table 1 gives values of M/L=0.960.34 and 1.280.46, respectively, which is quite high for the Ks-band. The errors quoted here are formal uncertainties based on the fits and error propagation. We used a sech2 vertical distribution with a scale-height of 0.9 kpc, based on the Ks-band exponential scale-length and using the average between the scale-length-to-scale-height ratios given by Kregel et al. (2002) and Bershady et al. (2010b). We used the Ks-band absolute magnitude of the Sun given by Pecaut & Mamajek (2013), i.e. 3.30.
Could other effects contribute to the real uncertainties? One possibility is the inclination angle: if we assume 40.5∘ (see previous section) the results above become 0.910.33 and 1.080.39, respectively. Changing the inner cutoff radius to 15 arcsec instead of 17.3 arcsec gives (for =2 and =2=2) 0.980.35 and 1.250.45, thus a negligible variation in the derived stellar M/L ratio. Changing the inner cutoff radius to 25 arcsec instead of 17.3 arcsec gives 0.750.27 and and 1.360.49, respectively.
The expectations from stellar population synthesis range from 0.35 to 0.80, using a B-V colour of 0.80 and the relations between colour and stellar M/L ratio found in Bell & de Jong (2001), Bell et al. (2003), Portinari et al. (2004), Zibetti et al. (2009), and Into and Portinari (2013). The B-V colour seems to be a good indicator of M/L ratio (McGaugh & Schombert 2014), even though at NIR wavelengths the dependency of M/L on colour is weak.
Therefore we can conclude that our estimated range of stellar M/L ratios (between 0.5 and 1.7) is consistent with the most massive predictions of stellar population synthesis models. We have checked that within the outermost point fitted in the velocity dispersion profiles the stellar surface density (even with a stellar M/L ratio of 0.5) is much higher ( 10 times) than the Hi surface density: thus our results about the M/L ratio are not falsified by the Hi surface density influencing the vertical velocity dispersion.
4.3 Rotation curve fitting


| Fit | Stellar M/LK ratio | Parameter 1 | Parameter 2 |
|---|---|---|---|
| Burkert halo | 0.71 | 26.9 | 0.0087 |
| Unconstrained NFW halo | 0.66 | 10545 | 1 |
| NFW halo with c-Mvir relation | 0.61 | 57 | 8.0 |
Using the constraints on the stellar M/L ratio derived in Section 4.2 we made rotation curve fits using different dark matter halo density distributions. The bulge and disk contributions to the rotation curve were derived from the parameters of the Ks-band bulge/disk decomposition of Section 3.1. For the bulge we adopt the same stellar M/L ratio as for the disk. The Hi disk contribution was derived from the observed surface density distribution (corrected for primordial He), and for the dark matter halo we used two different functional forms:
the Burkert (1995) halo, known to give good fits to rotation curves (e.g. Salucci et al. 2007). The density as a function of radius has a central core (i.e. a finite central density) and is given by:
| (11) |
where the central density and the core radius are the two free parameters.
the NFW halo (Navarro, Frenk & White 1996), characterised by a central density cusp, whose functional form is the following:
| (12) |
where and are the characteristic density and scale-length of the dark matter halo. The parameters and can also be expressed in terms of the virial mass and the concentration ( is the virial radius). Dark matter simulations of structure formation in the Universe show that and are not independent (e.g. Neto et al. 2007). We adopt here the relation used by Gentile et al. (2007):
| (13) |
The fits are plotted in Fig. 6: the Burkert halo fit is very good, and the product M⊙ pc-2 is consistent with the value found by Donato et al. (2009) and Gentile et al. (2009) for a large sample of galaxies.
The NFW halo fits are almost as good. In the fit with no constraints on the virial mass and concentration the allowed range of virial masses spans almost three orders of magnitude. This range would have been larger if we had not put a minimum reasonable value of 1 for the concentration parameter. The constrained NFW halo fit is only slightly worse ( value 35% higher), we find a value of the virial mass of 5.6 M⊙, consistent with the value of the unconstrained fit.
5 Conclusions
We have presented observations of the stars and gas kinematics of NGC 3223, an Sb galaxy located at a distance of about 38 Mpc.
From the observed stellar velocity dispersion along the major and minor axis, from the major-axis stellar rotation velocity and from the gas kinematics, we determined the vertical and radial stellar velocity dispersion as a function of radius. We found a vertical-to-radial velocity dispersion ratio of , significantly higher the relation between and Hubble type found by e.g. Gerssen & Shapiro Griffin (2012).
We also used the Ks-band photometry together with the derived vertical velocity dispersion to estimate the mass-to-light (M/L) ratio of the stellar disk. We find that the uncertainties are quite large, and the allowed range lies between 0.5 and 1.7 (in the Ks-band). This lies at the high end of the values predicted by stellar population synthesis models. Because of such a weak constraint on the stellar M/L ratio we cannot really constrain the distribution of dark matter in NGC 3223. However, the method proved to yield meaningful results, consistent with other data, therefore a statistical approach involving a sample of galaxies with similar data and a spread in physical properties will certainly provide more answers.
Acknowledgements
We thank the anonymous referee for constructive comments that improved the content and presentation of this paper. The research of GWA supported by the FWO - Vlaanderen. MK is a postdoctoral fellow of the Fund for Scientific Research- Flanders, Belgium (FWO 65052 / 12E4115N LV).
References
- Appenzeller et al. (1998) Appenzeller, I., Fricke, K., Fürtig, W., et al. 1998, The Messenger, 94, 1
- Bell & de Jong (2001) Bell, E. F., & de Jong, R. S. 2001, ApJ, 550, 212
- Bell et al. (2003) Bell, E. F., McIntosh, D. H., Katz, N., & Weinberg, M. D. 2003, ApJS, 149, 289
- Bershady et al. (2010) Bershady, M. A., Verheijen, M. A. W., Swaters, R. A., et al. 2010a, ApJ, 716, 198
- Bershady et al. (2010) Bershady, M. A., Verheijen, M. A. W., Westfall, K. B., et al. 2010b, ApJ, 716, 234
- Bevington & Robinson (2003) Bevington, P. R., & Robinson, D. K. 2003, Data reduction and error analysis for the physical sciences, 3rd ed., by Philip R. Bevington, and Keith D. Robinson. Boston, MA: McGraw-Hill, ISBN 0-07-247227-8, 2003
- Binney & Merrifield (1998) Binney, J., & Merrifield, M. 1998, Galactic astronomy / James Binney and Michael Merrifield. Princeton, NJ : Princeton University Press, 1998. (Princeton series in astrophysics) QB857 .B522 1998
- Bonnarel et al. (2000) Bonnarel, F., Fernique, P., Bienaymé, O., et al. 2000, A&AS, 143, 33
- Bosma (1981) Bosma, A. 1981, AJ, 86, 1825
- Bottema (1993) Bottema, R. 1993, A&A, 275, 16
- Bottema (1997) Bottema, R. 1997, A&A, 328, 517
- Burkert (1995) Burkert, A. 1995, ApJ, 447, L25
- Cenarro et al. (2001) Cenarro, A. J., Cardiel, N., Gorgas, J., et al. 2001, MNRAS, 326, 959
- Cloet-Osselaer et al. (2012) Cloet-Osselaer, A., De Rijcke, S., Schroyen, J., & Dury, V. 2012, MNRAS, 423, 735
- Courteau et al. (2014) Courteau, S., Cappellari, M., de Jong, R. S., et al. 2014, Reviews of Modern Physics, 86, 47
- de Souza et al. (2004) de Souza, R. E., Gadotti, D. A., & dos Anjos, S. 2004, ApJS, 153, 411
- de Blok et al. (2008) de Blok, W. J. G., Walter, F., Brinks, E., et al. 2008, AJ, 136, 2648
- de Blok et al. (2001) de Blok, W. J. G., McGaugh, S. S., & Rubin, V. C. 2001, AJ, 122, 2396
- De Geyter et al. (2013) De Geyter, G., Baes, M., Fritz, J., & Camps, P. 2013, A&A, 550, A74
- de Jong & Bell (2007) de Jong, R. S., & Bell, E. F. 2007, Island Universes - Structure and Evolution of Disk Galaxies, 107
- Di Cintio et al. (2014) Di Cintio, A., Brook, C. B., Macciò, A. V., et al. 2014, MNRAS, 437, 415
- D’Odorico et al. (1998) D’Odorico, S., Beletic, J. W., Amico, P., et al. 1998, Proc. SPIE, 3355, 507
- Donato et al. (2009) Donato, F., Gentile, G., Salucci, P., et al. 2009, MNRAS, 397, 1169
- Fuchs (2003) Fuchs, B. 2003, Ap&SS, 284, 719
- Gentile et al. (2004) Gentile, G., Salucci, P., Klein, U., Vergani, D., & Kalberla, P. 2004, MNRAS, 351, 903
- Gentile et al. (2007) Gentile, G., Salucci, P., Klein, U., & Granato, G. L. 2007, MNRAS, 375, 199
- Gentile et al. (2009) Gentile, G., Famaey, B., Zhao, H., & Salucci, P. 2009, Nature, 461, 627
- Gentile et al. (2013) Gentile, G., Józsa, G. I. G., Serra, P., et al. 2013, A&A, 554, A125
- Gerssen et al. (1997) Gerssen, J., Kuijken, K., & Merrifield, M. R. 1997, MNRAS, 288, 618
- Gerssen et al. (2000) Gerssen, J., Kuijken, K., & Merrifield, M. R. 2000, MNRAS, 317, 545
- Gerssen & Shapiro Griffin (2012) Gerssen, J., & Shapiro Griffin, K. 2012, MNRAS, 423, 2726
- Governato et al. (2012) Governato, F., Zolotov, A., Pontzen, A., et al. 2012, MNRAS, 422, 1231
- Hänninen & Flynn (2002) Hänninen, J., & Flynn, C. 2002, MNRAS, 337, 731
- Into & Portinari (2013) Into, T., & Portinari, L. 2013, MNRAS, 430, 2715
- Jenkins & Binney (1990) Jenkins, A., & Binney, J. 1990, MNRAS, 245, 305
- Józsa et al. (2007) Józsa, G. I. G., Kenn, F., Klein, U., & Oosterloo, T. A. 2007, A&A, 468, 731
- Kassin et al. (2006) Kassin, S. A., de Jong, R. S., & Pogge, R. W. 2006a, ApJS, 162, 80
- Kassin et al. (2006) Kassin, S. A., de Jong, R. S., & Weiner, B. J. 2006b, ApJ, 643, 804
- Koleva et al. (2009) Koleva, M., Prugniel, P., Bouchard, A., & Wu, Y. 2009, A&A, 501, 1269
- Kregel et al. (2002) Kregel, M., van der Kruit, P. C., & de Grijs, R. 2002, MNRAS, 334, 646
- Kregel et al. (2005) Kregel, M., van der Kruit, P. C., & Freeman, K. C. 2005, MNRAS, 358, 503
- Kuzio de Naray & Kaufmann (2011) Kuzio de Naray, R., & Kaufmann, T. 2011, MNRAS, 414, 3617
- Macciò et al. (2012) Macciò, A. V., Stinson, G., Brook, C. B., et al. 2012, ApJ, 744, L9
- Martinsson et al. (2013) Martinsson, T. P. K., Verheijen, M. A. W., Westfall, K. B., et al. 2013, A&A, 557, A131
- Mathewson et al. (1992) Mathewson, D. S., Ford, V. L., & Buchhorn, M. 1992, ApJS, 81, 413
- McGaugh & Schombert (2014) McGaugh, S., & Schombert, J. 2014, AJ in press (arXiv:1407.1839)
- Minchev & Quillen (2006) Minchev, I., & Quillen, A. C. 2006, MNRAS, 368, 623
- Moorwood et al. (1998) Moorwood, A., Cuby, J.-G., & Lidman, C. 1998, The Messenger, 91, 9
- Neto et al. (2007) Neto, A. F., Gao, L., Bett, P., et al. 2007, MNRAS, 381, 1450
- Oh et al. (2011a) Oh, S.-H., Brook, C., Governato, F., et al. 2011a, AJ, 142, 24
- Oh et al. (2011b) Oh, S.-H., de Blok, W. J. G., Brinks, E., Walter, F., & Kennicutt, R. C., Jr. 2011b, AJ, 141, 193
- Palunas & Williams (2000) Palunas, P., & Williams, T. B. 2000, AJ, 120, 2884
- Pecaut & Mamajek (2013) Pecaut, M. J., & Mamajek, E. E. 2013, ApJS, 208, 9
- Pérez et al. (2004) Pérez, I., Fux, R., & Freeman, K. 2004, A&A, 424, 799
- Persic et al. (1996) Persic, M., Salucci, P., & Stel, F. 1996, MNRAS, 281, 27
- Portinari et al. (2004) Portinari, L., Sommer-Larsen, J., & Tantalo, R. 2004, MNRAS, 347, 691
- Salucci et al. (2007) Salucci, P., Lapi, A., Tonini, C., et al. 2007, MNRAS, 378, 41
- Sault et al. (1995) Sault, R. J., Teuben, P. J., & Wright, M. C. H. 1995, Astronomical Data Analysis Software and Systems IV, 77, 433
- Sellwood & Binney (2002) Sellwood, J. A., & Binney, J. J. 2002, MNRAS, 336, 785
- Sellwood (2014) Sellwood, J. A. 2014, Reviews of Modern Physics, 86, 1
- Shapiro et al. (2003) Shapiro, K. L., Gerssen, J., & van der Marel, R. P. 2003, AJ, 126, 2707
- van Eymeren et al. (2009) van Eymeren, J., Trachternach, C., Koribalski, B. S., & Dettmar, R.-J. 2009, A&A, 505, 1
- Vazdekis et al. (2010) Vazdekis, A., Sánchez-Blázquez, P., Falcón-Barroso, J., et al. 2010, MNRAS, 404, 1639
- Weiner et al. (2001) Weiner, B. J., Sellwood, J. A., & Williams, T. B. 2001, ApJ, 546, 931
- Zibetti et al. (2009) Zibetti, S., Charlot, S., & Rix, H.-W. 2009, MNRAS, 400, 1181