Direct evidence for an evolving dust cloud from the exoplanet KIC 12557548 b
Abstract
We present simultaneous multi-color optical photometry using ULTRACAM of the transiting exoplanet KIC 12557548 b (also known as KIC 1255 b). This reveals, for the first time, the color dependence of the transit depth.
Our ’ and ’ transits are similar in shape to the average Kepler short-cadence profile, and constitute the highest-quality extant coverage of individual transits. Our Night 1 transit depths are in ’; in ’; and in ’.
We employ a residual-permutation method to assess the impact of correlated noise on the depth difference between the ’ and ’ bands and calculate the significance of the color dependence at .
The Night 1 depths are consistent with dust extinction as observed in the ISM, but require grain sizes comparable to the largest found in the ISM: 0.25–1m. This provides direct evidence in favor of this object being a disrupting low-mass rocky planet, feeding a transiting dust cloud.
On the remaining four nights of observations the object was in a rare shallow-transit phase.
If the grain size in the transiting dust cloud changes as the transit depth changes, the extinction efficiency is expected to change in a wavelength- and composition-dependent way. Observing a change in the wavelength-dependent transit depth would offer an unprecedented opportunity to determine the composition of the disintegrating rocky body KIC 12557548 b.
We detected four out-of-transit ’ band events consistent with stellar flares.
Subject headings:
planets and satellites: detection — planets and satellites: individual (KIC 12557548 b)— stars: individual (KIC 12557548) — planetary systems — dust, extinction1. Introduction
Rappaport et al. (2012, hereafter R12) discovered a peculiar, transit-like signal in the Kepler light curve of KIC 12557548 (hereafter KIC 1255), a K5-K7 dwarf star (Borucki et al., 2009). The signal is unlike any exoplanetary transit curve previously observed, characterised by a short pre-ingress brightening phase, a sharp ingress and an extended egress, with a period of just 15.7 hr. The transit depths range from to . R12 proposed that the signal is caused by a highly irradiated super-Mercury, surrounded by an opaque cloud of dust and metal-rich gas constantly replenished by the embedded planet through a thermal Parker-type wind feeding a comet-like obscuring tail. In this scenario, the underlying planet has an undetectable transit signal, and the observed transits are caused by the surrounding cloud of dust only. Alternative explanations, such as a dual giant planet system or an eclipsing binary orbiting KIC 1255 in a hierarchical triple configuration, were also analysed and ruled out. A similar signal has since been detected in the light curve of another short period system KOI-2700 (Rappaport et al., 2014).
A simple cometary dust model for KIC 1255 b was created by Brogi et al. (2012, hereafter B12) who estimated an average particle size in the cloud of . A pseudo 2D model by van Werkhoven et al. (2013, hereafter W13) was applied to individual transits in the Kepler short-cadence data, suggesting that deeper transits tend to have most absorption in the tail, rather than in the disk-shaped, opaque coma surrounding the planet. The pre-transit brightening, attributed to forward scattering from the dust cloud, was analysed by Budaj (2013, hereafter B13), who estimated the particle radius of the grains in the head of the tail to be about to , likely decreasing in size along the tail. Kawahara et al. (2013) found a correlation between the transit depth and the activity of the star, pointing to stellar activity being the primary energy source driving the evaporation. Simultaneous Kepler and -band observations of two transits by Croll et al. (2014a, hereafter C14) and time-series optical spectrophotometry with the 10.4 m GranTeCan (E. Palle 2015, private communication) had insufficient precision to detect color dependence in the transit depths at the level.
In this Letter we discuss high-cadence multi-color observations of KIC 1255. Our light curves allow us to directly confirm the presence of the dust cloud surrounding the putative planet and establish that with further similar data it could be possible to determine the composition of the scattering material. We also briefly discuss flaring events observed in the u’ band and compare the morphology of individual KIC 1255 b transits with the Kepler observations.
2. Observations and Data Reduction
We observed KIC 1255 on 14, 25, 27, 29 and 31 July 2013 (civil, beginning of the night dates) using ULTRACAM (Dhillon et al., 2007) on the 4.2m William Herschel Telescope. Dichroic beamsplitters directed incident light into three cameras, each recording a different band. Each light curve was at least 4 hr long, covering hr of in-transit and hr of out-of-transit time, based on the longest transits of R12. We used Sloan (Fukugita et al., 1996) broadband filters: ’, ’, ’ on the first two nights to observe the widest possible wavelength range with high signal-to-noise ratio (S/N) to measure the color dependence of the extinction and scattering. The transit on the second night was very shallow, approaching the limits of detectability. Consequently we switched from ’ to ’ in the red arm of ULTRACAM for the remaining three nights to boost the S/N, while sacrificing some of the wavelength coverage. We used 6.6 s exposure times throughout (co-adding 6 exposures in the ’ band) to achieve time resolution up to an order of magnitude higher than the Kepler short-cadence data (58.9 sec, W13), achieving S/N for ’, ’ & ’ and for ’ with duty cycle exceeding 99.6% due to the use of frame-transfer CCDs in ULTRACAM. All nights were photometric, with seeing on average. Guiding errors, due to flexure in the autoguider relative to ULTRACAM, caused small offsets in R.A. with (1 pixel) accumulating per hour, which we manually corrected. The flux showed no correlation with the position of the star on the CCDs.
Frames were calibrated following the standard procedure (Howell, 2006), with additional fringing corrections applied to the first two nights of ’ data. We performed differential aperture photometry using the ULTRACAM pipeline111http://deneb.astro.warwick.ac.uk/phsaap/software/ultracam/html/
index.html and the Improved Differential Photometry method (Fernández Fernández et al., 2012), selecting three comparison stars of similar or greater brightness than the target: KIC 12509691,
KIC 12509684 and KIC 12557520. There were no available comparison stars with similar color to KIC 1255, so we performed a subsequent color term correction by fitting a second-order polynomial, symmetrical with respect to the meridian crossing time, to the out-of-transit section of the light curve. 3- outliers were omitted during
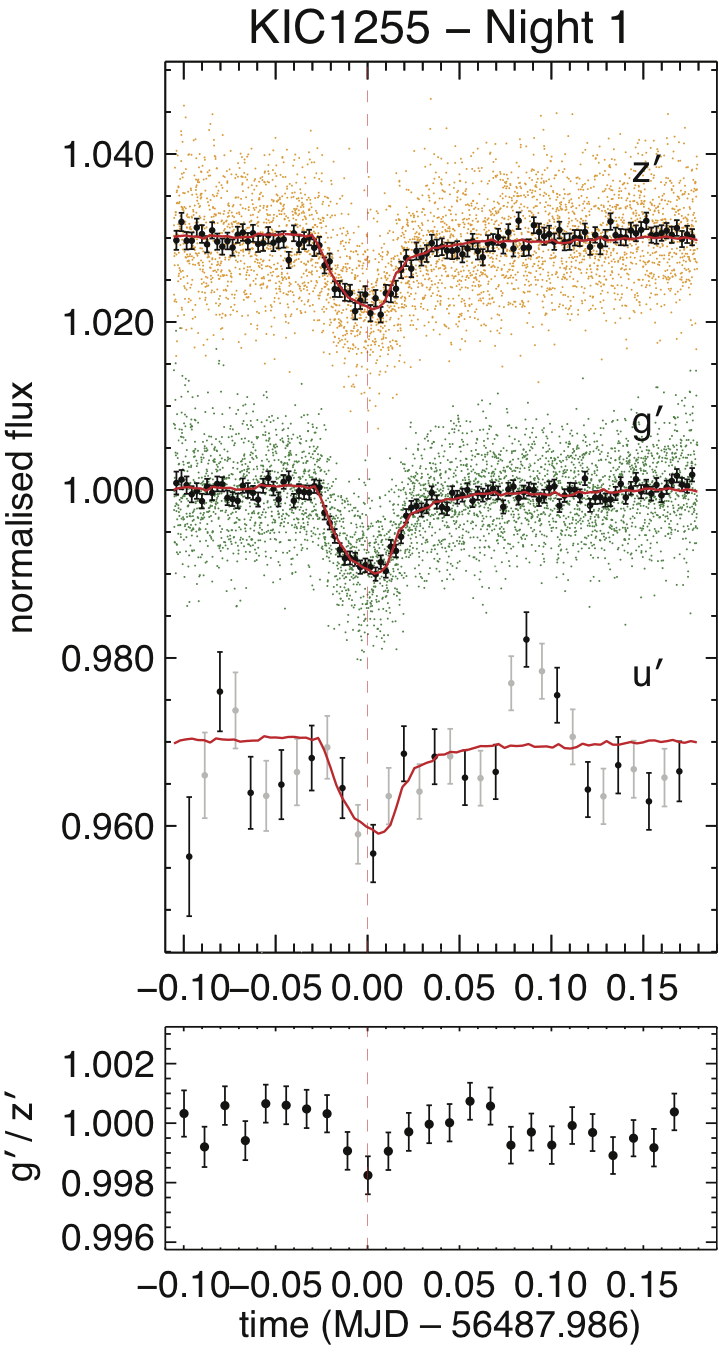
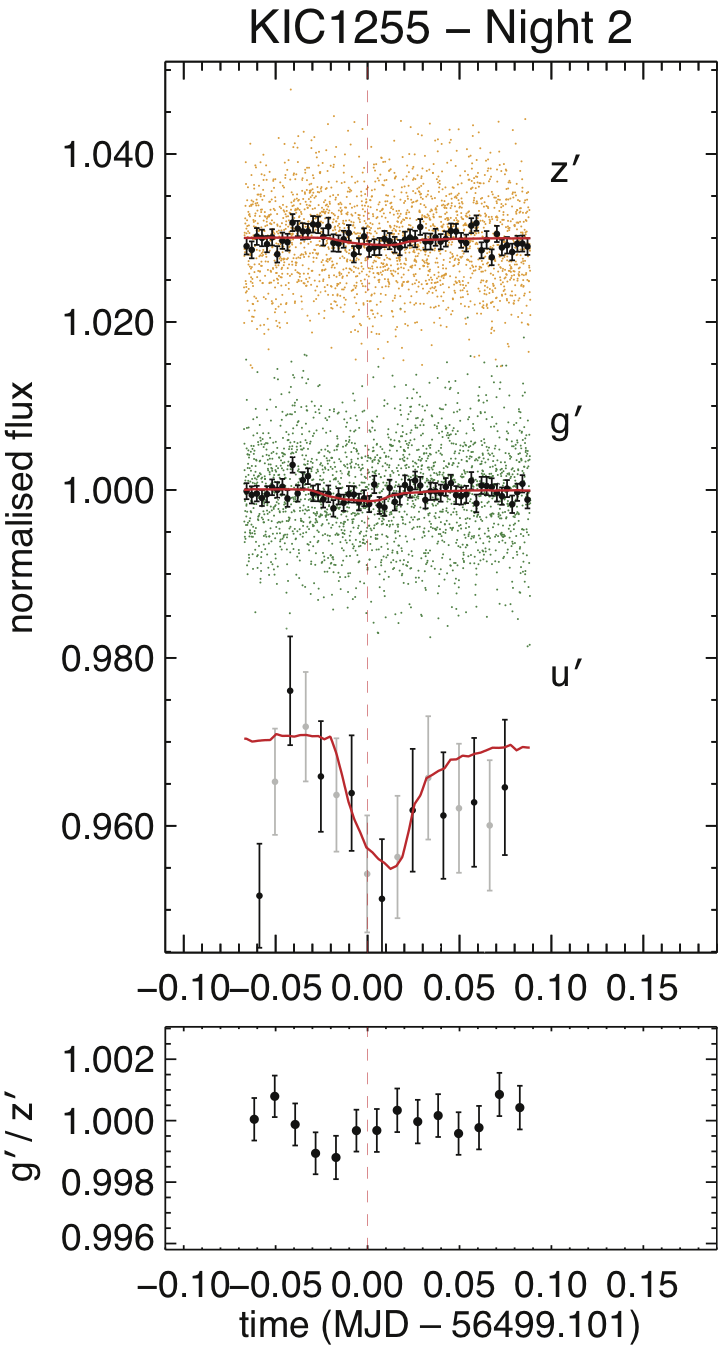
determination of the color term correction and 8- outliers were removed from the final results; outliers were fewer than 0.2% of all data. Figure 1 shows the resulting light curves for Nights 1 & 2.
Our light curves show no prominent systematic effects. All ’-band light curves for KIC 1255
are shown in Fig. 2, and similar apparently systematic-free light curves were
obtained in other bands and for our comparison stars. We quantified the correlated noise
in the comparison star light curves and in the out-of-transit KIC 1255 data using the time-averaging method (Pont, Zucker & Queloz, 2006). The 10–45 minute range, i.e. the duration of ingress and egress is the most relevant timescale for transit photometry (Carter & Winn, 2009); the red noise on this timescale
in our KIC 1255 Night 1 light curve is on the order of , , and of the white noise in
’, ’, and ’ respectively. The noise levels on other nights were comparable, and in the comparison stars
the red noise levels were slightly lower, especially in ’.
3. Results and analysis
3.1. Transit Characterisation
Following Haswell et al. (2012) we used a simple Mandel & Agol (2002) planet transit model to determine and the mid-transit time of KIC 1255 b in each band for each night. We set the remaining planetary parameters according to W13 and used stellar parameters from the Kepler Input Catalogue (Brown et al., 2011). Quadratic limb-darkening coefficients were interpolated from Claret & Bloemen (2011) using the EXOFAST routine by Eastman et al. (2013). We know the transits of KIC 1255 b are not attributable to the unchanging circular cross-section of an opaque planet, but this simple model gives quantitative depth and timing information (see Table 1), which can be easily reproduced.
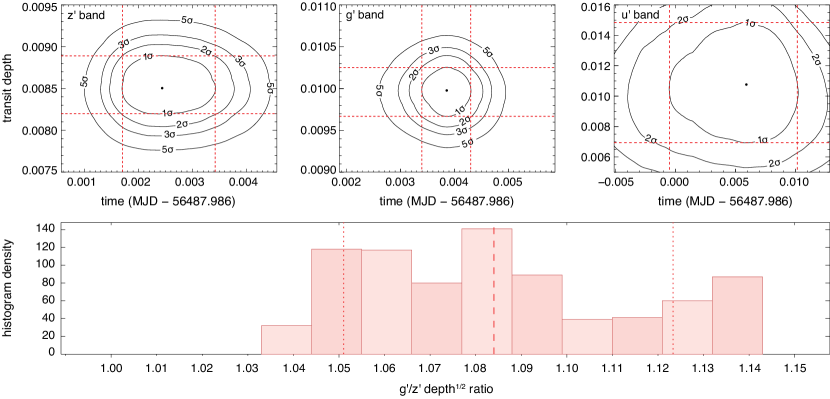
The Mandel & Agol fits to the Night 1 ’ and ’ give residuals which show clear systematic deviations, indicating as expected that the dust is distributed differently to a circular cross-section. We also fitted scaled versions of the average Kepler short-cadence profile (C14). In this fitting we allowed the time/phase offset to vary freely and applied a scale factor to the flux, so the fractional depth, , at the deepest part of the profile was free to vary, but the duration of the transit profile was fixed. Like our ’ and ’ data, the Kepler short-cadence profile has some discontinuities in the slope of the egress, and provides fits which do not exhibit systematic patterns in the residuals. It is possible that the very smooth egress in the phase-folded Kepler long-cadence curve (R12, compared to our data and to the Kepler short-cadence curve) can be partially attributed to the smearing effects of the long Kepler exposures. Our light curves, particularly the ’ band, which is similar in wavelength coverage to the Kepler band, are very similar in shape to the scaled Kepler short-cadence profile. Figure 1 shows the best fitting scaled Kepler short-cadence profiles for Nights 1 & 2, while Figure 3 shows the corresponding confidence intervals for Night 1. Following the rationale in Carter & Winn (2009), the confidence intervals in Figure 3(a) and Table 1 include the contribution from the red noise.
We used the (only published) fiducial phase from R12 and the (most precise published) period from W13 to calculate phase 0.0 independent of our data. Figure 1 shows time relative to this. Where our unbiased search of depth-timing space identifies a transit at the appropriate phase, this is suggestive of a genuine detection. We detected appropriately phased transits on Nights 1 and 2; the best fit parameters are reported in Table 1. The Night 2 ’ light curve (Figures 1 & 2) clearly has a noise level similar to the reported transit depth, and the correlated noise can conspire to move the out-of-transit level and the in-transit level in opposite directions, so while the timings suggest this is a genuine detection we caution against placing too much faith in the reported depths.
For Night 1 the reduced values for our Mandel and Agol model fits were 0.872, 0.853, and 0.800 with 4036, 4036 and 671 degrees of freedom in ’, ’ and ’ respectively; the corresponding values for the scaled Kepler short-cadence profile fits were 0.785, 0.695, and 0.785. The scaled Kepler profile obviously provides a superior fit to the ’ and ’ data. The ’ light curve (Figure 1) clearly does not strongly constrain the shape of the transit.
We report the mid-transit time for the Mandel and Agol fits, while for the Kepler profile fits we follow C14 and report , the time of flux minimum. Because the profile is skewed, occurs after the mid-transit time; the Night 1 ’ and ’ values in Table 1 show offsets of days, which is within the uncertainties in the ’ values. The depth parameter, , is the fractional depth at the deepest part of the fitted Kepler profile. For ease of comparison with the parameter, we tabulate the values of . Again, there is a systematic offset: the broader, flatter floor in the Mandel and Agol transit profile sits above the minimum of the observed profile, while the Kepler profile matches it well. This causes the systematic offset between the tabulated Night 1 depth parameters of in all three bands.
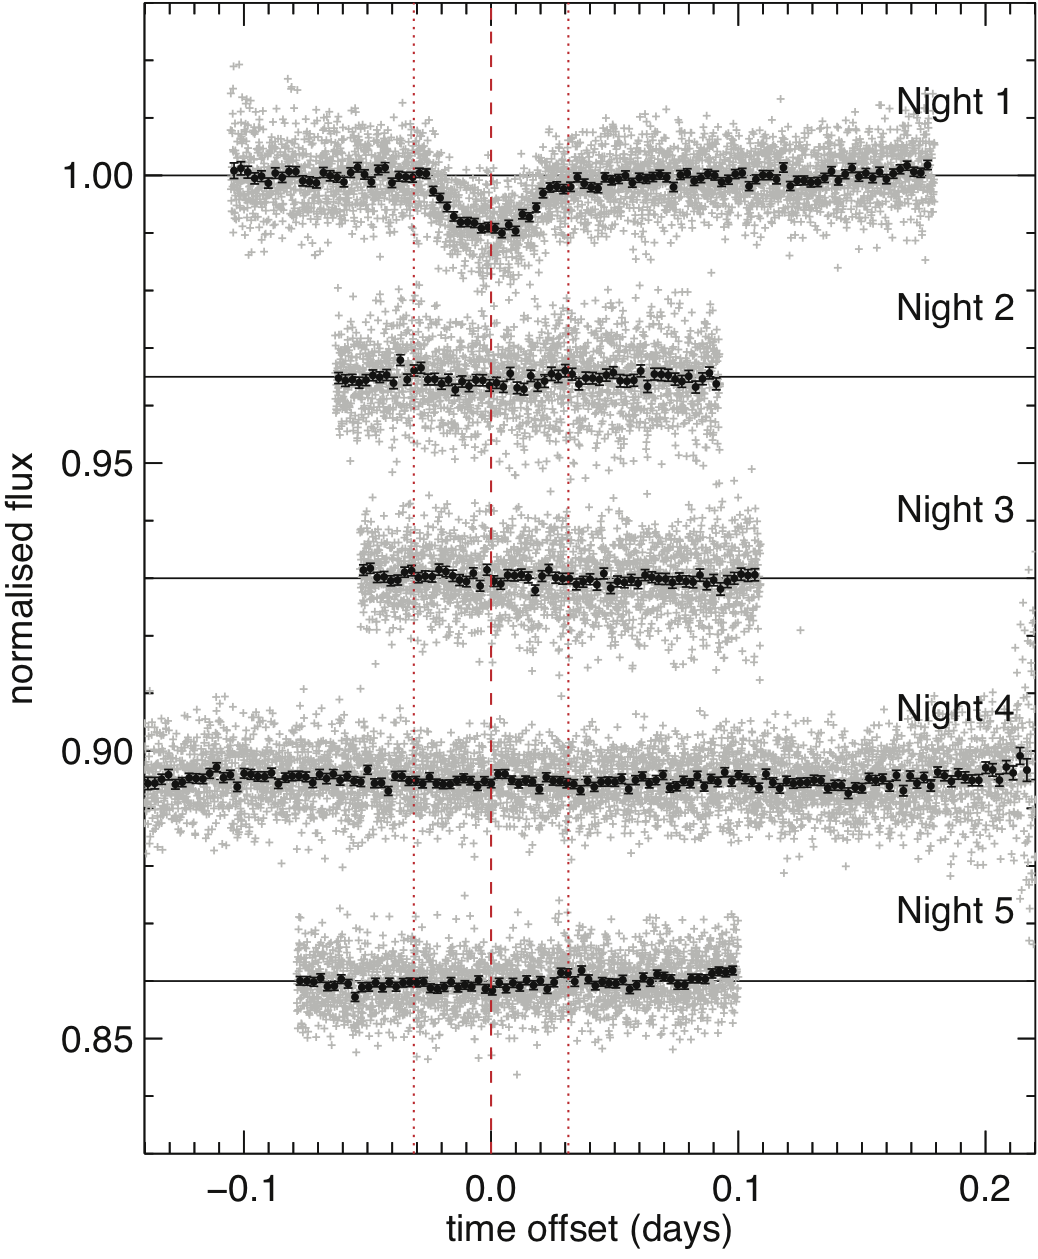
On Nights 3, 4, & 5, whose ’ band light curves are shown in Fiure. 2, we did not recover appropriately phased transits. We estimated upper limits on on these nights by attempting to recover transits using the method described above, and quoting the largest value of identified: 0.031 in ’, 0.027 in ’ and 0.087 in ’ (averaged over three nights). These ‘transits’ were at the wrong phases, indicating the algorithm chose noise features. Any actual transit deeper than these values would have been found if present.
If the obscuring dust is clumpy, we might expect an increased scatter in flux values during ingress and egress as individual clumps cross the stellar limb. We searched for this effect but found no significant evidence for it. It may, however, emerge if a larger number of light curves of the quality of our Night 1 data are analysed.
Our primary result (Table 1) is the color dependence of the transit depth: the ratio of the square roots of the transit depths in ’ and ’ (i.e. the parameter analogous to ) is , where the uncertainties were propagated from the best fit model depths. To assess the robustness of this, we employed residual permutation statistics (Winn et al., 2009) with two-sided 68.27% confidence intervals based on the studentised pivotal method (Carpenter & Bithell, 2000), concluding that the ratio of the square roots of transit depths in ’ and ’ is . As none of the 807 realisations of the residual permutation method produced a depth ratio of 1 (Figure 3(b)), we reject the zero color difference hypothesis with probability 99.88% or .
To assess whether the transit depth, which can be influenced by limb darkening, is a good proxy for light loss due to extinction in a given band, we compared the ’/’ depth ratio described above to the ratio of the equivalent occulting areas in these two bands. To find & , we modelled the occulting dust tail as a cloud with variable transparency extending above and below the orbital plane and following the orbit of the planet (B13). The dust density profile of the tail, inversely proportional to its transparency, is:
| (1) |
i.e. Equation 4 from B13; where is the angle from the beginning of the arc, is the density along the arc and is a constant. produces a good match to the transit light curve in all bands, and is consistent with B13. The transparency along the tail was adjusted by varying in each band separately, until the light curves matched the observations. The square root of the resulting ratio is (the uncertainty arises from a reasonable range of limb-darkening coefficients), well within the confidence intervals for the square root depth ratio. This establishes that the impact of limb darkening on our results is minor in comparison to other sources of error.
The presence of occulted and unocculted starspots can modify the transit depth and possibly influence the derived dependence of the planetary radius on the wavelength (Pont et al., 2008). To assess this, we looked at analogous multi-wavelength observations of a well studied mid-K star, HAT-P-20 (Bakos et al., 2011), and used Figure 4 in Ballerini et al. (2012) to calculate the effect of starspots on the theoretical HAT-P-20 ’/’ transit depth ratio. The maximum fractional light loss due to starspots was set at 4% as predicted by Croll et al. (2014b) for KIC 1255. We found that starspots can account for only up to 0.46% of our observed ’/’ square root depth ratio: insignificant in comparison to other sources of error.
3.2. Color Dependence and Dust Modelling
We observed differences in transit depths between the ’, ’ and ’ filters on Night 1, with an increase in depth toward shorter wavelengths (Figures 1 & 3, Table 1). This effect is consistent with extinction from the putative dust cloud surrounding the planet (R12), as we will show quantitatively. Detections on Night 2 (Figure 1, Table 1) also show an increase in depth towards shorter wavelengths.
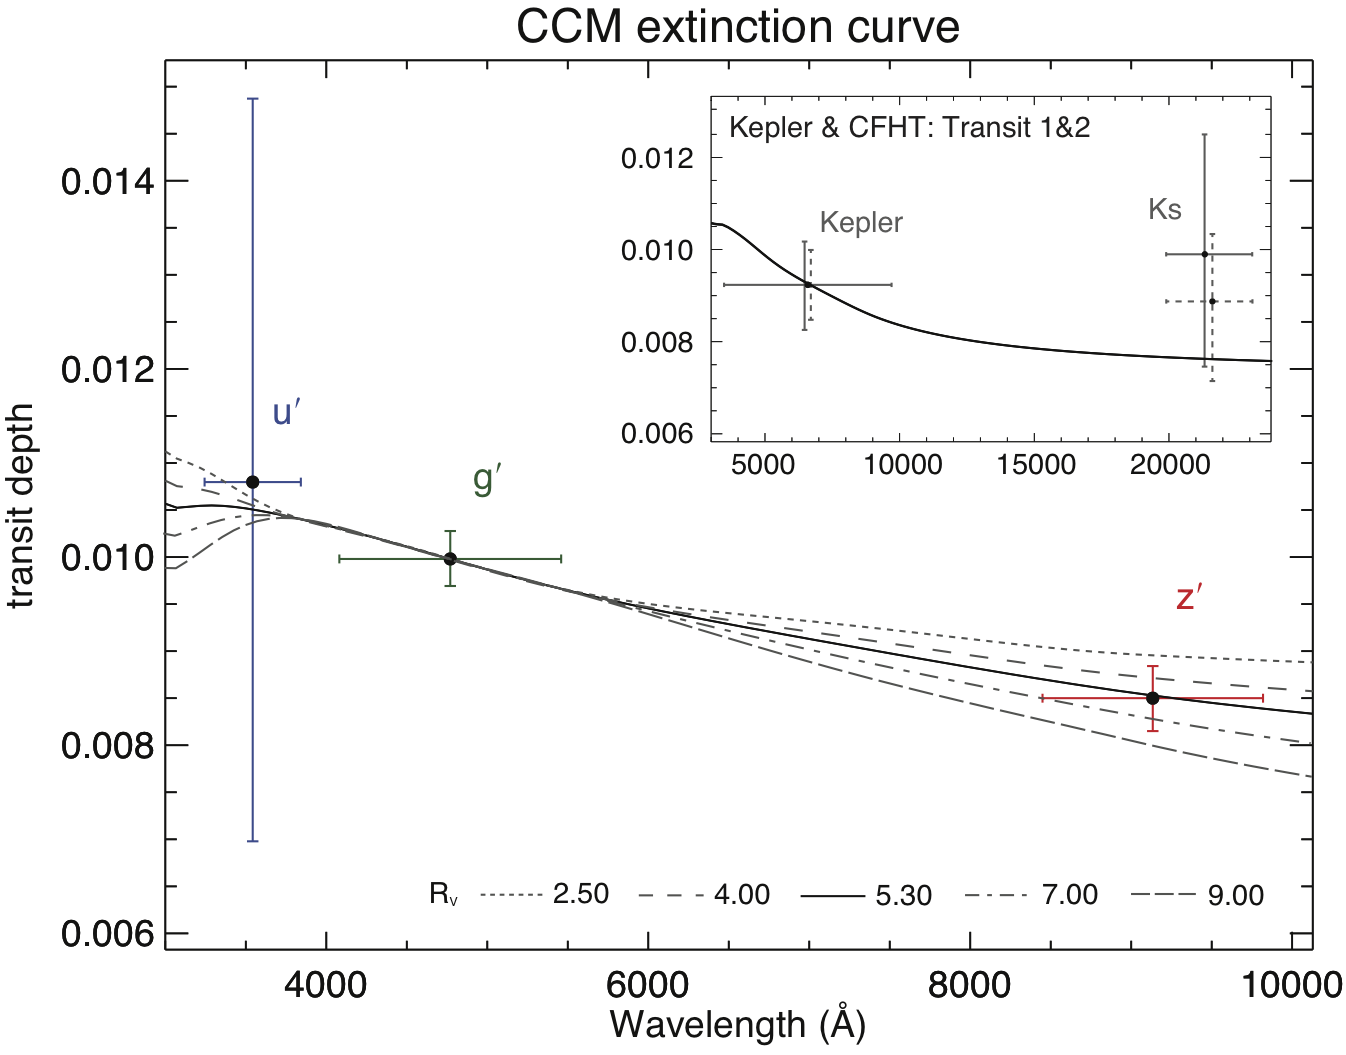
We modelled our Night 1 scaled Kepler depths with the Cardelli, Clayton & Mathis (1989, hereafter CCM89) interstellar extinction law to find that the extinction depths are broadly consistent with the wavelength-dependence of the reddening seen in the ISM (Fig. 4). This is strong independent and direct evidence in favor of the dust-cloud model for the transits. We constrained to the highest values found in the ISM: . As increases with the mean dust grain size (Mathis & Wallenhorst, 1981), the grain sizes we found in the KIC 1255 dust cloud on Night 1 are comparable to the largest found in the ISM (0.25–1 depending on the grain composition, Mathis et al., 1977). We normalised and plotted the two transits from C14 in the inset to Figure 4; their color dependence is consistent with our fit, as well as with a constant transit depth. Note that the C14 transits were observed on a different night to our observations and hence a different grain size distribution might apply. The transits vary because the dust cloud is varying, and it is difficult to imagine a scenario where the irradiated dust cloud changes on planet-sized scales while the dust grains comprising it retain an identical size distribution.
| Filters | Night 1 | Night 2 | ||
|---|---|---|---|---|
| ’ | 0.0826 | 0.0922 | 0.023 | 0.029 |
| ’ | 0.0891 | 0.0999 | 0.035 | 0.037 |
| ’ | 0.090 | 0.104 | 0.097 | 0.137 |
| ’/’ | 1.079 | 1.084 * | 1.52 | 1.28 |
| mid-transit | mid-transit | |||
| ’ | 56487.9858 | 56487.9886 | 56499.103 | 56499.110 |
| ’ | 56487.9866 | 56487.9901 | 56499.092 | 56499.101 |
| ’ | 56487.986 | 56487.992 | 56499.106 | 56499.113 |
Square root of the transit depth from Kepler averaged profile fitting. Comparable to the value.
Transit time as defined in Croll et al. (2014a)
* Alternative result derived from the residual-permutation method is 1.084
3.3. Flares
We observed two potential flaring events in the ’ band on Night 1 (Figure 1), characterised by a sudden increase in brightness by approximately and with a similarly abrupt drop back to base level. On each of Nights 2 and 4 there were single similar events with amplitudes and respectively. None of our comparison stars showed anything similar, suggesting these are genuine astrophysical signals originating from KIC 1255. The atypical flare shape can be attributed to the faintness of the target coupled with the low effective cadence of our ’ band data hiding the exponential decay. On Night 1, the second flare overlaps in phase with a slight brightening in ’ band. Similarly on Night 2, a bright flare in the ’ band overlaps in phase with a brightening in both the ’ and ’ bands. To quantify the amount of extra emission expected in the ’, ’ and ’ bands, we modelled continuum or ‘white light’ flare emission as a blackbody curve with a temperature of 10,000 K and a variable fill factor, defined as the effective surface area of the star covered by the active region (Kowalski et al., 2010). We added this to the model spectral energy distribution for KIC 1255 (Howarth, 2011) and convolved the resulting artificial spectrum with filter responses for the SDSS and Kepler bands. The best fit to the observed ’ band flare signals was achieved for a fill factor of 0.013%, with a surplus flare to stellar flux ratio in the ’, ’, ’ and Kepler bands equal to , , and respectively. This shows that flares originating on KIC 1255 are expected to be brightest in the ’ band, with signal in the remaining SDSS bands comparable to our noise level.
The calculated surplus emission in the Kepler band is consistent with ‘white light’ flares observed on other K dwarfs (between and ; Walkowicz et al., 2011). If flares on KIC 1255 are similarly ‘white’ in nature, they should be borderline visible in the Kepler short-cadence photometry. We inspected all currently accessible short-cadence Kepler photometry (Q13-Q17) and found several similar brightening effects with an amplitude of up to 0.5% and duration between 30 and 90 minutes. These are consistent with our predictions, but also comparable to the Kepler photometric precision at . Additionally, a 1200 days long cadence Kepler light curve of KIC 1255 b shows at most three significant outliers that could be consistent with flaring events or simply outliers, the strongest having an amplitude of 3.5% (S. Rappaport & B. Croll 2015, private communication). Kawahara et al. (2013) found that KIC 1255 is capable of producing even brighter flares, with a brightness increase of up to on timescales of 30 minutes.
4. Discussion
We obtained multi-color optical light curves of the transits of KIC 1255 b. For the first time these transits are measured with sufficient precision to discern features of amplitude and duration minutes in an individual transit light curve. This permitted robust quantitative characterisation of the transit shape and depth on Night 1. We clearly detect a difference in depth between the ’ and ’ bands: visible in the lower panel of Figure 1 and quantified in Table 1 and Figure 3. We rule out the effects of limb darkening and starspots as significant contributions to this depth difference. The color dependence of the transit depth is consistent with extinction due to dust with grain sizes , where is the grain radius.
Eleven nights later, on Night 2 we detected much shallower ’ and ’ transits, with no detection of color dependence in the ’ and ’ depths (Table 1). The changing transit depth is probably primarily caused by changes in the quantity and spatial distribution of dust due to a limit-cycle behavior of the dust injection mechanism (R12). Clearly the dust cloud produces less extinction during the shallow and undetected transits than it did on Night 1. It would be very interesting to examine the color dependence of the transits at a variety of depths: this will reveal whether the grain size distribution changes with transit depth.
Figure 13 of C14 shows dust grain extinction efficiency as a function of for grain size and wavelength . For the efficiency plateaus at its peak value irrespective of composition. For smaller values of the extinction efficiency drops off in a composition-dependent way. As , this lessening of extinction efficiency with decreasing grain size would be most pronounced at long wavelengths. With further observations of quality comparable to Night 1, with transits of varying depths but deep enough for secure detections, we have the prospect of identifying the composition of the dust grains by matching the observed wavelength-dependent depth changes to one of the curves in Figure 13 of C14. In our 2013 campaign, we were extremely unlucky to observe rare shallow transits with depth (in ’) on four of the five nights we observed. Only two such quiescent periods were observed by W13 in years 2009 - 2013, amounting to of total Kepler observing time.
We have presented direct evidence that the variable transits in KIC 1255 b are due to an evolving cloud of dust attributable to mass loss from a disintegrating low-mass rocky planet.
Analysis of a larger number of transit light curves potentially offers the opportunity to measure the composition of the grains. This is an unprecedented opportunity to learn the make-up of a rocky extrasolar planet: further observations are urgently required.
References
- Ballerini et al. (2012) Ballerini, P., Micela, G., Lanza, A. F., & Pagano, I. 2012, A&A, 539, A140
- Bakos et al. (2011) Bakos, G. A., Hartman, J., Torres, G., et al. 2011, ApJ, 742, 116
- Borucki et al. (2009) Borucki, W. J., Koch, D., Jenkins, J., et al. 2009, Science, 325, 709
- Brogi et al. (2012) Brogi, M., Keller, C. U., de Juan Ovelar, M., et al. 2012, A&A, 545, L4 (B12)
- Brown et al. (2011) Brown, T. M., Latham, D. W., Everett, M. E. & Esquerdo, G. A. 2011, AJ, 142, 11
- Budaj (2013) Budaj, J. 2013, A&A, 557, A72 (B13)
- Carpenter & Bithell (2000) Carpenter, J. & Bithell, J. 2000, Statist. Med., 19, 1141-1164
- Carter & Winn (2009) Carter, J. A. & Winn, J. N. 2009, ApJ, 704, 51
- Cardelli, Clayton & Mathis (1989) Cardelli, J. A., Clayton, G. C. & Mathis, J. S. 1989, AJ, 345, 245 (CCM89)
- Claret & Bloemen (2011) Claret, A. & Bloemen, S. 2011, A&A, 529, A75
- Croll et al. (2014a) Croll, B., Rappaport, S., DeVore, J., et al. 2014a, ApJ, 786, 100 (C14)
- Croll et al. (2014b) Croll, B., Rappaport, S. & Levine, A. M. 2014b, arXiv:1410.4289
- Dhillon et al. (2007) Dhillon, V. S., Marsh, T. R., Stevenson, M. J., et al. 2007, MNRAS, 378, 3
- Eastman et al. (2013) Eastman, J., Gaudi, B. S. & Agol, E. 2013, PASP, 125, 83
- Fernández Fernández et al. (2012) Fernández Fernández, J., Chou, D.-Y., Pan, Y.-C., & Wang, L.-H. 2012, PASP, 124, 915
- Fukugita et al. (1996) Fukugita, M., Ichikawa, T., Gunn, J. E., et al. 1996, AJ, 111, 1748
- Haswell et al. (2012) Haswell, C. A., Fossati, L., Ayres, T., et al. 2012, AJ, 760, 79
- Howarth (2011) Howarth, I. D. 2011, MNRAS, 413, 3
- Howell (2006) Howell, S. B. 2006, Handbook of CCD astronomy (2nd ed.; Cambridge, UK: CUP)
- Kawahara et al. (2013) Kawahara, H., Hirano, T., Kurosaki, K., Ito, Y. & Ikoma, M. 2013, ApJ, 776, L6
- Kipping (2010) Kipping, D. M., 2010, MNRAS, 408, 3
- Kowalski et al. (2010) Kowalski, A. F., Hawley, S. L., Holtzman, J. A., Wisniewski, J. P. & Hilton, E. J. 2010, ApJ, 714, 1
- Mandel & Agol (2002) Mandel, K. & Agol, E. 2002, ApJ, 580, L171
- Mathis et al. (1977) Mathis, J. S., Rumpl, W. & Nordsieck, K. H. 1977, ApJ, 217, 425
- Mathis & Wallenhorst (1981) Mathis, J. S. & Wallenhorst, S. G. 1981, ApJ, 244, 483
- Perez-Becker & Chiang (2013) Perez-Becker, D. & Chiang, E. 2013, MNRAS, 433, 3
- Pont, Zucker & Queloz (2006) Pont, F., Zucker, S. & Queloz, D. 2006, MNRAS, 373, 231
- Pont et al. (2008) Pont, F., Knutson, H., Gilliland, R. L., Moutou, C. & Charbonneau, D. 2008, MNRAS, 385, 109
- Rappaport et al. (2012) Rappaport, S., Levine, A., Chiang, E., et al. 2012, ApJ, 762, 1 (R12)
- Rappaport et al. (2014) Rappaport, S., Barclay, T., DeVore, J., et al. 2014, ApJ, 784, 1
- Walkowicz et al. (2011) Walkowicz, L. M., Basri, G., Batalha, N., et al. 2011, ApJ, 141, 2
- van Werkhoven et al. (2013) van Werkhoven, T., Brogi, M., Snellen, I. A. G. & Keller, C. U. 2013, A&A, 561, A3 (W13)
- Winn et al. (2009) Winn, J. N., Holman, M. J., Henry, G. W., et al. 2009, ApJ, 693, 794