An Objective Definition for the Main Sequence of Star-Forming Galaxies
Abstract
The Main Sequence (MS) of star-forming galaxies plays a fundamental role in driving galaxy evolution and in our efforts to understand it. However, different studies find significant differences in the normalization, slope and shape of the MS. These discrepancies arise mainly from the different selection criteria adopted to isolate star-forming galaxies, that may include or exclude galaxies with specific star formation rate (SFR) substantially below the MS value. To obviate this limitation of all current criteria, we propose an objective definition of the MS that does not rely at all on a pre-selection of star-forming galaxies. Constructing the 3D SFR-Mass-Number plot, the MS is then defined as the ridge line of the star-forming peak, as illustrated with various figures. The advantages of such definition are manifold. If generally adopted it will facilitate the inter-comparison of results from different groups using the same star formation rate (SFR) and stellar mass diagnostics, or to highlight the relative systematics of different diagnostics. All this could help understanding MS galaxies as systems in a quasi-steady state equilibrium and would also provide a more objective criterion for identifying quenching galaxies.
Subject headings:
galaxies: evolution — galaxies: fundamental parameters — galaxies: high-redshift1. Introduction
The stellar mass and SFR of galaxies are fundamental quantities now being measured extensively, from low to the highest redshifts at which galaxies have been discovered. For star-forming (SF) galaxies the two quantities are tightly correlated with each other, to the extent that, following Noeske et al. (2007), such a correlation has got the designation of Main Sequence (MS) of star-forming galaxies. In a series of seminal papers (Noeske et al., 2007; Daddi et al., 2007; Elbaz et al., 2007) it was recognized that such tight correlation persists to at least redshift with nearly constant slope and dispersion compared to the correlation followed by SF galaxies in the local Universe (Brinchmann et al., 2004). Many subsequent studies have followed, confirming the existence of a MS, all the way to at least (Pannella et al., 2009; Peng et al. 2010, hereafter P10, ; Rodighiero et al., 2010, 2011, 2014; Karim et al., 2011; Popesso et al., 2011, 2012; Wuyts et al., 2011; Whitaker et al., 2012, 2014; Sargent et al., 2012; Kashino et al., 2013; Bernhard et al., 2014; Magnelli et al., 2014). Yet, slope, shape, dispersion and redshift evolution of the SFR correlation can vary quite dramatically from one study to another, with the logarithmic slope of the relation ranging from up to (see e.g. the compilation in Speagle et al. (2014)). In extreme cases, if galaxies are collected in a SFR-limited fashion, no appreciable MS is recovered and the SFR runs flat with stellar mass (Erb et al., 2006; Reddy et al., 2006; Lee et al., 2013), a result dominated by Malmquist bias as at low stellar masses only galaxies with SFR above threshold are recovered (Rodighiero et al., 2014).
One reason why the MS of one group may differ from that of another stems primarily from how galaxies are selected for being star forming. One may select them by a slightly mass-dependent color, picking blue cloud galaxies (as in P10), or using the two-color selection (Daddi et al., 2004, 2007; Pannella et al., 2009), or the rest-frame selection (Williams et al., 2009; Whitaker et al., 2012, 2014), or setting a minimum threshold for the specific SFR SFR/ (Karim et al., 2011). Ultimately, all these criteria cut out galaxies with low sSFR, but the threshold differ from one criterion to another, and in a manner that may depend on mass, SFR, reddening and redshift. Criteria that tend to select as SF massive galaxies with low (but detectable) SFR will return a flatter MS compared to criteria that would not qualify as SF the same galaxies. Clearly, the use of different criteria makes less comparable to each other the corresponding results and may fuel sterile debates as to which of such criteria should be preferable.
The importance of the MS comes from the fact that most stars in the Universe have formed in galaxies lying around it within about a factor of 2 in SFR. The mere existence of the MS, and its sharpness, indicate that there is order in nature, i.e., in the growth of galaxies, as opposed to mere stochasticity. It also implies that both the mass and SFR of high redshift galaxies must increase with time quasi-exponentially (Renzini 2009; P10, ; Maraston et al., 2010). The absolute value of the sSFR sets the clock of galaxy evolution (P10), setting the growth rate of individual galaxies and controlling their lifetime before they are quenched. The slope of the MS is directly connected to the (low-mass) slope of the mass function of star-forming galaxies, and if lower than unity would cause a runaway steepening of the mass function if not contrasted by a tuned rate of merging (Peng et al., 2014). Moreover, much interest there is on the relation between the MS and the specific rate of mass increase of the dark matter halos hosting them, a proxy of the rate of gas inflow fueling the SF activity (Bouché et al., 2010; Lilly et al., 2013; Peng & Maiolino, 2014). Finally, and perhaps most importantly, the SFR distance from the MS can be used to identify galaxies that do not qualify as belonging to the MS, such as starburst outliers on one side and, on the other side of the MS, those that have started the quenching process and, while still star forming, are in transition towards pure passive evolution.
For all these reasons, a more objective definition of the MS of SF galaxies is in order: one which should not rely at all on such a pre-selection. In this paper we accordingly propose a definition of the MS and suggest it should be generally adopted. Stellar masses and SFRs can be measured in many different ways, e.g., for the SFR using several different indicators through the whole electromagnetic spectrum, and the choice will depend on the available data and on the redshift of the sample. We emphasize that we are not proposing a universal way of measuring SFRs (and masses), our goal is instead to objectively define the MS once the measurements have been made, whatever measurement procedures were used. Still, such objective definition for the MS should also help quantify the relative systematics of different SFR and mass diagnostics.
2. The 3D SFR-Mass-Number Plots
We select galaxies from the Sloan Digital Sky Survey (SDSS) DR7 release (Abazajian et al., 2004) for lying at and having a reliable spectroscopic redshift. Having excluded AGNs, this has provided a sample of galaxies for which SFRs have been estimated from their H flux and their stellar masses from SED fits, following the same procedures as in Brinchmann et al. (2004) and P10, with the exception that there SFRs were derived from SDSS DR4 release. Galaxies were weighted by the method for masses below the completeness limit. This dataset is ideal for our purposes, because of its exquisite statistics, highly reliable redshifts and homogeneity in SFR and mass estimates. However, the same procedure can be repeated at higher redshifts as well, though other SFR diagnostics may have to be used.
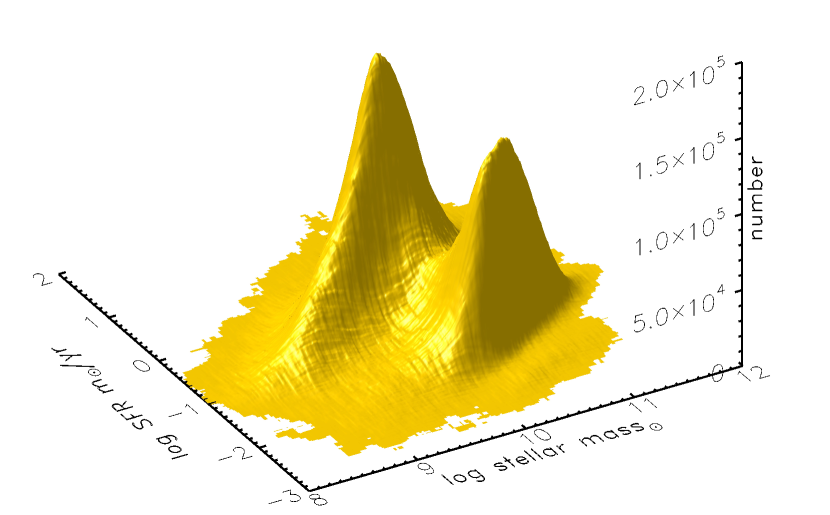
Figure 1 shows the 3D SFR-Mass-Number plot, consisting of the SFR relation where the third dimension gives the number of galaxies in fixed-size (0.20.2 dex) SFR bins. The two peaks correspond to actively SF galaxies, on the West side, and quenched galaxies, on the East side of the plot. Notice how sharp is the divide of the SF peak. Besides error effects, the saddle between the two peaks must include a mixture of galaxies, with some being in a temporary excursion to a low SFR coming from the SF peak, others are in a temporary excursion from the quenched peak, triggered by a minor gas-rich accretion event, whereas others are truly quenching galaxies on their final journey from the SF peak to the quenched galaxies depository. The number of quenched galaxies increases continuously from high to low redshifts, so across the valley the flow from the SF to the quenched peak must dominate.
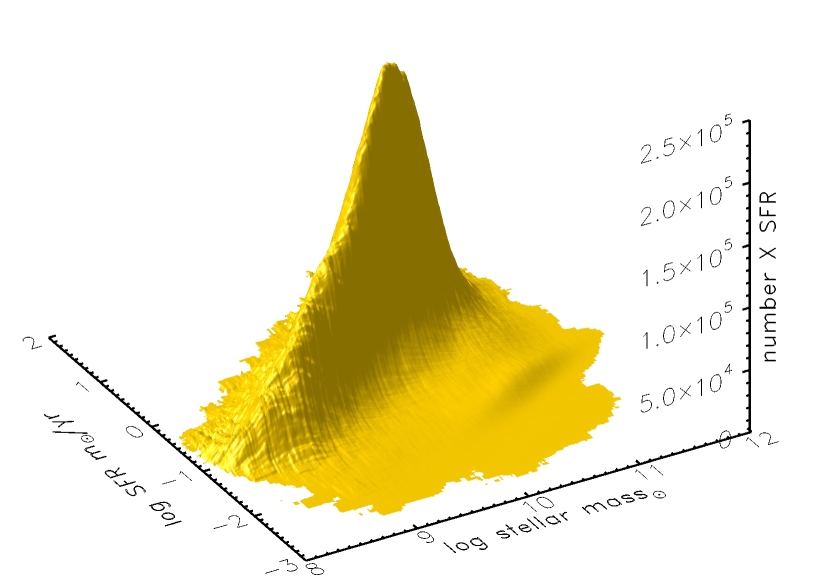
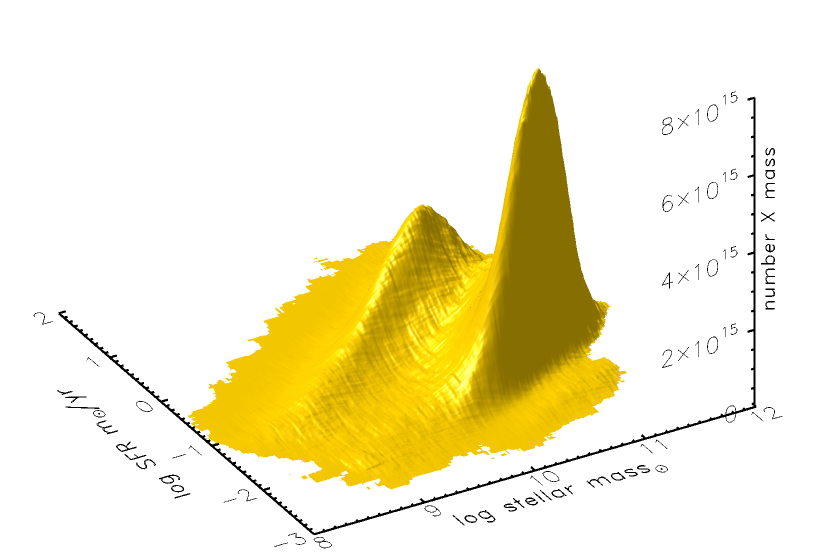
In the 3D plot of Figure 2 the third dimension gives the product of the number of galaxies times their SFR, thus illustrating with extreme clarity where in the SFR plane star formation is concentrated. Similarly, in Figure 3 the third dimension now gives the product of the number of galaxies times their mass, hence illustrating where the stellar mass resides.
In Figure 2 the quenched galaxies virtually disappear, as most of the star formation concentrates on the main peak. The modest bump noticeable South-East of the main SF peak is due to a low level of star formation still present in a fraction of quenched galaxies, although just upper limits to SFR might have been measured for many of them. For this reason, the shape of the quenched peak (especially on its low SFR side) should not be overinterpreted. A comparison of the two figures shows that the main peak has shifted from the star-forming to the quenched one, as indeed most stars in the local Universe are contained in quenched galaxies and bulges (Baldry et al., 2004).
A comparison of these three figures reveals that there is a fair number of galaxies in the valley between the two peaks (Figure 1) that indeed contribute to mass (Figure 3) but not much to SFR (Figure 2).
3. An Objective Main Sequence Definition
As the importance of the MS stems from its dominant contribution to the global star formation, it is worth rooting more deeply in this qualifying property its very definition. The sharpness of the SF peak in Figure 1 and Figure 2 offers indeed a quite natural definition of the MS as the ridge line of the SF peak, either in the 3D number or in the 3D numberSFR plots, as the two divides nearly overlap each other. These 3D figures offer unquestionable evidence for the existence of the MS as well as of its more natural, cogent definition. This ridge line coincides with the mode of the SFR distribution at fixed . The median or the average SFR (at fixed ) might be measured more accurately, but would depend on a pre-selection of star-forming galaxies. The ridge line, instead, does not require such pre-selection111The ridge/mode line was originally used by Brinchmann et al. (2004) (see also Salim et al. 2007) to fit the SF sequence in SDSS, but all subsequent studies adopted a pre-selection of SF galaxies to define the MS.. Stacking e.g., infrared or radio data has been widely used to trace the MS (e.g., Pannella et al. 2009; Karim et al. 2011; Rodighiero et al. 2014) but it requires pre-selecting SF galaxies, hence the result depends on the selection criterion.
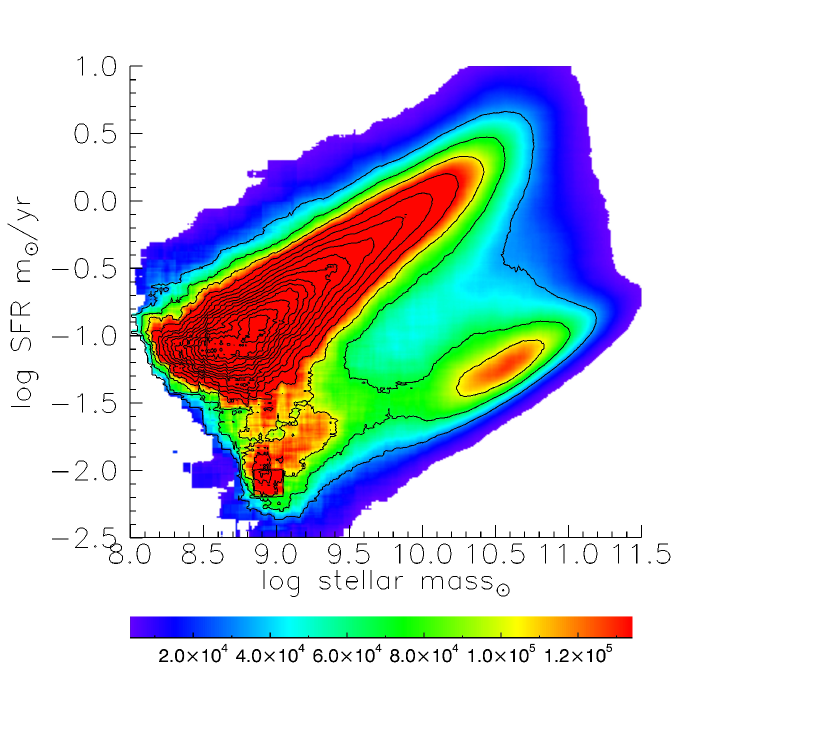
Figure 4 shows the projection of the the 3D surface in Figure 1 over the SFR plane, along with contours for the number density of galaxies. Several notable features are emerging from this plot. The best straight-line fit to the ridge line is log(SFR) = , with a slightly flatter slope than derived in P10 for color selected blue galaxies in the same catalog, which was . This difference arises from the combination of two effects: the use of SDSS DR7 instead of the DR4 release; in addition, the color cut included several galaxies with and with SFR definitely below the ridge line, that we may interpret as quenching galaxies.
Figure 4 shows that the ridge line is straight linear up to the highest stellar masses in the sample, without a hint of flattening with increasing mass (see also Brinchmann et al. 2004. A bending of the main sequence could be due to the growing fraction of the total mass being given by bulges already quenched, hence contributing mass but no star formation (e.g., Whitaker et al. 2012). We don’t see this effect in Figure 4 (up to ), even though bulges should be maximally developed at . Rather, the increasing bulge fraction with galaxy mass may be responsible for the global deviation from of the slope of the SFR relation (Abramson et al., 2014).
For galaxies away from the MS peak Figure 4 shows that quenched galaxies populate two distinct peaks, one at high mass and one a low mass, which result from the double-Schechter shape of their mass function (Baldry et al. 2004; P10). The high-mass peak is well separated from the MS, with very few galaxies with intermediate SFRs. The low-mass peak is instead connected in a continuous fashion to the MS, with many transition objects in between. This has a similar counterpart in the color-mass plot, where at low masses the distinction between blue and red galaxies gets blurred (Taylor et al., 2015). In the frame of the P10 distinction between mass-quenched and environment quenched galaxies, the high-mass peak can be attributed to mass-quenching and the low-mass one to environment quenching.
The sharp dichotomy between the high mass, quenched galaxies and those populating the MS arises from two effects. The first, probably not the dominant one at this low redshift, is that the mass quenching process may be very fast, ensuring a rapid transition from the MS to the quenched galaxy repository. The second reason, that we believe is dominant at low redshifts, is that most massive galaxies were quenched a long time ago, so one expects very few to be in a transition phase now. Indeed, the stellar population properties of local massive early type galaxies (including ellipticals) indicate that in most cases quenching took place some 10 Gyr ago (see e.g., Renzini 2006, for a review). This interpretation is confirmed by the fact that virtually all massive ETGs are already in place at (Cimatti, Daddi & Renzini, 2006), and therefore we do not expect much mass quenching of massive galaxies to take place now.
The situation is just the opposite at low-masses. The environment quenching rate increases with decreasing redshift, following the growth of large scale structure overdensities, and therefore is maximum at redshift zero. Indeed, it is well know that the number density of quenched galaxies increases by a factor of since (e.g., Bell et al. 2004), which is largely due to the increase in the number of low-mass quenched galaxies, whereas the number of massive quenched galaxies is stable in this redshift range.
To illustrate our proposal, this paper is limited to use data relative to the local Universe, but it is of great interests to follow the evolution of these 3D surfaces as a function of redshift, looking at how the twin peaks and the galaxy population of the (“green”) valley between them are changing with time. Such surfaces can be used to trace the MS divide at the various redshifts, which should be feasible even if current galaxy samples at high redshifts are not as populous as those used here. This extension to higher redshifts is left to future works, but here we can venture in making explicit a few expectations. At redshift one expects to find a very different pattern for quenched galaxies compared to what shown in Figure 4: mass quenching must have started at full steam (massive galaxies are growing very rapidly and very rapidly must be quenched). Instead, environment quenching has barely started, as overdensity contrasts are still small. One therefore expects the high-mass peak of quenched galaxies to be already in place and growing rapidly, whereas the low mass peak should be barely noticeable. The flow of galaxies across the green valley should be high at high masses, low at low masses.
These considerations may help understanding why in -selected samples of SF galaxies Whitaker et al. (2012) find a flattening of the SFR relation in high-mass galaxies at high redshifts, whereas Whitaker et al. (2014) find a steepening of the relation for low-mass galaxies at low redshift. In the former case the flattening may be due to the inclusion of massive galaxies already in their mass-quenching phase, whereas the steepening at low redshifts is likely due to the inclusion of low-mass galaxies in their environment-quenching phase (such as those seen in Figure 4).
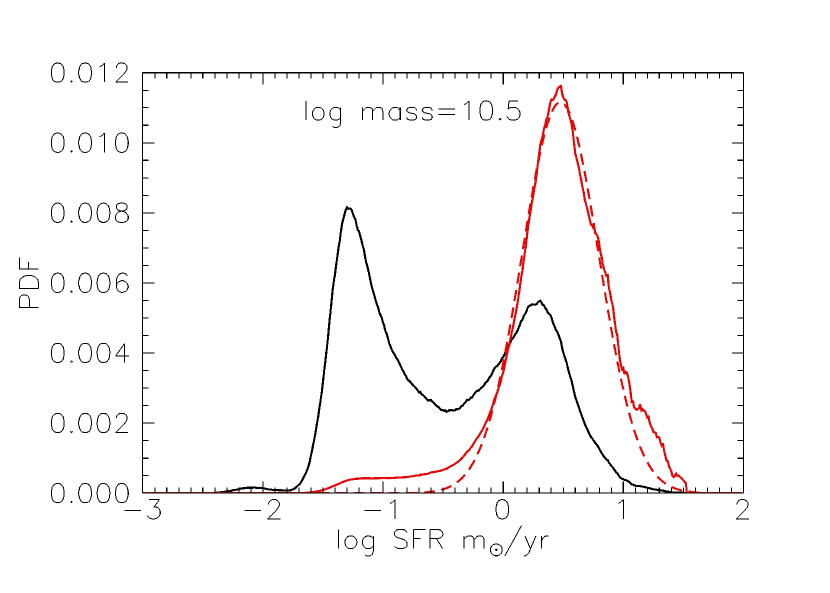
Finally, Figure 5 shows a section of the twin peaks at log, for both the number and the numberSFR distributions. The shape of the distribution of the quenched peak is affected by the large number of galaxies for which just SFR upper limits. More interesting is instead the distribution of the star-forming peak. The of its best fit Gaussian is 0.3 dex, which comes from a combination of intrinsics spread and measurement errors (Salmi et al., 2012). We can notice two deviations from gaussianity in the wings of the distribution. On the low SFR side the excess w.r.t. the best fit Gaussian is due to quenching galaxies, whereas at the opposite extreme the excess is likely due to starburst outliers from the MS. Notice also that there is a dex shift in the peak of the pure number distribution and the numberSFR distribution, a shift that is independent of mass: the ridge lines of the two surfaces run parallel to each other with a 0.2 dex difference and one can choose one or the other as the MS divide.
4. Conclusions
We have proposed to objectively define the Main Sequence of star-forming galaxies as the ridge line in the 3D surface defined by the SFR-mass-number relation, or nearly equivalently in the surface in which the third dimension is the product numberSFR. These surfaces can be constructed with very great statistical significance for the local sample of SDSS galaxies, and provide a vivid, cogent view of the reality of the MS as a major property of galaxy populations. Such definition can be applied to samples galaxies at high redshifts as well, though with somewhat lesser statistical significance while different SFR indicators may have to be used in different redshift ranges. However, with the advent of near-IR multiobject spectrographs SFRs from H can be derived up to , i.e., using the same indicator as used here for local galaxies (e.g., Kashino et al. 2013; Steidel et al. 2014; Wisnioski et al. 2009).
We emphasize that according to the new definition the MS of local, low galaxies is indeed a straight line, with no sign of steepening at low masses or of flattening at high masses, features that may emerge when pre-selecting star-forming galaxies before constructing the MS. The logarithmic slope of the SFR relation is found to be 0.76 with the new definition of the MS, whereas it is 0.9 when using a color pre-selection as in P10, though part of the difference comes from using SDSS DR7 as opposed to DR4 data.
A projection of the SFRNumber relation over the SFR plane reveals the existence of a number of low-mass galaxies with sub-MS SFRs, that we interpret as being undergoing environmental-quenching of their star formation, as expected in the phenomenological model of P10. At the opposite mass end, very few galaxies are now found in the course of their mass-quenching, as indeed the model predicts that most of mass-quenching should have taken place at higher redshifts.
In summary, we propose a definition for the MS which does not require a pre-selection of SF galaxies, which should facilitate the inter-comparison of results from different groups, help understanding MS galaxies as systems in a quasi-steady state equilibrium and especially provide a more objective criterion for identifying quenching galaxies.
Acknowledgments
We are grateful to Marcella Carollo, Natascha Förster Schreiber and Simon Lilly for useful discussions on these matters. AR acknowledges support from a INAF-PRIN-2012 grant.
References
- Abazajian et al. (2004) Abazajian, K.N. et al. 2007, ApJS, 182, 543
- Abramson et al. (2014) Abramson, L.E., Kelson, D.D., Dressler, A., Poggianti, B., Gladders, M.D., Oemler, A. Jr. & Vulcani, B. 2014, ApJ, 785, L36
- Baldry et al. (2004) Baldry, I.K., Glazebrook, K., Brinkmann, J., Ivezic, Z., Lupton, R.H., Nichol, R.C. & Szalay, A.S. 2004, ApJ, 600, 681
- Bell et al. (2004) Bell, E.F., Wolf, C., Meisenheimer, K., Rix, H.-W., Borch, A. et al. 2004, ApJ, 608, 752
- Bernhard et al. (2014) Bernhard, E., Béthermin, M., Sargent, M., Buat, V., Mullaney, J. R. et al. 2014, MNRAS, 442, 509
- Berta et al. (2013) Berta, S., Lutz, D., Santini, P., et al. 2013, A&A, 551, A100
- Béthermin et al. (2010) Béthermin, M., Dole, H., Beelen, A., & Aussel, H. 2010, A&A, 512, A78
- Bouché et al. (2010) Bouché, N., Dekel, A., Genzel, R., Genel, S.,Cresci, G., Förster Schreiber, N. M., Shapiro, K. L. et al. 2010, ApJ, 718, 1001
- Brinchmann et al. (2004) Brinchmann, J., Charlot, S., White, S. D. M., Tremonti, C., Kauffmann, G., Heckman, T., & Brinkmann, J. 2004, MNRAS, 351, 1151
- Cimatti, Daddi & Renzini (2006) Cimatti, A., Daddi, E. & Renzini, A. 2006, A&A, 453, L29
- Daddi et al. (2004) Daddi, E., Cimatti, A., Renzini, A. et al. 2004, ApJ, 617, 746
- Daddi et al. (2007) Daddi, E., Dickinson, M., Morrison, G. et al. 2007, ApJ, 670, 156
- Elbaz et al. (2007) Elbaz, D., Daddi, E., Le Borgne, D. et al. 2007, A&A, 468, 33
- Erb et al. (2006) Erb, D. K., Steidel, C. C., Shapley, A. E., et al. 2006, ApJ, 647, 128
- Förster Schreiber et al. (2009) Förster Schreiber, N. M., Genzel, R., Bouché, N., et al. 2009, ApJ, 706, 1364
- Ilbert et al. (2010) Ilbert, O., Salvato, M., Le Floc’h, E. et al. 2010, ApJ, 709, 644
- Karim et al. (2011) Karim, A., Schinnerer, E., Martinez-Sansigre, A. 2011, ApJ, 730, 61
- Kashino et al. (2013) Kashino, D., Silverman, J. D., Rodighiero, G., Renzini, A., et al. 2013, ApJ, 777, L8
- Lee et al. (2013) Lee, N., Sanders, D. B., Casey, C.M., Scoville, N. Z., Hung, C., Le Floc’h, E., Ilbert, O. et al. 2013, ApJ, 778, 131
- Lilly et al. (2013) Lilly, S. J., Carollo, C. M., Pipino, A., Renzini, A., & Peng, Y. 2013, ApJ, 772, 119
- Magnelli et al. (2014) Magnelli, B., Lutz, D., Saintonge, A., Berta, S., Santini, P.; et al. 2014, A&A, 561, A86
- Maraston et al. (2010) Maraston, C., Pforr, J., Renzini, A., et al. 2010, MNRAS, 407, 830
- Noeske et al. (2007) Noeske, K. G., Weiner, B. J., Faber, S. M. et al. 2007, ApJ, 660, L43
- Pannella et al. (2009) Pannella, M., Carilli, C. L., Daddi, E. et al. 2009, ApJ, 698, L116
- (25) Peng, Y.-j., Lilly, S.J., Kovac, K. et al. 2010, ApJ, 721, 193 (P10)
- Peng et al. (2014) Peng, Y.-j., Lilly, S.J., Renzini, A., & Carollo, C.M. 2014, ApJ, 790, 95
- Peng & Maiolino (2014) Peng, Y. & Maiolino, R. 2014, MNRAS, 443, 3643
- Popesso et al. (2011) Popesso, P., Rodighiero, G., Saintonge, A., Santini, P., Grazian, A., Lutz, D., Brusa, M. et al. 2011, A&A, 532, A145
- Popesso et al. (2012) Popesso, P., Biviano, A., Rodighiero, G., Baronchelli, I., Salvato, M., Saintonge, A., Finoguenov, A. et al. 2012, A&A, 537, A58
- Reddy et al. (2006) Reddy, N. A., Steidel, C. C., Fadda, D., Yan, L., Pettini, M., Shapley, A. E., Erb, D. K., & Adelberger, K. L. 2006, ApJ, 644, 792
- Reddy et al. (2012) Reddy,N., Dickinson, M., Elbaz, D. et al. 2012, ApJ, 744, 154
- Renzini (2006) Renzini, A. 2006, ARA&A, 44, 141
- (33) Renzini, A. 2009, MNRAS, 398, L58
- Rodighiero et al. (2010) Rodighiero, G., Cimatti, A., Gruppioni, C. et al. 2010b, A&A, 518, L25
- Rodighiero et al. (2011) Rodighiero, G., Daddi, E., Baronchelli, I. et al. 2011, ApJ, 739, L40
- Rodighiero et al. (2014) Rodighiero, G., Renzini, A., Daddi, E., Baronchelli, I., Berta, S., Cresci, G., Franceschini, A. et al. 2014, MNRAS, 443, 19
- Salim et al. (2007) Salim, S., Rich, R. M., Charlot, S., Brinchmann, J., Johnson, B.D. et al. 2007, ApJS, 173, 267
- Salmi et al. (2012) Salmi, F., Daddi, E., Elbaz, D., Sargent, M. T., Dickinson, M., Renzini, A., Béthermin, M. & Le Borgne, D. 2012, ApJ, 754, L14
- Santini et al. (2009) Santini, P., Fontana, A., Grazian, A., et al. 2009, A&A, 504, 751
- Sargent et al. (2012) Sargent, M. T., Béthermin, M., Daddi, E. & Elbaz, D. 2012. ApJ, 747, L31
- Speagle et al. (2014) Speagle, J. S., Steinhardt, C. L., Capak, P. L. & Silverman, J. D. 2014, ApJS, 214, 15
- Steidel et al. (2014) Steidel, C.C., Rudie, G.C., Strom, A.L.; Pettini, M., Reddy, N.A. et al. 2014, ArHiv:1405.5473
- Taylor et al. (2015) Taylor, E.N., Hopkins, A.M., Baldry, I.K., Bland-Hawthorn, J., Brown, M. J. I., Colless, M. et al. 2015, MNRAS, 446, 2144
- Whitaker et al. (2012) Whitaker, K.E., Van Dokkum, P.G., Brammer, G. & Franx, M. 2012, ApJ, 754, L29
- Whitaker et al. (2014) Whitaker, K.E., Franx, M., Leja, J., van Dokkum, P. G., Henry, A., Skelton, R.E., Fumagalli, M. et al, 2014, ArXiv:1407.1843
- Williams et al. (2009) Williams, R.J., Quadri, R.F., Franx, M., van Dokkum, Pi. & Labbé, I. 2009, ApJ, 691, 1879
- Wisnioski et al. (2009) Wisnioski, E., Förster Schreiber, N.M., Wuyts, S., Wuyts, E., Bandara, K. et al. 2014, ArXiv:1409.6791
- Wuyts et al. (2011) Wuyts, S., Förster Schreiber, N.M., van der Wel, A. et al. 2011, ApJ, 742, 96