Apparent corrugation variations in moiré patterns of dislocated graphene on Highly Oriented Pyrolytic Graphite and the origin of the van Hove singularities of the moiré system
Abstract
Moiré patterns on Highly Oriented Pyrolytic Graphite surfaces due to dislocated graphene layers were studied. We observed that the apparent corrugations of the moiré patterns in scanning tunnelling microscopy images change as a function of tunnel junction bias. A simple geometric investigation of the atomic structure of the graphene layers generating moiré patterns revealed that different atomic arrangements due to different twist angles can result in similar geometric moiré periods such that, only a small fraction of the observed moiré periodicities may coincide with the real atomic periodicity generating the moiré system. Ab initio calculations showed that the band structure of moiré patterns exhibit the fingerprints of those of bilayer graphene system preserving the Dirac cone. Moreover, our calculations in view of the correct atomistic modelling of the moiré patterns showed that van Hove singularities in twisted bilayer graphene system with varying angles have different origins in their respective band structures. Consequently, our results shed light on the graphene like behaviour of the top most dislocated graphene layer on HOPG surfaces by showing that the layer does not act alone but the final graphene bilayer has electronic properties partially resembling graphene.
pacs:
68.35.Dv, 73.20.-r, 68.37.Ef, 73.22.Pr, 61.48.Gh, 71.20.-b, 81.05.ufI Introduction
Highly Oriented Pyrolytic Graphite (HOPG) can be considered as the drosophila of surface science, especially for the scanning probes. HOPG is a quite popular crystal in experimental studies especially in surface science because of its smooth and chemically inert surface. It is widely employed as a calibration sample for scanning tunnelling microscopy (STM) studies, as well as for educational purposes Zhong et al. (2003); Tomanek et al. (1987); Albrecht et al. (1988); Wong and Durkan (2012); Cisternas et al. (2009). HOPG is composed of Bernal stacked Rong (1994); Wong and Durkan (2012); Cisternas et al. (2009) two dimensional hexagonal lattices, with carbon atoms at the lattice sites, popularly named as graphene layers Kolmogorov and Crespi (2005); Suárez Morell et al. (2013); Shallcross et al. (2010). Nearest neighbour carbon atoms in a layer are bonded strongly with each other, while the layers are coupled only by weak van der Waals interactions Novoselov et al. (2005); Geim and Novoselov (2007); Kolmogorov and Crespi (2005).
Super periodic features were observed on HOPG surfaces Albrecht et al. (1988); Kuwabara M, Clarke D.R. (1990); Rong and Kuiper (1993); Pong and Durkan (2005). Due to the weak van der Waals bonding between the layers of HOPG, topmost layer may be shifted or rotated by mechanical or chemical means. As a result of the rotation of the top layer, super-periodic structures called as moiré patterns form on HOPG Bernhardt et al. (1998); Pong and Durkan (2005); Wong et al. (2009); Wang et al. (2006) surfaces. Moiré patterns occur in nature and they are fascinating phenomena already optically, and when it comes to such structures at the atomic level, understanding their origin becomes even more tedious Pong and Durkan (2005); Miller et al. (2010); Campanera et al. (2007). Since the first observation of moiré patterns on HOPG surfaces with STM, their origin is still a matter of debate Albrecht et al. (1988); Bistritzer and MacDonald (2011a). Despite the fact that these formations were investigated in numerous studies, they are rediscovered in graphene research Lopes dos Santos et al. (2007); Latil et al. (2007); Campanera et al. (2007); Cisternas et al. (2008); Hass et al. (2008); Li et al. (2009a, b); Luican et al. (2011); Bistritzer and MacDonald (2011a); Voloshina et al. (2013). Due to its inevitable relevance to graphene based devices the importance of dislocated graphene on other graphene layers on various systems drew serious attention Lee et al. (2011); Hass et al. (2008); Novoselov et al. (2004); Trambly de Laissardière et al. (2010); Biedermann et al. (2009). Still the answers to the questions like ”When does the top most layer behave like graphene?”, or ”Will that layer have other electronic properties” remain yet to be settled. Localized effects also have to be understood and utilized or eliminated for any device application.
By means of Angle Resolved Photoemission Spectroscopy (ARPES) Hicks et al. (2011); Tejeda et al. (2012), Landau Level Spectroscopy (LLS) Luican et al. (2011); Li et al. (2009a, b) and Quantum Hall Effect (QHE) Lee et al. (2011); Moon and Koshino (2012) measurements the graphene like behaviour of top most layers were studied. The electronic structure of the moiré patterns and the van Hove (VHV) singularities observed on these systems were also intensively studied both theoretically and experimentally Li et al. (2009a); Brihuega et al. (2012); Luican et al. (2011); Bistritzer and MacDonald (2011b); Landgraf et al. (2013); Chu et al. (2013); Cisternas and Correa (2012); Moon and Koshino (2012); Yan et al. (2014). ARPES results suggest that the top most layers of Graphene/SiC system always behave like graphene Hicks et al. (2011) while the observed VHV singularities and LLS measurements suggest otherwise, by simply showing a rotational dependence Trambly de Laissardière et al. (2010); Brihuega et al. (2012); Luican et al. (2011); Yan et al. (2014). Moreover, the QHE measurements support LLS and VHV measurements. Although moiré patterns and their geometric structure were considered in all studies, effect of the real atomic conformation of the moiré patterns was not discussed in detail. The reason of the VHV singularities from the band structures of the moiré patterns is not complete yet, either. The lack of any moiré structure observation on HOPG by atomic force microscopy (AFM) is yet to be understood. So the question remains: ”Are these structures comparable to the optical moiré patterns or are they an outcome of the electronic structure of these systems?” The variation of the apparent corrugations of the moiré patterns on HOPG surfaces observed in STM measurements as a function of tunnel junction parameters were not investigated. In almost all the studies the corrugation was reported to be constant as a function of tunnel junction bias Pong and Durkan (2005) but for one Wong and Durkan (2011), where the change of moire corrugation as a function of distance from defects, in resamblance to Friedel oscillations, was discussed. Inexistance of the corrugation variation as a function of bias voltage was reported for moiré patterns observed on SiC Brihuega et al. (2012) as well.
Besides the experimental observations on HOPG and Graphene/HOPG systems, understanding these data became a challenging issue for theoretical studies. For instance, while the inspection of the HOPG surface became a benchmark for STM studies Selloni et al. (1985), explaining the surprising triangular structures in spite of the hexagonal lattice of graphite, which has two atoms in the surface unit cell, became a formidable challenge. Nevertheless, this was successfully answered by realizing that the b site carbon atom which sits at the center of underlying hexagonal carbon ring of the second layer has slightly higher local density of states (LDOS) around Fermi energy compared to the carbon atom sitting at the a site (see Figure 1a) of AB stacked graphite Tomanek et al. (1987); Tomanek and Louie (1988); Cisternas et al. (2009); Ondráček et al. (2011). Consequently, the first attempts to describe the reported STM images of moiré superstructures were based on this fact Xhie J., Sattler K., Ge M., Venkateswaran (1993), which had foreseen completely opposite bright regions. This was corrected by the model developed from the ab initio calculation for the DOS of AA, AB, and ABC stacked graphites Rong and Kuiper (1993). This successful latter model was extended to investigate in detail the moiré patterns on graphite Campanera et al. (2007). Obviously, all these approaches rely on perfect stacking results without performing a full Density Functional Theory (DFT) calculation on the rotated superstructures. Later on, some calculated STM images using different DFT based methods were reported on moiré superstructures due to twisted graphene layers on HOPG surfaces Cisternas et al. (2008, 2009); Cisternas and Correa (2012).
In this paper we report on the atomic structure of the moiré patterns on HOPG surfaces and we unequivocally show that many of the similar appearing moiré patterns in STM images do not have the same atomic sub-structure. We report the apparent height corrugation variations of moiré patterns as a function of tunnel junction bias measured with STM on HOPG surfaces for the first time. Our STS measurements and DOS calculations show that moiré structures behave more metallic than HOPG, but not graphene like. Our results show that the information on the real atomic structure leading to each moiré pattern is clearly invaluable for understanding the electronic structure of this system, as they show for the first time that van Hove singularities observed on different moiré systems do not have the same origin in their respective band structure.
II Experimental: Preparation and measurement of moiré patterns on HOPG
Various methods have been proposed for the preparation of moiré patterns on HOPG surfaces Bernhardt et al. (1998); Pong and Durkan (2005); Wong et al. (2009); Wang et al. (2006) besides the random encounters on HOPG as well as on other graphitic systems like SiC Brihuega et al. (2012) or multilayer graphene grown by Chemical Vapor Deposition (CVD) and transferred on to other substrates Luican et al. (2011). Reported chemical methods require time and extended processes, by means of which the HOPG crystal may be damaged permanently. We have prepared HOPG surfaces with moiré patterns on them by means of a very simple and repeatable method. We have discovered that simply by drop casting cyclohexane on to HOPG surfaces (SPITM grade 2 and 3) and letting the samples dry in a clean environment, many different moiré structures can be obtained 111Understanding the formation of moiré patterns on HOPG surface due to cyclohexane drop casting and drying process is beyond the scope of this present work and will be discussed elsewhere. Pure and fresh (VWRTM cyclohexane, HPLC grade) is used for each sample preparation. HOPG samples were thoroughly investigated by STM prior to cyclohexane drop casting. After the drop cast and drying process, we have checked all the surfaces by means of micro Raman spectroscopy for probable contamination or residue from the cyclohexane drop casting and drying method. There were no observable remnants. Rarely (1 in 50 tunnelling zones) native moiré patterns were observed on both pristine SPI grade-2 and grade-3 HOPG crystals. All the measurements reported here were performed under ambient conditions by use of a Nanosurf Easyscan2TM STM and mechanically cut tips. The experimental conditions were carefully controlled and a consistency checklist was developed 222Sample preparation procedure and the procedure we have developed to obtain consistent data is further explained in the supporting information. Many different moiré samples were prepared and investigated by use of different tips. On the same sample reliable and consistent measurements for longer than half a year were possible.
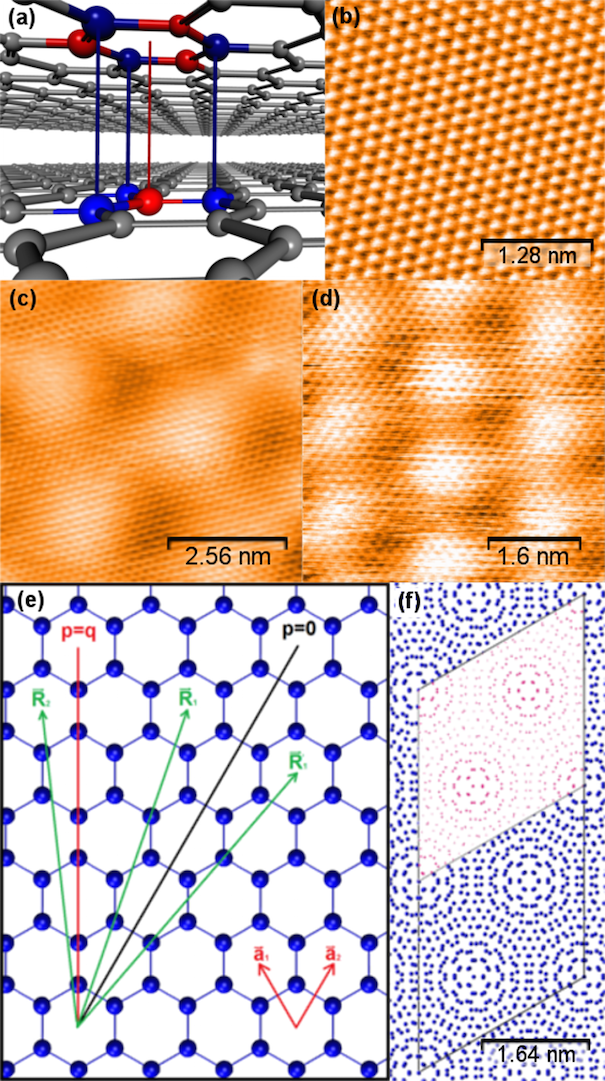
Since the site a atoms of the HOPG surface have less charge density compared to site b atoms (Figure 1a) STM gives triangular-atomic resolution on HOPG surfaces Cisternas et al. (2009), where only the b atoms were observed. In some cases by use of quite high tunnelling current measurements, a atoms can also be observed by low temperature STM Teobaldi et al. (2012). Intercalation of chemicals may result in hexagonal resolution Wang et al. (2006) on HOPG surfaces as well. On the moiré patterned graphene/HOPG samples we always obtained triangular resolution on pristine HOPG terraces just next to the moiré zones. More importantly, as shown in Figure 1c and d, it was possible to achieve atomic resolution on moiré patterns, simultaneously with the moiré structure observation. This was possible within a broad bias range (from 50 mV up to 800 meV). Still it was only possible to observe triangular atomic resolution on pristine HOPG terrace just next to the moiré zone, only by 50 meV, with the same tip during the same measurement. On clean monolayer graphene, transferred on to dielectric substrates, it was possible to obtain hexagonal-atomic resolution in STM measurements Ishigami et al. (2007); Yan et al. (2013). The lack of total hexagonal resolution, but rather a partial hexagonal resolution on moiré patterns indicate that top layer does not behave like graphene (Figure 1c and d). Rather it must be the property of the top most layers resulting in the moiré patterns.
III Theoretical
III.1 Methods
Efforts for understanding such intricate nature of the moiré structures by electronic structure calculations of the twisted graphene layers for different rotation angles were performed using different methods. The major difficulty of computational studies was the number of atoms within the unit cell, which depends on the rotation angle and increases enormously with decreasing angle Campanera et al. (2007). Because of this, several studies were based on continuum theory, which exploited the effective Hamiltonian describing the linear dispersion of Dirac cones of low energy excitations Lopes dos Santos et al. (2007, 2012); Mele (2010); Wallbank et al. (2013). There were tight binding calculations for the rotations, which can be described by a few thousands atoms within the unit cell Trambly de Laissardière et al. (2010, 2012); Landgraf et al. (2013). Accurate but computationally expensive ab initio calculations were very limited and only reported for relatively large rotation angles Trambly de Laissardière et al. (2010, 2012); Jung et al. (2014). Three different regimes emerged from these studies Trambly de Laissardière et al. (2010, 2012): (1) For large rotation angles, two layers decouple from each other, so the linearly dispersed bands of Dirac cones of top and bottom layer remain unchanged Latil et al. (2007); Shallcross et al. (2008). (2) In the intermediate regime, for rotation angles between 1∘ and 15∘, Fermi velocity renormalizes since the slope of linear Dirac bands decreases with decreasing rotation angle. Furthermore, the Dirac cone of the top layer and the rotated cone of the second layer intersect at finite energy so van Hove singularities emerge from these ”hybridized” bands and clearly they depend on the rotation angle Lopes dos Santos et al. (2007, 2012); Trambly de Laissardière et al. (2010, 2012). (3) Flat bands and vanishing velocities were reported for magical angles for rotations smaller than 1∘. Trambly de Laissardière et al. (2010, 2012); Bistritzer and MacDonald (2011b).
We used VASP for the first-principle plane-wave calculations that employ density functional theory by the projected-augmented-wave potentials Kresse and Hafner (1993); Kresse and Furthmüller (1996). GGA is used to express the exchange-correlation potential and plane-wave cut-off energy is set to 500 eV. The Brilluoin zone integrations were carried out by using k-point meshes based on Monkhorst-Pack scheme defined according to size of the system (moiré) unit cell, and the smearing parameter was set as 0.08 eV. The energy convergence was within eV accuracy while relaxing the systems electronically. In view of our calculations here we discuss the properties of moiré superstructures from the band structure and total density of states (DOS) as well as the STM images calculated by integrating the local density of states from the bias voltage () to the Fermi energy () as suggested by Tersoff and Hamann Tersoff and Haman (1983); Hamann and Tersoff (1985). Note that, it is necessary to use extremely dense k-point meshes in DOS calculations in order to avoid artificial oscillations and clearly show the features of van Hove singularities emerging in the DOS of the moiré systems. In order to understand the effects of bottom layers on the charge density profile of the top layer we performed some pre-calculations on AB stacked graphite. We increased the number of layers from two to six gradually and observed no significant difference in the charge density profile of the top layer around the Fermi level. Therefore, we describe moiré patterns by twisting a bilayer graphene system. We also performed tight binding (TB) calculations using the well-tested coupling parameters Tomanek and Louie (1988) in order to point out the critical differences with respect to ab initio calculations.
III.2 Modelling the moiré patterns: Real Moiré Periodicity vs. Geometric Moiré Periodicity
We apply a practical scheme to describe the moiré superstructure unit cell of twisted bilayer graphene as follows: Consider AA rather than AB stacked bilayer graphene as shown in Figure 1e where only the top layer atoms of the model are visible. We can write any lattice translation vector of the top layer as by using the lattice vectors and , where and are integers among themselves. In order to generate the unit cell of twisted bilayer graphene, we need to find the corresponding lattice translation vector of the bottom layer. can be defined as the mirror symmetry of with respect to p=0 line. Hence, becomes . The angle between the p=0 line and and the angle between the p=0 line and are same. Therefore, these two vectors coincide with each other on p=0 line by rotating the two layers towards this line by . (The angle of rotation of the top layer with respect to the lower layer within this scheme can be defined in terms of and as .) This rotated vector points to a lattice point of the twisted bilayer. The other lattice vector of this two dimensional lattice of twisted bilayer graphene can be calculated by rotating this lattice vector by /3 or 2/3. These two vectors define the primitive unit cell of moiré superstructure unless -=3k, k being an integer. If that is the case, the primitive unit cell can be defined from a shorter lattice vector as of which length is . Consequently, when is equal to one, 1/3 of all cases are special where real and observed (geometric) moiré periodicities (RMPs and GMPs) are equal, while for the rest real moiré periodicity is times larger than the observed super-periodic structure (see Figure 1f and Figure 2). If is not equal to one, then there are even less cases where GMPs are the same as RMPs. We have performed first principles calculations for and cases.
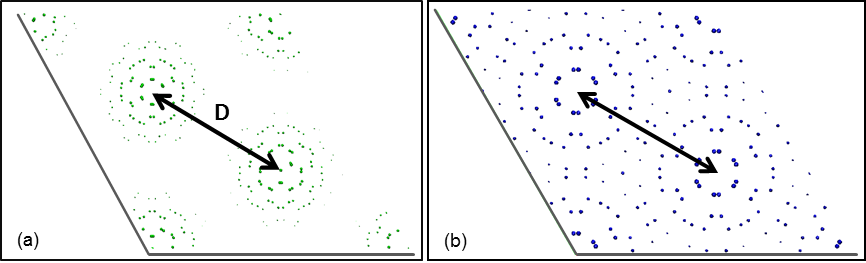
In Figure 1f the rotation angle of the graphene layer is 8.61∘ (=1 and =11). Upon investigating the centres of the round formations in such figures, they are observed to differ among themselves. Here the definitions of Real Moiré Periodicity (RMP) and Geometric Moiré Periodicity (GMP) become clear. In Figure 2a and b the calculated charge densities for two different systems, one being an RMP is different than GMP case and the other being a GMP is the same with RMP case, are given. In STM images such minute differences are almost impossible to identify and even in the model this small detail is easy to miss. In the literature moiré periodicities are assumed to follow the relation: D=a/(2sin(/2)) (where a is the lattice parameter) for bilayer graphene system. However, this relation only indicates the distance (D) between the two bright spots observed, which is the GMP (see Figure 2). Consequently, it would not be possible to deduct the real rotation angle using only the moiré periods resolved in STM images. In such a case one cannot expect similar electronic structure for two dissimilar atomic configurations. Still the DOS of these systems show some surprising similarities, like a dependence of the energetic positions of van Hove (VHV) singularities on the rotation angle, which is a really lucky coincidence, which will be discussed below.
We present two examples on the differences and similarities between RMPs and GMPs: When =1 and =7 and =2 and =15 cases are considered, their GMPs are 10.72 Åand 11.4 Årespectively, which is pretty close and almost impossible to identify from STM images. However, their RMPs are 10.72 Åand 39.59 Årespectively, which shows the drastic difference between the amounts of atoms to be considered in the unit cells of both systems. When, the rotation angles for these cases are compared, the required angle for =1 and =7 case is 13.17∘, whereas this is 12.35∘ for =2 and =15. Due to such minute differences in angles, and since in an STM data only GMPs can be clearly identified, the real value of the rotation angle may not be evaluated from STM data even if atomic resolution was achieved.
IV Results and Discussions
IV.1 Corrugation variation on moiré patterns as a function of tunnel junction bias
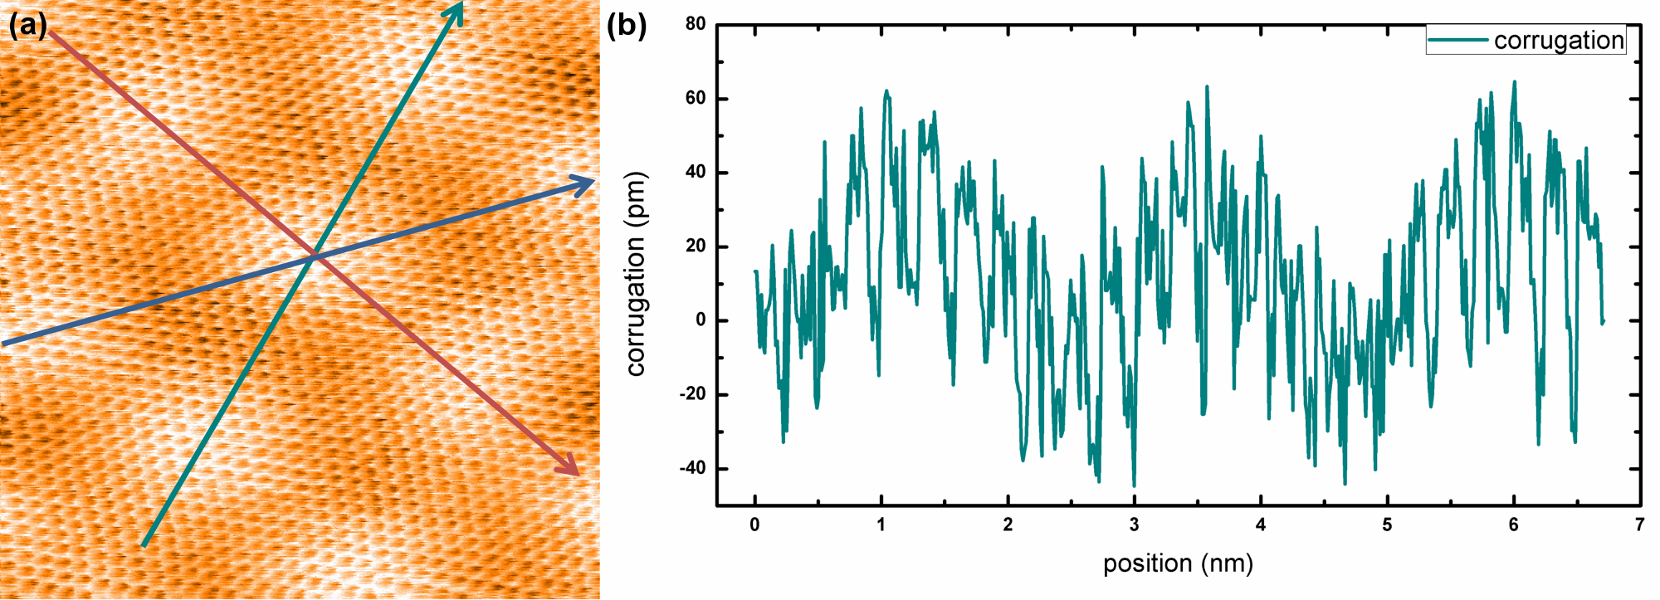
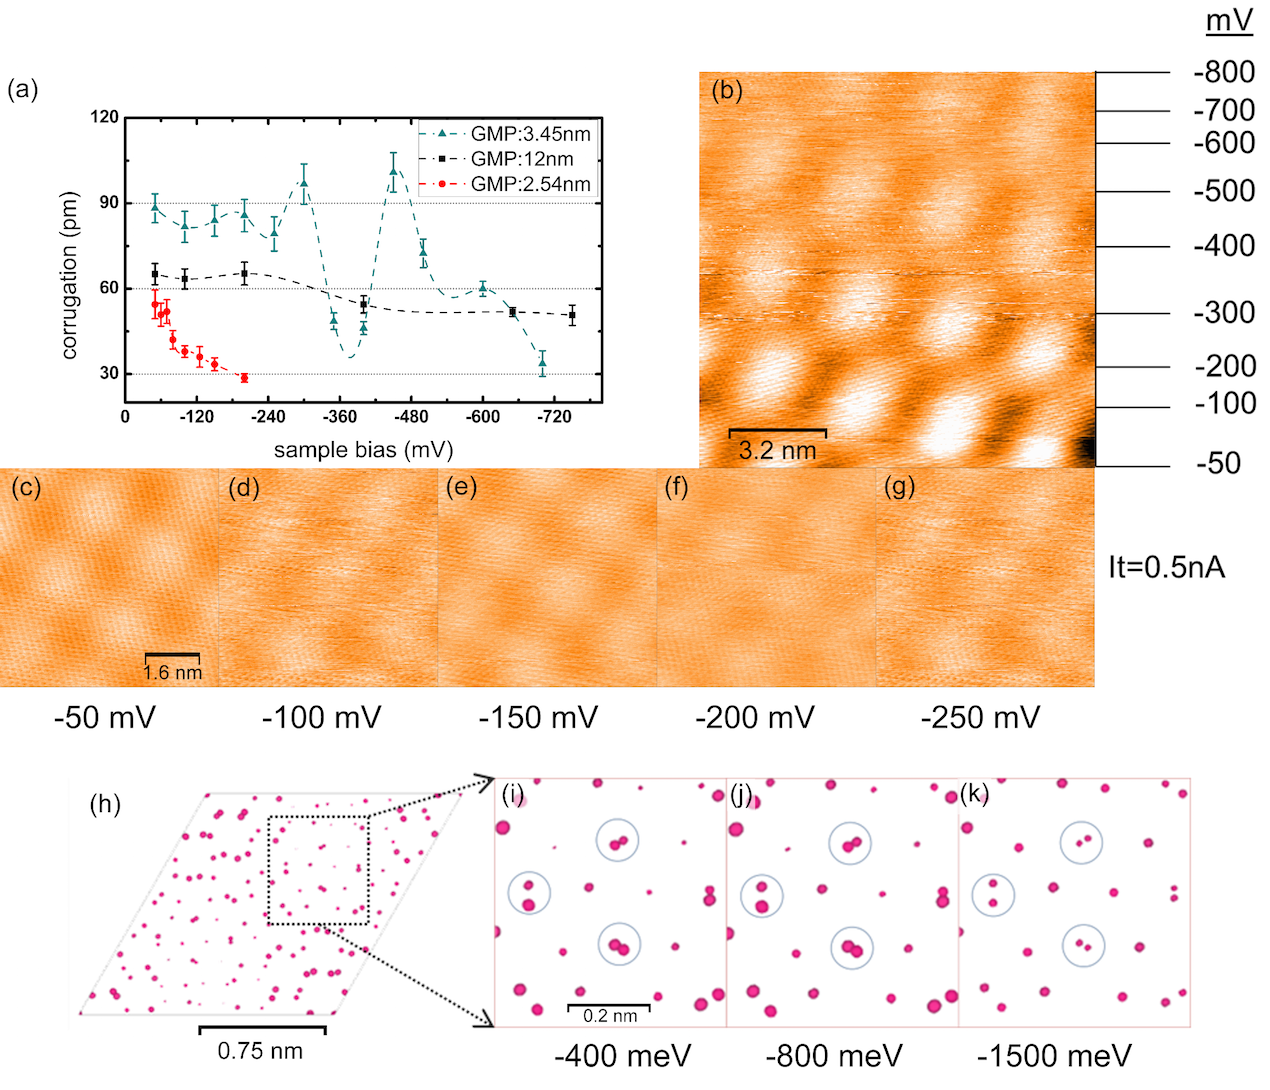
We collected STM images on various moiré patterns with varying tunnel junction biases while the tunnelling current was kept constant. During the measurements moiré structures were observed to be structurally stable. It was possible to observe atomic resolution on the moiré patterns and investigate both atomic corrugation along with the moiré corrugation by line scans as presented in Figure 3. For each moiré zone many STM images were obtained at different bias values while keeping the tunnelling current constant. Than on every image several line scans were taken along 3 symmetry directions. From these data corrugation values were obtained. This was performed at least on ten different positions on the same image and on all the moiré structures at every bias voltage measured. Various tunnel junction biases were used from 50 mV to 800 mV without damaging the moiré structures or the STM tip. In Figure 4a we show the variation of the apparent moiré corrugations observed on three different moiré patterns (with different GMPs) as a function of the tunnel junction bias. In Figure 4c-g we show that the atomic resolution was observable in a broad range of biases on this moiré pattern. Decreasing corrugation with increasing absolute value of tunnel junction bias was observed for these three super-periodic structures. Measured GMPs of these structures were 2.54 nm, 3.45 nm and 12 nm. While observed corrugation of two samples decreased with increasing tunnel junction bias, the third sample did not only show a decrease but also a varying behaviour in its apparent corrugation (both increasing and decreasing) as a function of increasing bias. In order to investigate the physical meaning of this apparent corrugation variation we have made a comparative charge density plot of the =1 =10 moiré system with RMP=GMP=1.5 nm, as a function of different energy windows from . These can be compared to different tip biases in STM measurements. Upon careful investigation of the local charge density distribution on the surface for the given energy window (i.e. Tersof-Haman calculated STM images), it is apparent that relative size of some of the charge density contours increase and than decrease with increasing bias (Figure 4i,j and k). It is clear that STM tip cannot attain such a high lateral resolution but rather an averaged out image was obtained. Still, such variations in the electronic structure can be observed as corrugation variations in STM images. Both our experimental and theoretical data indicate that the apparent corrugation of the super periodic structures (i.e. moiré patterns) varies with varying bias and this variance does not necessarily follow a decay. Such STM data and ab initio calculations show that the top most layer does not behave like graphene but the top two layers that generate the moiré patterns on the HOPG surface have a new electronic structure and the resulting surface may partially resemble graphene.
IV.2 Density of states of the moiré patterns
We performed scanning tunnelling spectroscopy (STS) measurements on moiré patterns as well as on clean HOPG terraces just next to the moiré patterned zones (Figure 5). The measured I-V curves were used for numerically calculating dln(I)/dln(V) vs. V curves which give the DOS of the surface of interest as commonly performed in the literature Gurlu et al. (2004). The immediate observation in the STS data is the relative metallic behaviour of the moiré zones compared to bare HOPG terraces as seen in Figure 5b and c. When the lineshapes of the STS curves are investigated, LDOS measurements of moiré areas have a larger curvature (more parabolic than linear) compared to the LDOS of HOPG terraces. This is an indicator of more metallic behaviour of the moiré zones compared to the HOPG terraces. Another important observation is the sharp van Hove like states in the calculated DOS of the moiré patterns, which were discussed intensively in the recent literature Li et al. (2009a); Brihuega et al. (2012); Chu et al. (2013); Hicks et al. (2011); Lopes dos Santos et al. (2007); Yan et al. (2014) . Several tight binding results were used to understand the nature of such features. According to previous reports energy values of the VHV singularities must follow a regular pattern as a function of the rotation angle of the top most layer. However, existence of a clear difference between GMPs and RMPs suggest a more complex nature and the answer to this complexity lies in the band structure of each moiré structure.
In Figure 5d and e we compare the band structures of the same moiré pattern calculated using two different methods, ab initio planewave pseudopotential and tight binding calculations, respectively. These energy band structures are presented along the symmetry lines between the high symmetry points of the Brillouin zone (BZ) of the moiré superstructure unit cell of twisted bilayer graphene as indicated in Figure 5f. General features of moiré band structures can be summarized as follows: There are linearly dispersed double degenerate bands around the K-point of moiré BZ. However, the slope of these bands, which sets the Fermi velocity, decreases with decreasing twist angle as consistent with the previous studies Trambly de Laissardière et al. (2010, 2012). The interaction of the twisted top layer with its bottom layer does not open a band gap. Similarly, direct band gap at point also depends on the twist angle. Interestingly, there are almost linear and flat bands between the and M points only in the ab initio calculated band structures. Similarly, some critical bands, as we will discuss below, between M and M′ points as well as between K and points are split in ab initio calculations while they are degenerate in tight binding results. Since the number of atoms within the moiré superstructure unit cell depends on the twist angle and increases enormously with decreasing rotation angle, in the literature most of the studies were based on tight binding calculations for the rotations, which can be described by a few thousands atoms within the unit. However, as we noted above there are some critical differences between the ab initio and tight binding results. These may happen because of two reasons: (1) self consistent calculations are important for correct description of charge density distribution and (2) the inter-layer interaction, so the inter-layer hopping term needs to be adjusted for tight binding calculations. We must once more point out that with the rotation of the top layer the continuously changing observable in the super structure is the GMP not the RMP. As a result the band structure calculations must be investigated by keeping the atomistic structure of these patterns in mind.
IV.3 Reason of van Hove singularities in the DOS of moiré patterns from their respective band structures
We focused on one of the special cases in which RMP and GMP coincides and compared it to one of the more common cases where RMP is times the GMP. Different types of critical points exist in the dispersion of two-dimensional structures like graphene. When the critical point is a minimum or a maximum, a step function singularity occurs in the density of states, while at the saddle points, a logarithmic singularity arises. Hence, in general, saddle points are responsible for sharp peaks in the DOS Hove (1953). A nice example of this van Hove (VHV) singularity is the sharp peaks around +1.5 eV and -2 eV at DOS of graphene (or graphite), which are due to the saddle points at M point of its BZ. In Figure 6a the band structure of =1 and =10 moiré is shown, which is one of the special cases where RMP is the same as GMP. In this system the rotation of the layers with respect to each other is 9.43∘ and the moiré period is 1.496 nm. When we inspect the band structure and corresponding DOS thoroughly, it is evident that the VHV originates from the saddle point of band edges between and M points, and in this case it is closer to the M point. We also show and discuss this in Figure 6d 333The origin of the van Hove singularities in the moiré system is described further in the supplementary video. In Figure 6b we present the band structure for one of the common cases, namely =1 and =12, which has a rotation angle of 7.93∘ with GMP of 1.78 nm and RMP of 3.082 nm. Again upon inspection of the band structure we see that the VHV of this case originate from the saddle point of the bands along the line connecting and K points. We can mark this between the M and M′ points as well (see Figure 5d and f). This is better visible in Figure 6e.
From our results it is clear that the VHV singularities occurring in the DOS of different moiré patterns do not have the same origin in their band structure and this is clearly related to the existence of GMPs and RMPs. So far this has not been recognized in the reported studies. Rather, the emergences of VHV singularities were associated to intersection of Dirac cones of top and bottom layer exactly at M point of moiré BZ. In Figure 6c, we present the iso-surface of the -band of the graphene band structure in the irreducible part of the graphene BZ around the K point. Essentially, this is a cosine band within tight binding approach and the linear part around the K point is known as Dirac cone. However, the Dirac cone diverges from a circular cone as the energy increases. We want to emphasize that the energies at which the VHV singularities occur are not close to the Fermi energy. On this band diagram, we highlighted the energies corresponding to the VHV singularities of the twisted bilayer graphene. The inner most curve corresponds to 100 meV. At this low energy the cross section is circular, which is in the linear part of the Dirac cone. Apart from these cases this constant energy cross section of -band of graphene is more triangular, which becomes clear at higher energies. Apparently, these are outside the low excitation region where the continuum theories are applicable. If we had linear Dirac cones, then the intersection of these cones from top and bottom layer should occur exactly at M point of moiré BZ. As more of such non-circular cones intersect each other, the intersection generating the VHV singularities diverges form linearity (M point is a special case). The cone intersection does not occur as commonly represented for bilayer graphene at small energy values around the K point. Consequently the cones emanating from the K points do not intersect at the same places in the BZ for every rotation angle, as exemplified in Figure 6d and e. Furthermore, this intersection point depends on the orientation of the moiré BZ, so the origin of VHV singularity in the special cases where GMP=RMP and general cases where they are not equal are completely different.
V Conclusions
Our combined STM and ab initio studies on the moiré patterns on HOPG surfaces clearly showed the importance of proper atomistic modelling of the moiré patterns on such systems. Although DOS of RMPs and GMPs might appear similar, the band structures of these systems differed in detail. The emerging VHV singularities in their respective DOS had completely different origins from the energy bands of corresponding moiré systems. We have shown that the corrugations of different moiré patterns change as a function of the tunnel junction bias differently from each other in STM measurements. Although STM may not have the necessary spatial resolution to image the localized charge distribution of these moiré structures, we have evidence, both theoretically and experimentally, that the corrugation of the moiré patterns do not change monotonically. While we show that the corrugation of the moiré structures is not constant as a function of energy, we also show evidence for the non-graphene like behaviour of the top most layer of the moiré structures. Rather, we have shown that the graphene bilayer system generating the moiré structures behave as a large molecule.
In this study we have shown a very simple, reliable and repeatable method of producing moiré patterns on HOPG surfaces without damaging the crystals. We have clear evidence that the moiré/HOPG systems are perfect for being studied under ambient conditions with STM. Finally our results indicate that although moiré patterns on HOPG surfaces have mainly an electronic origin, the corrugation measurements show the hint of a minute structural origin, which is yet to be tested.
Further measurements like dI/dV maps of the moiré patterns with high corrugation variance will also help understand the localized electronic structure of the moiré patterns. The corrugation variation of moiré systems are yet to be tested on SiC or graphene bilayers grown by CVD. Local electronic measurements on different moirés is another challenge for device applications. Our results have also direct relevance to moiré patterns observed on other layered systems such as hBN, or Graphene/hBN systems, especially in their modelling, which attracted recent attention van Wijk et al. (2014) . Corrugation variation in such systems is another issue that awaits testing. The ease in the preparation of the samples we used for this study may help many others to pursue similar methodologies in similar layered systems. Our data has also direct relevance to graphene device literature where the identification of mono/bi-layer or multilayer graphene systems is invaluable while producing graphene based devices, which ideally function at room temperature and especially under ambient conditions, for real life applications.
Acknowledgements.
This work was partially supported by TÜBİTAK projects with grant numbers 109T687, 112T818, 113F005, and by ITU-BAP projects with numbers 33263 and 37705.References
- Zhong et al. (2003) C.-J. Zhong, L. Han, M. M. Maye, J. Luo, N. N. Kariuki, and W. E. Jones, J. Chem. Educ. 80, 194 (2003).
- Tomanek et al. (1987) D. Tomanek, S. G. Louie, H. J. Mamin, D. W. Abraham, R. E. Thomson, E. Ganz, and J. Clarke, Phys. Rev. B 35, 7790 (1987).
- Albrecht et al. (1988) T. Albrecht, H. Mizes, J. Nogami, S.-i. Park, and C. Quate, Appl. Phys. Lett. 52, 362 (1988).
- Wong and Durkan (2012) H. S. Wong and C. Durkan, Nanotechnology 23, 185703 (2012).
- Cisternas et al. (2009) E. Cisternas, F. Stavale, M. Flores, C. Achete, and P. Vargas, Phys. Rev. B 79, 205431 (2009).
- Rong (1994) Z. Y. Rong, Phys. Rev. B 50, 1839 (1994).
- Kolmogorov and Crespi (2005) A. Kolmogorov and V. Crespi, Phys. Rev. B 71, 235415 (2005).
- Suárez Morell et al. (2013) E. Suárez Morell, M. Pacheco, L. Chico, and L. Brey, Phys. Rev. B 87, 125414 (2013).
- Shallcross et al. (2010) S. Shallcross, S. Sharma, E. Kandelaki, and O. a. Pankratov, Phys. Rev. B 81, 165105 (2010).
- Novoselov et al. (2005) K. S. Novoselov, D. Jiang, F. Schedin, T. J. Booth, V. V. Khotkevich, S. V. Morozov, and A. K. Geim, PNAS 102, 10451 (2005).
- Geim and Novoselov (2007) A. Geim and K. Novoselov, Nature 6, 183 (2007).
- Kuwabara M, Clarke D.R. (1990) S. D. Kuwabara M, Clarke D.R., Appl. Phys. Lett. 56, 2396 (1990).
- Rong and Kuiper (1993) Z. Y. Rong and P. Kuiper, Phys. Rev. B 48, 17427 (1993).
- Pong and Durkan (2005) W.-T. Pong and C. Durkan, J. Phys. D. Appl. Phys. 38, R329 (2005).
- Bernhardt et al. (1998) T. Bernhardt, B. Kaiser, and K. Rademann, Surf. Sci. 408, 86 (1998).
- Wong et al. (2009) H. S. Wong, C. Durkan, and N. Chandrasekhar, ACS Nano 3, 3455 (2009).
- Wang et al. (2006) Y. Wang, Y. Ye, and K. Wu, Surf. Sci. 600, 729 (2006).
- Miller et al. (2010) D. L. Miller, K. D. Kubista, G. M. Rutter, M. Ruan, W. a. de Heer, P. N. First, and J. a. Stroscio, Phys. Rev. B 81, 125427 (2010).
- Campanera et al. (2007) J. Campanera, G. Savini, I. Suarez-Martinez, and M. Heggie, Phys. Rev. B 75, 235449 (2007).
- Bistritzer and MacDonald (2011a) R. Bistritzer and a. H. MacDonald, Nature 474, 453 (2011a).
- Lopes dos Santos et al. (2007) J. M. B. Lopes dos Santos, N. M. R. Peres, and a. H. Castro Neto, Phys. Rev. Lett. 99, 256802 (2007).
- Latil et al. (2007) S. Latil, V. Meunier, and L. Henrard, Phys. Rev. B 76, 201402 (2007).
- Cisternas et al. (2008) E. Cisternas, M. Flores, and P. Vargas, Phys. Rev. B 78, 125406 (2008).
- Hass et al. (2008) J. Hass, F. Varchon, J. Millán-Otoya, M. Sprinkle, N. Sharma, W. de Heer, C. Berger, P. First, L. Magaud, and E. Conrad, Phys. Rev. Lett. 100, 125504 (2008).
- Li et al. (2009a) G. Li, A. Luican, J. M. B. Lopes dos Santos, a. H. Castro Neto, A. Reina, J. Kong, and E. Y. Andrei, Nat. Phys. 6, 109 (2009a).
- Li et al. (2009b) G. Li, A. Luican, and E. Y. Andrei, Phys. Rev. Lett. 102, 176804 (2009b).
- Luican et al. (2011) a. Luican, G. Li, A. Reina, J. Kong, R. R. Nair, K. S. Novoselov, A. K. Geim, and E. Y. Andrei, Phys. Rev. Lett. 106, 126802 (2011).
- Voloshina et al. (2013) E. N. Voloshina, E. Fertitta, A. Garhofer, F. Mittendorfer, M. Fonin, A. Thissen, and Y. S. Dedkov, Sci. Rep. 3, 1072 (2013).
- Lee et al. (2011) D. S. Lee, C. Riedl, T. Beringer, A. H. Castro Neto, K. von Klitzing, U. Starke, and J. H. Smet, Phys. Rev. Lett. 107, 216602 (2011).
- Novoselov et al. (2004) K. S. Novoselov, a. K. Geim, S. V. Morozov, D. Jiang, Y. Zhang, S. V. Dubonos, I. V. Grigorieva, and a. a. Firsov, Science 306, 666 (2004).
- Trambly de Laissardière et al. (2010) G. Trambly de Laissardière, D. Mayou, and L. Magaud, Nano Lett. 10, 804 (2010).
- Biedermann et al. (2009) L. Biedermann, M. Bolen, M. Capano, D. Zemlyanov, and R. Reifenberger, Phys. Rev. B 79, 125411 (2009).
- Hicks et al. (2011) J. Hicks, M. Sprinkle, K. Shepperd, F. Wang, A. Tejeda, A. Taleb-Ibrahimi, F. Bertran, P. Le Fèvre, W. A. de Heer, C. Berger, and E. H. Conrad, Phys. Rev. B 83, 205403 (2011).
- Tejeda et al. (2012) A. Tejeda, A. Taleb-Ibrahimi, W. de Heer, C. Berger, and E. H. Conrad, New J. Phys. 14, 125007 (2012).
- Moon and Koshino (2012) P. Moon and M. Koshino, Phys. Rev. B 85, 195458 (2012).
- Brihuega et al. (2012) I. Brihuega, P. Mallet, H. González-Herrero, G. Trambly de Laissardière, M. M. Ugeda, L. Magaud, J. M. Gómez-Rodríguez, F. Ynduráin, and J.-Y. Veuillen, Phys. Rev. Lett. 109, 196802 (2012).
- Bistritzer and MacDonald (2011b) R. Bistritzer and A. H. MacDonald, Proc. Natl. Acad. Sci. U. S. A. 108, 12233 (2011b).
- Landgraf et al. (2013) W. Landgraf, S. Shallcross, K. Türschmann, D. Weckbecker, and O. Pankratov, Phys. Rev. B 87, 075433 (2013).
- Chu et al. (2013) Z.-D. Chu, W.-Y. He, and L. He, Phys. Rev. B 87, 155419 (2013).
- Cisternas and Correa (2012) E. Cisternas and J. Correa, Chem. Phys. 409, 74 (2012), 1202.2612 .
- Yan et al. (2014) W. Yan, L. Meng, M. Liu, J.-B. Qiao, Z.-D. Chu, R.-F. Dou, Z. Liu, J.-C. Nie, D. G. Naugle, and L. He, Phys. Rev. B 90, 115402 (2014).
- Wong and Durkan (2011) H. S. Wong and C. Durkan, Phys. Rev. B 84, 085435 (2011).
- Selloni et al. (1985) A. Selloni, P. Carnevali, E. Tosatti, and C. Chen, Phys. Rev. B 31, 2602 (1985).
- Tomanek and Louie (1988) D. Tomanek and G. Louie, Phys. Rev. B 37, 8327 (1988).
- Ondráček et al. (2011) M. Ondráček, P. Pou, V. Rozsíval, C. González, P. Jelínek, and R. Pérez, Phys. Rev. Lett. 106, 176101 (2011).
- Xhie J., Sattler K., Ge M., Venkateswaran (1993) N. Xhie J., Sattler K., Ge M., Venkateswaran, Phys. Rev. B 47, 15835 (1993).
- Note (1) Understanding the formation of moiré patterns on HOPG surface due to cyclohexane drop casting and drying process is beyond the scope of this present work and will be discussed elsewhere.
- Note (2) Sample preparation procedure and the procedure we have developed to obtain consistent data is further explained in the supporting information.
- Teobaldi et al. (2012) G. Teobaldi, E. Inami, J. Kanasaki, K. Tanimura, and a. L. Shluger, Phys. Rev. B 85, 085433 (2012).
- Ishigami et al. (2007) M. Ishigami, J. H. Chen, W. G. Cullen, M. S. Fuhrer, and E. D. Williams, Nano Lett. 7, 1643 (2007).
- Yan et al. (2013) H. Yan, Z.-D. Chu, W. Yan, M. Liu, L. Meng, M. Yang, Y. Fan, J. Wang, R.-F. Dou, Y. Zhang, Z. Liu, J.-C. Nie, and L. He, Phys. Rev. B 87, 075405 (2013).
- Lopes dos Santos et al. (2012) J. M. B. Lopes dos Santos, N. M. R. Peres, and A. H. Castro Neto, Phys. Rev. B 86, 155449 (2012).
- Mele (2010) E. J. Mele, Phys. Rev. B 81, 161405 (2010).
- Wallbank et al. (2013) J. R. Wallbank, M. Mucha-Kruczynski, and V. I. Falko, Phys. Rev. B 88, 155415 (2013).
- Trambly de Laissardière et al. (2012) G. Trambly de Laissardière, D. Mayou, and L. Magaud, Phys. Rev. B 86, 125413 (2012).
- Jung et al. (2014) J. Jung, A. Raoux, Z. Qiao, and a. H. MacDonald, Phys. Rev. B 89, 205414 (2014).
- Shallcross et al. (2008) S. Shallcross, S. Sharma, and O. Pankratov, Phys. Rev. Lett. 101, 056803 (2008).
- Kresse and Hafner (1993) G. Kresse and J. Hafner, Phys. Rev. B. Condens. Matter 48, 13115 (1993).
- Kresse and Furthmüller (1996) G. Kresse and J. Furthmüller, Phys. Rev. B. Condens. Matter 54, 11169 (1996).
- Tersoff and Haman (1983) J. Tersoff and D. R. Haman, Phys. Rev. Lett. 50, 1998 (1983).
- Hamann and Tersoff (1985) D. R. Hamann and J. Tersoff, Pysical Rev. B 31, 805 (1985).
- Gurlu et al. (2004) O. Gurlu, H. J. W. Zandvliet, and B. Poelsema, Phys. Rev. Lett. 93 (2004).
- Hove (1953) L. V. Hove, Phys. Rev. 89, 1189 (1953).
- Note (3) The origin of the van Hove singularities in the moiré system is described further in the supplementary video.
- van Wijk et al. (2014) M. M. van Wijk, A. Schuring, M. I. Katsnelson, and A. Fasolino, Phys. Rev. Lett. 113, 135504 (2014).