www.pnas.org/cgi/doi/10.1073/pnas.1418994112 \issuedateIssue Date \issuenumberIssue Number
Submitted to Proceedings of the National Academy of Sciences of the United States of America
To clarify the mechanism of superconductivity in iron-based superconductors, it is crucial to investigate FeSe1-xTex, which has the simplest crystal structure among them. There is, however, a serious obstacle to the understanding of its superconductivity; phase separation occurs in the region of , and thus a whole phase diagram has not been available. Here we report the successful fabrication of FeSe1-xTex films with . This is the first demonstration of the suppression of the phase separation. What is more notable is that a giant enhancement of is observed in the “phase-separation region”. The complete phase diagram that we present provides a novel perspective for the mechanism of superconductivity of this material.
Suppression of phase separation and giant enhancement of superconducting transition temperature in FeSe1-xTex thin films
Abstract
We demonstrate the successful fabrication on CaF2 substrates of FeSe1-xTex films with , including the region of , which is well known to be the “phase-separation region”, via pulsed laser deposition which is a thermodynamically non-equilibrium method. In the resulting films, we observe a giant enhancement of the superconducting transition temperature, , in the region of : the maximum value reaches 23 K, which is approximately 1.5 times as large as the values reported for bulk samples of FeSe1-xTex. We present a complete phase diagram of FeSe1-xTex films. Surprisingly, a sudden suppression of is observed at , while increases with decreasing for . Namely, there is a clear difference between superconductivity realized in and in . To obtain a film of FeSe1-xTex with high , the controls of the Te content and the in-plane lattice strain are found to be key factors.
keywords:
FeSe1-xTex — thin film growth — compressive strain — complete phase diagramPLD, pulsed laser deposition; XRD, X-ray diffraction
Since the discovery of superconductivity in LaFeAs(O,F)[1], many studies concerning iron-based superconductors have been conducted. FeSe is the iron-based superconductor with the simplest crystal structure[2]. The of FeSe is approximately 8 K, which is not very high in comparison with other iron-based superconductors. However, the value of strongly depends on the applied pressure, and the temperature at which the resistivity becomes zero, , reaches as high as K at 6 GPa[3]. This suggests that FeSe samples with higher are available by the fabrication of thin films because we can introduce lattice strain. Indeed, we have previously reported that FeSe films fabricated on CaF2 substrates exhibit values approximately 1.5 times higher than those of bulk samples because of in-plane compressive strain[4]. On the other hand, superconductivity with of 65 K has recently been reported in a monolayer FeSe film on SrTiO3[5, 6]. It is unclear whether this superconductivity results from the characteristics of the interface. However, this finding indicates that FeSe demonstrates potential as a very-high- superconductor.
The partial substitution of Te for Se in FeSe also raises to a maximum of 14 K at [7]. In FeSe1-xTex, it is well known that we cannot obtain single-phase samples with because of phase separation[7]. Here, we focus on this region of phase separation. Generally, the process of film deposition involves crystal growth in a thermodynamically non-equilibrium state. Thus, film deposition provides an avenue for the synthesis of a material with a metastable phase. In this letter, we report the fabrication of epitaxial thin films of FeSe1-xTex with on CaF2 substrates using the pulsed laser deposition (PLD) method. We demonstrate that single-phase epitaxial films of FeSe1-xTex with are successfully obtained and that the maximum value of is as large as 23 K, which is higher than the previously-reported values for bulk and film samples of FeSe1-xTex[7, 8, 9, 10, 11, 12], except for those of the monolayer FeSe films[5, 6]. Our results clearly show that the optimal Te content for the highest for FeSe1-xTex films on CaF2 is different from the widely-believed value for this system.
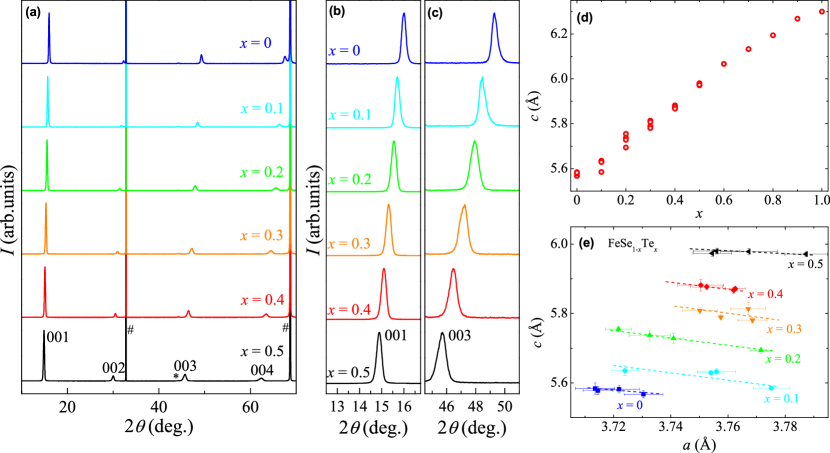
Figure 1a presents the X-ray diffraction patterns of FeSe1-xTex films for on CaF2. Here and hereafter, the Te content of our films represents the nominal Te composition of the polycrystalline target. With the exception of an unidentified peak in the FeSe0.5Te0.5 film, only the reflections of a tetragonal PbO-type structure are observed, which indicates that these films are well oriented along the axis. Figures 1b and 1c present enlarged segments of these plots near the 001 and 003 reflections, respectively. The 2 values of the peak positions decrease with increasing in a continuous manner, which is consistent with the fact that the -axis length increases with increasing . It should be noted that the values of the full widths at half maximum (FWHM), , of the FeSe1-xTex films with , which is known as the region of phase separation in the bulk samples[7], are for the 001 reflection and for the 003 reflection, which are nearly the same as the values for the FeSe and FeSe0.5Te0.5 films. This result is in sharp contrast to the previously-reported result that the FWHM was broad in films of FeSe1-xTex with and ,[13] where phase separation has been believed to occur. The results presented in Figs. 1a-1c indicate the formation of a single phase in our FeSe1-xTex films with .
In Figure 1d, the -axis lengths of 29 films of FeSe1-xTex are plotted as a function of . The values of the -axis lengths vary almost linearly with the nominal Te contents of the targets in the whole range of including both end-member materials. The evident formation of a single phase and the systematic change in the -axis length strongly indicate that the nominal Te content of the polycrystalline target is nearly identical to that of the final FeSe1-xTex film. Note that the compositional analysis of grown films using scanning electron microscopy/energy-dispersive X-ray (SEM/EDX) analysis is impossible for FeSe1-xTex films on CaF2 substrates because the energies of the K-edge of Ca and the L-edge of Te are very close to each other. The above-mentioned features indicate that phase separation is suppressed in our FeSe1-xTex films with on CaF2 substrates. To our knowledge, this result is the first manifestation of the suppression of phase separation in FeSe1-xTex with .
Figure 1e presents the relations between the -axis and -axis lengths in films of FeSe1-xTex. At first glance, there seems to be no relations between the -axis length and , in sharp contrast to the behavior of the -axis length. The -axis and -axis lengths of films with the same show a weak negative correlation. This behavior cannot be explained by a difference in Te content of a film, which should result in a positive correlation. By contrast, if variations in are caused by a difference in in-plane lattice strain, this behavior can be explained in terms of the Poisson effect. Indeed, the -axis lengths of films of FeSe and FeSe0.5Te0.5 are smaller than those of bulk samples with the same composition. Thus, we consider that the -axis length predominantly depends on the in-plane lattice strain rather than the Te content . One might think that this behavior looks strange, because the lattice constant of CaF2() is longer than the of FeSe1-xTex, which usually leads to a tensile strain. In the previous paper, the penetration of F- ions from the CaF2 substrates into the films has been proposed as a possible mechanism for nontrivial compressive strain in FeSe1-xTex films on CaF2 substrates[15]. Because of smaller ionic radius of F- than that of Se2-, this peculiar compressive strain can be explained by the partial substitution of F- for Se2- near the interface between a film and a substrate.
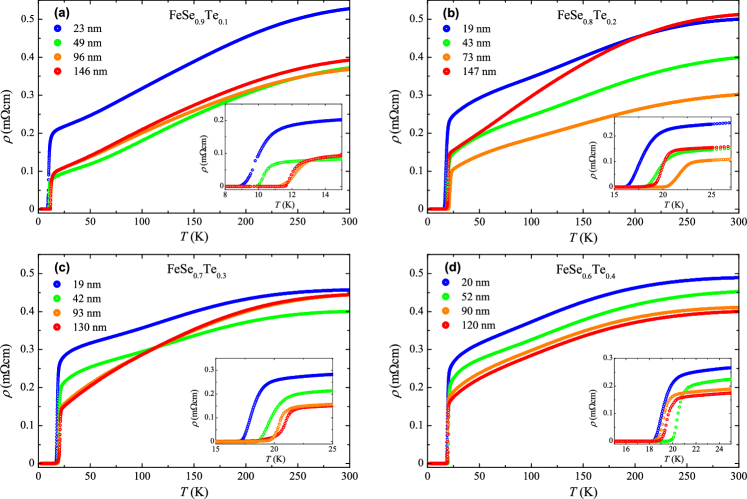
Figures 2a-2d present the temperature dependences of the electrical resistivities, , of 16 films of FeSe1-xTex for . The value of depends on the film thickness, even in films with the same . The highest , which is defined as the temperature where the electrical resistivity deviates from the normal-state behavior, and the of the FeSe1-xTex films are 13.2 K and 11.5 K, respectively, for ; 22.8 K and 20.5 K, respectively, for ; 20.9 K and 19.9 K, respectively, for ; and 20.9 K and 20.0 K, respectively, for . Compared with the results for bulk samples, a drastic enhancement of is observed in these FeSe1-xTex films. Surprisingly, the values of in the films with and exceed 20 K. These values are larger than those reported for FeSe0.5Te0.5 films[14, 8, 10, 11]. In particular, the of the FeSe0.8Te0.2 film with a thickness of 73 nm is approximately 1.5 times as high as those of bulk crystals of FeSe1-xTex with the optimal composition, [7]. Based on the measurement of the of the FeSe0.8Te0.2 film under a magnetic field applied along the axis, we estimate an upper critical field at 0 K of T using the Werthamer-Helfand-Hohenberg(WHH) theory[16], which yields a Ginzburg-Landau coherence length at 0 K of Å(see the supporting information). This value of is approximately half the value for an FeSe0.5Te0.5 film on CaF2 with a of approximately 16 K.[9]
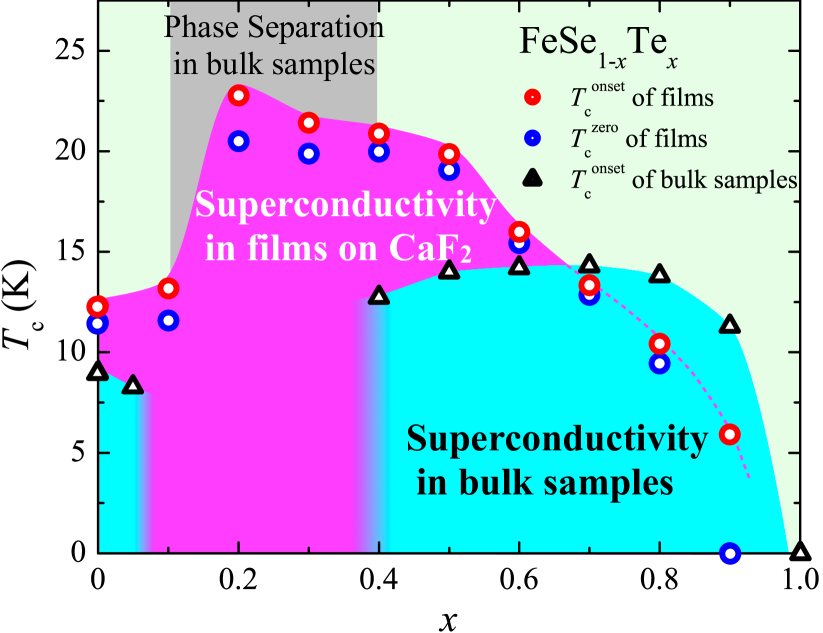
Using the data shown above, we present the phase diagram of FeSe1-xTex films on CaF2 substrates in Fig. 3. For comparison, the data for bulk samples of FeSe1-xTex[7, 17] are also plotted in this figure. In bulk crystals, the optimal Te content to achieve the highest is considered to be , and phase separation occurs in the region of [7]. However, our data clearly demonstrate that this phase separation is absent and that the optimal composition for an FeSe1-xTex film on a CaF2 substrate is not but . It should be noted that the dependence of on suddenly changes at the boundary defined by . Unlike the “dome-shaped” phase diagram that is familiar in iron-based superconductors, the values of in films with increase with decreasing , while the strong suppression of is observed at . The behavior in films with can be explained by the empirical law which shows the relation between and structural parameters. In iron-based superconductors, it is well accepted that the bond angle of (, )-Fe-(, ) (, ), ,[18, 19] and/or the anion height from the iron plane, ,[20] are the critical structural parameters that determine the value of . In bulk samples of FeSe1-xTex, and approach their optimal values, i.e. [18, 19] and Å[20], with decreasing (down to ), which should be the same in FeSe1-xTex films. Therefore, the increase of in films with with decreasing can be explained by the optimization of and/or based on the empirical law. However, the sudden suppression of in films with is not consistent with this scenario, and its origin should be sought among other factors. We consider there are two candidates for this origin from the structural analysis of bulk samples of FeSe1-xTex. One is the effect of the orthorhombic distortion. In a bulk sample of FeSe, a structural phase transition from tetragonal to orthorhombic occurs at 90 K[21]. However, in bulk samples of FeSe1-xTex with which s take optimum values, there are papers with different conclusions on the presence/absence of the similar type of the structural transition as that of FeSe.[22, 23, 24] It should be noted that a structural transition temperature is lower and that the orthorhombicity is much smaller than those of FeSe even in the report where the structural transition is present.[24] These results on crystal structures suggest that the orthorhombic distortion results in a suppression of . This scenario is applicable to the behavior of our films, if a large orthorhombic distortion is observed only in films with . The other candidate is the change in the distance between the layers of Fe- tetrahedra, . As shown in the supporting information, in polycrystalline samples of FeSe1-xTex, the value of FeSe is much smaller than those of FeSe1-xTex with at which is nearly independent of [22]. We speculate that the decrease of in FeSe is related with the suppression of . Indeed, in polycrystalline samples, FeSe exhibits smaller values of and than does FeSe0.5Te0.5[7, 22], and the intercalation of alkali metals and alkaline earths into FeSe result in the -axis length as large as approximately 20 Å and as high as 45 K.[25, 26] At this moment, the origin of the suppression of at is unclear, which will be a subject of a future study. Regardless of its origin, we believe that it is reasonable to distinguish between superconductivity in and in . In other words, our phase diagram of Fig. 3 provides a new view for superconductivity in FeSe1-xTex, that is, a discontinuity in superconductivity of FeSe1-xTex. We are able to come to this picture, only after the data for become available in this study. If we remove a cause for the suppression of in in some way, a further increase in can be expected because of the optimization of structural parameters.
In conclusion, we prepared high-quality epitaxial thin films of FeSe1-xTex on CaF2 substrates using the pulsed laser deposition method.
We successfully obtained FeSe1-xTex films with , which has long considered to be the “phase-separation region”, using a thermodynamically non-equilibrium growth of film deposition.
From the results of electrical resistivity measurements, a complete phase diagram is presented in this system, in which the maximum value of is as high as 23 K at .
Surprisingly, a sudden suppression of is observed at , while increases with decreasing for .
This behavior is different from the “dome-shaped” phase diagram that is familiar in iron-based superconductors.
All of the FeSe1-xTex() films in this study were grown by the pulsed laser deposition method using a KrF laser[27, 28]. Polycrystalline pellets with a nominal composition of FeSe1-xTex() were used as the targets. The substrate temperature, repetition rate, and back pressure were 280 ∘C, 20 Hz, and 10-7 Torr, respectively. Single crystals of the CaF2 (100), which is one of the most preferred materials for the thin-film growth of FeSe1-xTex[9, 4], were used as the substrates. We used a metal mask to prepare the FeSe1-xTex films in a six-terminal shape for transport measurements. The thicknesses of the thin films were measured using a Dektak 6 M stylus profiler and estimated to be 12-148 nm. The crystal structures and orientations of the films were characterized by four-circle X-ray diffraction (XRD) with Cu K radiation at room temperature. The -axis and -axis lengths are determined from the and reflections in XRD measurements, respectively. Electrical-resistivity measurements were conducted using the four-terminal method from 2 K to 300 K with magnetic fields up to 9 T applied perpendicular to the film surface.
Acknowledgements.
We are grateful to Dr. Ichiro Tsukada at CRIEPI for fruitful discussions. The authors thank Profs. Jun-ichi Shimoyama and Kohji Kishio at Department of Applied Chemistry, the University of Tokyo for their especial support in the chemical-composition analysis of the films. This work was partially supported by Strategic International Collaborative Research Program (SICORP), Japan Science and Technology Agency.References
- [1] Kamihara Y, Watanabe T, Hirano M, Hosono H (2008) Iron-based layered superconductor La[O1-xFx]FeAs ( 0.05−0.12) with K. J. Am. Chem. Soc. 130:3296.
- [2] Hsu FC, et al. (2008) Superconductivity in the PbO-type structure -FeSe. Proc. Natl. Acad. Sci. U.S.A. 105:14262.
- [3] Okabe H, Takeshita N, Horigane K, Muranaka T, Akimitsu J (2010) Pressure-induced high- superconducting phase in FeSe: Correlation between anion height and . Phys. Rev. B 81:205119.
- [4] Nabeshima F, Imai Y, Hanawa M, Tsukada I, Maeda A (2013) Enhancement of the superconducting transition temperature in FeSe epitaxial thin films by anisotropic compression. Appl. Phys. Lett. 103:172602.
- [5] Wang QY, et al. (2012) Interface-induced high-temperature superconductivity in single unit-cell FeSe films on SrTiO3. Chin. Phys. Lett. 29:37402.
- [6] He S, et al. (2013) Phase diagram and electronic indication of high-temperature superconductivity at 65 K in single-layer FeSe films. Nat. Mater. 12:605.
- [7] Fang MH, et al. (2008) Superconductivity close to magnetic instability in Fe(Se1-xTex)0.82. Phys. Rev. B 78:224503.
- [8] Bellingeri E, et al. (2010) K in epitaxial FeSe0.5Te0.5 thin films with biaxial compressive strain. Appl. Phys. Lett. 96:102512.
- [9] Tsukada I, et al. (2011) Epitaxial growth of FeSe0.5Te0.5 thin films on CaF2 substrates with high critical current density. Appl. Phys. Express 4:053101.
- [10] Iida K, et al. (2011) Generic Fe buffer layers for Fe-based superconductors: Epitaxial FeSe1-xTex thin films. Appl. Phys. Lett. 99:202503.
- [11] Si W, et al. (2013) High current superconductivity in FeSe0.5Te0.5-coated conductors at 30 tesla. Nat. Commun 4:1347.
- [12] Zhuang JC, et al. (2014) Enhancement of transition temperature in FexSe0.5Te0.5 film via iron vacancies. Applied Physics Letters 104:262601.
- [13] Wu MK, et al. (2009) The development of the superconducting PbO-type -FeSe and related compounds. Physica C 469:340.
- [14] Maeda A, et al. (2014) Synthesis, characterization, hall effect and THz conductivity of epitaxial thin films of Fe chalcogenide superconductors. Appl. Sur. Sci. 312:43.
- [15] Ichinose A, et al. (2013) Microscopic analysis of the chemical reaction between Fe(Te,Se) thin films and underlying CaF2. Supercond. Sci. Technol. 26:075002.
- [16] Werthamer NR, Helfand E, Hohenberg PC (1966) Temperature and purity dependence of the superconducting critical field, . iii. electron spin and spin-orbit effects. Phys. Rev. 147:295–302.
- [17] Noji T, et al. (2010) Growth, annealing effects on superconducting and magnetic properties, and anisotropy of FeSe1-xTex () single crystals. J. Phys. Soc. Jpn. 79:084711.
- [18] Lee CH, et al. (2008) Effect of structural parameters on superconductivity in fluorine-free FeAsO1-y ( La, Nd). J. Phys. Soc. Jpn. 77:083704.
- [19] Lee CH, et al. (2012) Relationship between crystal structure and superconductivity in iron-based superconductors. Solid State Commun. 152:644.
- [20] Mizuguchi Y, et al. (2010) Anion height dependence of for the Fe-based superconductor. Supercond. Sci. Technol. 23:054013.
- [21] McQueen TM, et al. (2009) Tetragonal-to-orthorhombic structural phase transition at 90 K in the superconductor . Phys. Rev. Lett. 103:057002.
- [22] Horigane K, Hiraka H, Ohoyama K (2009) Relationship between structure and superconductivity in FeSe1-xTex. J. Phys. Soc. Jpn. 78:074718.
- [23] Li S, et al. (2009) First-order magnetic and structural phase transitions in Fe1+ySexTe1-x. Phys. Rev. B 79:054503.
- [24] Gresty NC, et al. (2009) Structural phase transitions and superconductivity in Fe1+δSe0.57Te0.43 at ambient and elevated pressures. J. Am. Chem. Soc. 131:16944.
- [25] Ying TP, et al. (2012) Observation of superconductivity at 30-46 K in Fe2Se2 ( Li, Na, Ba, Sr, Ca, Yb, and Eu). Sci. Rep. 2:426.
- [26] Hatakeda T, Noji T, Kawamata T, Kato M, Koike Y (2013) New Li-ethylenediamine-intercalated superconductor Lix(C2H8N2)yFe2-zSe2 with K. J. Phys. Soc. Jpn. 82:123705.
- [27] Imai Y, et al. (2010) Superconductivity of FeSe0.5Te0.5 thin films grown by pulsed laser deposition. Jpn. J. Appl. Phys. 49:023101.
- [28] Imai Y, et al. (2010) Systematic comparison of eight substrates in the growth of FeSe0.5Te0.5 superconducting thin films. Appl. Phys. Express 3:043102.