The use of covariates and random effects in evaluating predictive biomarkers under a potential outcome framework
Abstract
Predictive or treatment selection biomarkers are usually evaluated in a subgroup or regression analysis with focus on the treatment-by-marker interaction. Under a potential outcome framework (Huang, Gilbert and Janes [Biometrics 68 (2012) 687–696]), a predictivebiomarker is considered a predictor for a desirable treatment benefit (defined by comparing potential outcomes for different treatments) and evaluated using familiar concepts in prediction and classification. However, the desired treatment benefit is unobservable because each patient can receive only one treatment in a typical study. Huang et al. overcome this problem by assuming monotonicity of potential outcomes, with one treatment dominating the other in all patients. Motivated by an HIV example that appears to violate the monotonicity assumption, we propose a different approach based on covariates and random effects for evaluating predictive biomarkers under the potential outcome framework. Under the proposed approach, the parameters of interest can be identified by assuming conditional independence of potential outcomes given observed covariates, and a sensitivity analysis can be performed by incorporating an unobserved random effect that accounts for any residual dependence. Application of this approach to the motivating example shows that baseline viral load and CD4 cell count are both useful as predictive biomarkers for choosing antiretroviral drugs for treatment-naive patients.
doi:
10.1214/14-AOAS773keywords:
FLA \setattributecopyrightownerIn the Public Domain
, , and
1 Introduction
Much of contemporary medical research is focused on treatment effect heterogeneity, that is, the fact that the same treatment can have different effects on different patients. The increasing awareness of treatment effect heterogeneity has motivated the development of predictive biomarkers for identifying the subpopulation of patients who would actually benefit from a new treatment [e.g., Simon (2008, 2010)]. Classical examples of predictive biomarkers include genetic markers for cancer treatment, such as the OncoType Dx multi-gene score for breast cancer [Paik et al. (2004)] and the K-RAS gene expression level for colorectal cancer [Karapetis et al. (2008)]. This article is motivated by a new and growing interest in the possibility of using baseline viral load or CD4 cell count as a predictive biomarker for treating human immunodeficiency virus type 1 (HIV-1).

Evaluation of a predictive biomarker is usually based on a subgroup or regression analysis comparing treatment effects on different subpopulations defined by the biomarker [e.g., Gail and Simon (1985), Russek-Cohen and Simon (1998), Pocock et al. (2002)]. Under this approach, the performance of a predictive biomarker is measured by the interaction between marker value and treatment assignment in a regression model for the clinical outcome of interest, which will be referred to as an outcome model. For example, consider the THRIVE study, a phase 3, randomized, noninferiority trial comparing rilpivirine, a newly developed nonnucleoside reverse transcriptase inhibitor, with efavirenz in treatment-naive adults infected with HIV-1 [Cohen et al. (2011)]. The outcome of primary interest is a binary indicator of virologic response at week 48 of treatment (see Section 4 for details). Our consideration of baseline viral load and CD4 cell count as predictive biomarkers (for choosing between efavirenz and rilpivirine) is motivated by Figure 1, which shows nonparametric estimates of treatment-specific response rates as functions of marker value, separately for each biomarker. Figure 1 suggests a qualitative interaction between treatment and each biomarker, with rilpivirine favored over efavirenz for higher values of baseline CD4 cell count and lower values of baseline viral load. Because the statistical significance in Figure 1 is not straightforward to assess, a simple logistic regression analysis that includes treatment, marker and their interaction is performed (separately for each marker), and the resulting -value for the treatment-by-marker interaction is 0.059 for viral load and 0.031 for CD4 cell count.
While informative about possible interactions, Figure 1 is less transparent about the predictive performance of these biomarkers and their comparison. Huang, Gilbert and Janes (2012) point out that a strong interaction is not sufficient for adequate performance of a predictive biomarker, that the scale of the interaction coefficient depends on the functional form of the outcome model, and that the interaction-based approach is ill-suited for developing combination markers. These authors also propose a potential outcome framework where a predictive biomarker is—as the term suggests—treated as a predictor for a desirable treatment benefit. Note that a treatment benefit is necessarily the result of comparing potential outcomes for different treatments applied to the same patient. Under this perspective, predictive biomarkers should be evaluated using familiar measures in prediction and classification [e.g., Zhou, Obuchowski and McClish (2002), Pepe (2003), Zou et al. (2011)]. Specifically, one should consider the true and false positive rates of a binary marker and the receiver operating characteristic (ROC) curve for a continuous marker. This approach allows different markers to be compared on the same scale and facilitates the development of combination markers.
The objective of this article is to evaluate and compare baseline viral load and CD4 cell count as predictive biomarkers under the potential outcome framework. It is important to distinguish this objective from the related problems of identifying potential markers, combining several markers into a hybrid marker, choosing the cutoff point for a given marker and, more generally, developing an individualized treatment strategy. Variable selection techniques such as lasso-based methods have been used to select and combine genetic markers [e.g., Tian et al. (2012)]. Nonparametric multivariate methods [e.g., Su et al. (2008), Foster, Taylor and Ruberg (2011), Qian and Murphy (2011)] and semiparametric methods [e.g., Zhang et al. (2012)] have been used to develop a treatment rule (i.e., a set of criteria for selecting patients), which can be considered a binary hybrid marker obtained by combining multiple markers. A natural question that arises from the THRIVE study is whether or how to combine baseline viral load and CD4 cell count into a hybrid marker with improved predictive accuracy. While that question is beyond the scope of this article, we note that the potential outcome framework and the proposed methods are applicable to any given marker. Once a hybrid marker is developed, it can be evaluated and compared to the individual markers in the same framework using the same methods.
An analytical challenge for the potential outcome framework is that the desired treatment benefit, which involves potential outcomes under different treatments, is usually unobservable because each patient can receive only one treatment in a typical study. A possible exception to this limitation is a cross-over study, which has its own issues [e.g., Poulson, Gadbury and Allison (2012)] and will not be discussed in this article. In a typical clinical study such as the THRIVE study, the standard methodology in prediction and classification is not directly applicable to a predictive biomarker. To address this issue and the resulting identification problem, Huang, Gilbert and Janes (2012) make a monotonicity assumption, namely, that one treatment dominates the other in all individual patients, and suggest a sensitivity analysis for possible departures from the monotonicity assumption. While the monotonicity assumption may be plausible in some situations such as vaccine trials, it may be less appealing as a starting point in other situations. In the THRIVE study, for example, the presence of a qualitative interaction (in the sense that neither treatment has a higher response rate for all realistic marker values) implies that neither treatment is dominant in all patients. Additionally, the approach of Huang, Gilbert and Janes (2012) is developed for a binary outcome and not readily extensible to other types of outcomes.
In this article, we propose alternative methods that do not require monotonicity or assume a binary outcome. Our first step is to account for the dependence between potential outcomes (for different treatments applied to the same patient) by adjusting for relevant covariates, such as demographic variables and baseline characteristics. If the set of measured covariates is sufficient for explaining the dependence between potential outcomes, the aforementioned performance measures can then be identified by assuming conditional independence of potential outcomes given covariates. Possible violations of this assumption can be addressed by introducing a random effect to account for residual dependence. In the next section we formulate the problem in terms of potential outcomes and provide a general rationale for the proposed approach. The proposed methods are then described in Section 3 and applied to the THRIVE study in Section 4. The article ends with a discussion in Section 5. Some technical details are provided in a supplemental article [Zhang et al. (2014)].
2 Notation and rationale
Suppose a randomized clinical trial is conducted to compare an experimental treatment with a control treatment, which may be a placebo or a standard treatment, with respect to a clinical outcome of interest, which may be discrete or continuous. Because there is only one outcome of primary interest in the THRIVE study, we will work with a scalar outcome unless otherwise noted. However, most of our methodology is readily applicable to a vector-valued outcome, with the exception of the sensitivity analysis in Section 3.2 (described fully in Web Appendix B). For a generic patient in the target population, let denote the potential outcome that will result if the patient receives treatment (0 for control; 1 for experimental). Note that the , , cannot both be observed at a given time. Let denote the treatment assigned randomly to a study subject, thus is a Bernoulli variable independent of all baseline variables. Without considering noncompliance, which is negligible in the THRIVE study, we assume that is also the actual treatment given to the subject, and write for the actual outcome. Should noncompliance become a major issue, we could take an intent-to-treat perspective and compare treatment assignments or use analytical techniques to recover the actual treatment effect [e.g., van der Laan and Robins (2003)]. We assume that large values of are desirable. Where necessary, the subscript will be attached to random variables to denote individual patients in the trial.
Our interest is in evaluating a predictive biomarker , a baseline variable which may be binary or continuous, with higher marker values supporting the use of the new treatment. The biomarker is intended to identify the subpopulation of patients who would benefit from the new treatment relative to the control. It can be a continuous variable as in our motivating example or a binary one such as a treatment rule developed using nonparametric multivariate methods. Let the desired treatment benefit be indicated by , where is the indicator function and is the set of desirable outcomes. Note that is by definition a comparison of the two potential outcomes. For a binary outcome, might be an indicator for or , depending on which treatment is preferable with identical (efficacy) outcomes. In our example, we set because rilpivirine is thought to have a better safety profile and will likely be preferred over efavirenz when their efficacy outcomes are identical. For a continuous outcome, we might take , where reflects considerations of cost, clinical significance and possibly the safety profiles of the two treatments (if not incorporated into a vector-valued outcome). For an ordered categorical outcome, the definition of may be more complicated. We shall take the definition of as given and focus on the evaluation of for predicting . The target is an intrinsic characteristic of an individual patient, which suggests that can be evaluated using well-known quantities in prediction and classification [e.g., Zhou, Obuchowski and McClish (2002), Pepe (2003), Zou et al. (2011)]. For a binary marker, it makes sense to consider the true and false positive rates, defined as and , respectively. For a continuous marker, it is customary to consider the ROC curve defined as
Here and in the sequel, we use to denote a generic (conditional) distribution function, with the subscript indicating the random variable(s) concerned. The ROC curve is simply a plot of TPR versus FPR for classifiers of the form , with the threshold ranging over all possible values.
Because is never observed, the existing methodology for evaluating predictors, which generally assumes that can be observed, cannot be used directly to evaluate a predictive biomarker. Nonetheless, we note that TPR, FPR and ROC are all determined by , which can be recovered using Bayes’ rule from the marginal distribution of and the conditional probability . For a binary marker, and are negative and positive predictive values, respectively,
where . For a continuous marker, we have
Since is fully observed, the identifiability of would follow from that of . Once an estimate of is available, it can be substituted into the above displays together with an empirical estimate of or , depending on the nature of .
Despite its simple appearance, is not straightforward to estimate. In fact, for any conceivable form of , the quantity is not empirically identifiable because it involves the joint distribution of and given . Owing to randomization, it is straightforward to identify
for each , and to estimate it from a regression analysis for given and . However, the dependence structure of and given is not identifiable from the data [e.g., Gadbury and Iyer (2000)], which is also known as the fundamental problem of causal inference [Holland (1986)]. Because is not determined by the “marginals” (), its identification and estimation require additional information or assumptions about the dependence between and given . For a binary outcome, this can be achieved by assuming monotonicity [i.e., with probability 1] as in Huang, Gilbert and Janes (2012). The monotonicity assumption corresponds to maximal positive dependence of and .
For a general outcome and without assuming monotonicity, we develop alternative methods by adapting the techniques of Dodd and Pepe (2003) and Zhang et al. (2013). To account for the dependence of and , we start by conditioning on relevant covariates that are associated with both outcomes. Let denote a vector of such covariates measured at baseline, which may include prognostic factors and effect modifiers. In the THRIVE study, may include gender, race, and baseline age and body mass index. We include as a component of and write , where consists of the additional baseline covariates. Writing , a conditioning argument yields
| (3) |
Because is empirically identifiable and estimable, the challenge now is to identify and estimate .
If is sufficient for explaining the dependence between and , then we can expect that
| (4) |
that is, that and are conditionally independent given . This assumption cannot be verified with the observed data and must be based on external information. Under assumption (4), the joint distribution of and given is determined by the “marginals”
which are straightforward to identify and estimate. In reality, assumption (4) can be violated because may not explain all the dependence between and . Such violations can be examined in a sensitivity analysis based on a latent variable that accounts for any residual dependence between and . Under this approach, assumption (4) is relaxed as follows:
| (5) |
where is a subject-specific latent variable that is independent of . In other words, represents what is missing from that makes assumption (4) break down. Assumption (5) alone is not sufficient to identify because is unobserved. However, by specifying certain quantities related to , we can perform a sensitivity analysis based on assumption (5), as we demonstrate in the next section.
3 Methodology
We now describe methods for estimating the aforementioned performance measures (TPR, FPR and ROC). As indicated earlier, we will start by estimating under assumptions (4) and (5). This can be done using a direct approach and an indirect approach, to be described in Sections 3.1 and 3.2, respectively. The direct and indirect approaches are based on models for and , respectively, which we refer to as benefit and outcome models. A benefit model is directly informative about and thus more interpretable in the present context, while an outcome model is more familiar to practitioners and easier to estimate and validate using standard techniques. Further comments comparing the two approaches are given at the end of Section 3.2 after the approaches are described and in Section 5. In Section 3.3 we show how to convert an estimate of into one of . Estimates of the performance measures of interest are given in Section 3.4.
3.1 Direct estimation of based on a Benefit model
A benefit model is a parametric model for , such as the following generalized linear model (GLM):
| (6) |
where is the regression parameter and is an inverse link function. Since is binary, the probit and logit links are natural choices.
Suppose the conditional independence assumption (4) holds. To gain some intuition, consider a discrete taking values in . Within each stratum defined by , assumption (4) implies that and are independent of each other, as if they arise from different subjects, which we assume are independent. In other words, given that , the natural pair is identically distributed as the artificial pair . If and , then is observable as , so that can be estimated by
| (7) |
where , , and denotes the size of (; ).
The question is how to generalize this idea to a nondiscrete . To follow the logic of (7), one would need to find subjects from different treatment groups with the same value of , which becomes difficult when has continuous components (4 in our example). To overcome that problem, we borrow ideas from Dodd and Pepe (2003), who consider semiparametric regression for the area under the ROC curve, and work with an expanded model given by
| (8) |
where , and . The new features of model (8) relative to model (6) are introduced for the sole purpose of estimating . Our research question does not pertain to the left-hand side of (8) or the regression coefficient . However, assumption (4) implies that . Thus, when , model (8) reduces to model (6) with
| (9) |
In that sense, model (8) is a helper model that allows us to estimate model (6) with the observed data. Let and let denote the size of (). Then the regression parameter in model (8) can be estimated by solving the equation
| (10) |
where
As suggested by Dodd and Pepe (2003), equation (10) need not include all possible pairs ; it could be based on a subset of pairs such that , where denotes Euclidean norm, for some . The choice of represents a bias-variance trade-off, where a larger leads to better efficiency and stability and also more sensitivity to the last component of model (8).
The approach just described relies heavily on the conditional independence assumption (4), which relates model (8) to model (6) through equation (9). Equation (9) does not hold when assumption (4) is violated. However, under alternative assumptions, we have
| (11) |
for a scalar . The key assumptions for (11) include assumption (5) and a GLM-like structure analogous to model (6):
| (12) |
where . In Section A of the supplemental article [Zhang et al. (2014)], we state additional assumptions that lead to (11) and give an expression for . Since is identifiable and estimable using the techniques described earlier, can be estimated as soon as is known or estimated. Unfortunately, is unidentifiable from the observed data. For the probit and logit links, we show in Section A of the supplemental article [Zhang et al. (2014)] that can take any value greater than . Thus, when assumption (4) is in doubt, we can perform a sensitivity analysis based on specified values of , with corresponding to conditional independence.
3.2 Indirect estimation of based on an outcome model
An outcome model is a parametric model, say, , for the conditional distribution of given and , specified up to a finite-dimensional parameter . Let denote the associated probability density or mass function. A typical outcome model would be a GLM with the following mean structure:
| (13) |
where and is an inverse link function. The parameter can be estimated by maximizing the likelihood , and the resulting maximum likelihood estimate (MLE) will be denoted by . Because of randomization, the outcome model implies that
which can be estimated by substituting for .
Under the conditional independence assumption (4), the joint distribution
is identified as
and estimated by replacing with . Write
where the superscript CI stands for conditional independence. The corresponding estimate of is then given by
When assumption (4) is in doubt, we can perform a sensitivity analysis based on assumption (5), which implies that
where we generalize the previous notation in an obvious way (with as an additional conditioning variable). This suggests that we specify a model, say, , for the conditional distribution of given , with a finite-dimensional parameter . Analogous to the GLM (13), we work with a generalized linear mixed model (GLMM) with
| (15) |
where . The GLMM is not completely identified without additional information, and we propose a sensitivity analysis based on specified values of (or, rather, ), which is described in Section B of the supplemental article [Zhang et al. (2014)].
It is worth mentioning that the random effect has a different interpretation here than in Section 3.1. In model (15), represents an unobserved prognostic factor which affects both potential outcomes in the same direction; a change in may or may not have much effect on the treatment benefit , depending on the precise definition of and model (15). Although one could incorporate a random treatment effect into model (15), the resulting method will likely become very complicated. In model (12), acts like an effect modifier in that a change in leads directly to a change in the probability of a desirable treatment benefit. (Here we use the term effect modifier in a heuristic sense which may or may not agree with an interaction-based definition.) Thus, aside from modeling assumptions, the direct and indirect approaches also differ in how they deal with departures from assumption (4). The indirect approach is designed to address violations of assumption (4) due to an unmeasured prognostic factor, whereas the direct approach is more appropriate for violations of assumption (4) due to an unmeasured effect modifier.
3.3 Estimation of
Equations (2) and (2) suggest that evaluation of a predictive biomarker can be based on and the marginal distribution of . Because the latter is straightforward to estimate, this section is focused on estimation of with a given estimate of , say, , which may be obtained using any one of the proposed methods. For a binary marker, equation (3) suggests that can be estimated by . We therefore assume that is continuous in the rest of this section.
We propose to estimate by substituting an estimate of into equation (3). One could specify a parametric model for , however, this can be difficult because the dimension of can be rather large (5 in our example). We therefore exploit the fact that is only one-dimensional and employ nonparametric regression techniques in estimating . Let be a kernel function and a bandwidth parameter. Then we can estimate by
This, together with , can be substituted into equation (3) to estimate as
An important question here is how to choose the bandwidth , for which we propose a cross-validation approach. The estimate can be regarded as a nonparametric regression of on , and its predictive accuracy can be assessed by comparing the “response” with the estimate . We propose to partition the sample into a training set and a validation set and choose a value of that minimizes the average of in the validation set with estimated from the training set using bandwith .
3.4 Estimation of TPR, FPR and ROC
Given from Section 3.3, the parameters of interest can be estimated using equations (2) and (2). For a binary marker, this leads to
where . For a continuous marker, we have
where
An asymptotic analysis of these estimates can be rather tedious, especially because involves smoothing and cross-validation. For inference, we recommend the use of bootstrap confidence intervals. To account for all variability in the estimates, the entire estimation procedure, including bandwidth selection based on cross-validation, should be repeated for each bootstrap sample.
4 Application to the THRIVE study
We now apply the methods of Section 3 to the THRIVE study introduced in Section 1, a randomized, double-blind, double-dummy, noninferiority trial at 98 hospitals or medical centers in 21 countries [Cohen et al. (2011)]. The THRIVE study compared rilpivirine with efavirenz for treating HIV-1 in treatment-naive adults, in the presence of common background nucleoside or nucleotide reverse transcriptase inhibitors (N[t]RTIs). The study enrolled 680 adult patients who were naive to antiretroviral therapy, with a screening viral load of at least 5000 copies per ml and viral sensitivity to N(t)RTIs. The patients were randomized in a ratio to receive oral rilpivirine 25 mg once daily or efavirenz 600 mg once daily, in addition to an investigator-selected regimen of background N(t)RTIs.
The outcome of interest to us is virologic response (viral load below 50 copiesml) at week 48 of treatment, with patient discontinuation (about 5%) counted as failure. The observed virologic response rates are 86% and 82% in the rilpivirine and efavirenz groups, respectively, and the difference between the two groups (3.5%; 95% CI: 1.7–8.8%) meets a prespecified noninferiority criterion based on a 12% margin (). Thus, rilpivirine appears comparable to, if not better than, efavirenz in terms of population-level efficacy. However, Figure 1 suggests that individual patients respond differently to the two therapies and that baseline viral load and CD4 cell count could be used as predictive biomarkers. As indicated earlier, we will for safety reasons define individual-level treatment benefit as , where and denote potential outcomes for efavirenz and rilpivirine, respectively.
Baseline viral load and CD4 cell count are both log-transformed before entering the benefit and outcome models as covariates. In addition to these biomarkers, the covariate vector also includes gender, race (black, white or other), age and body mass index at baseline. For the direct approach of Section 3.1, the benefit model is a logistic regression model given by (6), with the aforementioned covariates as linear terms (and no interactions), and the helper model is given by (8) with the same link. For the indirect approach of Section 3.2, the outcome model is a logistic regression model similar to (13) except that interactions of with are limited to the two biomarkers. The selection of covariates and interactions in these models is based on subject matter knowledge and not on statistical tests. Estimation of model (8) is based on the 1% of pairs (of control and experimental patients) that are most similar in terms of , as suggested by Dodd and Pepe (2003). (Other proportions, from 0.001 to 1, have been attempted without yielding a material difference.) Under the indirect approach, the simplified method in Web Appendix B is used to estimate for a given . In any case, estimates of are converted into estimates of using the kernel smoothing method of Section 3.3, with a Gaussian kernel and a cross-validated bandwidth. The cross-validation is based on a random partition of the sample into a training set and a validation set, and the bandwidth is chosen among using the minimum mean squared error criterion. The formulas of Section 3.4 are used to obtain estimates of ROC curves, and the trapezoidal rule is then employed in calculating the associated AUCs. The above procedure is performed for both biomarkers on the original sample as well as 200 bootstrap samples. Pointwise 90% confidence intervals for ROC curves are obtained using a simple bootstrap percentile method, and bootstrap standard errors are used for inference on AUCs (and AUC differences between the two biomarkers).
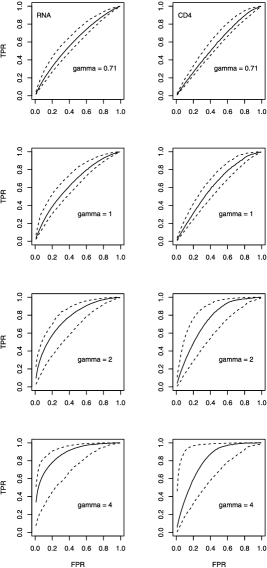
Figure 2 gives a side-by-side comparison of ROC curves for the two biomarkers, estimated using the direct approach of Section 3.1 with . The value corresponds to assumption (4) of conditional independence, while the value 0.71 is a theoretical lower bound. The associated AUC estimates and standard errors are shown in the upper half of Table 1. Both Figure 2 and the relevant portion of Table 1 show that the two biomarkers are useful as predictive biomarkers, with ROC curves above the diagonal and AUCs greater than 0.5 after accounting for sampling variability. The performance of each biomarker does appear to depend heavily on the value of ; the AUC estimate increases dramatically with increasing . This pattern is confirmed by additional analyses based on other values of (results not shown). Given the remarks at the end of Section 3.2, these results suggest that evaluation of a predictive biomarker can be rather sensitive to an unmeasured effect modifier. On the other hand, for each value of , the AUC estimate for baseline viral load is higher than that for baseline CD4 cell count, although the difference is not statistically significant. These results suggest that comparison of predictive biomarkers may be less sensitive to the choice of , even though this particular data set does not provide strong evidence that baseline viral load is better than baseline CD4 cell count as a predictive biomarker. Whether we are evaluating a single marker or comparing two markers, there is an obvious relationship between increasing and greater variability in the estimates, as indicated by widening confidence intervals in Figure 2 and increasing standard errors in Table 1.
| Sensitivity parameter | Point estimate | Standard error | ||||
|---|---|---|---|---|---|---|
| RNA | CD4 | Diff. | RNA | CD4 | Diff. | |
| Direct approach | ||||||
| 0.71 | 0.61 | 0.58 | 0.03 | 0.04 | 0.03 | 0.03 |
| 1 | 0.65 | 0.63 | 0.03 | 0.05 | 0.04 | 0.05 |
| 2 | 0.77 | 0.75 | 0.02 | 0.06 | 0.08 | 0.08 |
| 4 | 0.88 | 0.80 | 0.08 | 0.07 | 0.10 | 0.13 |
| Indirect approach | ||||||
| 0 | 0.64 | 0.59 | 0.05 | 0.04 | 0.04 | 0.05 |
| 1.8 | 0.65 | 0.60 | 0.06 | 0.05 | 0.05 | 0.05 |
| 4 | 0.68 | 0.64 | 0.04 | 0.07 | 0.07 | 0.08 |
| 8 | 0.72 | 0.70 | 0.02 | 0.09 | 0.09 | 0.11 |
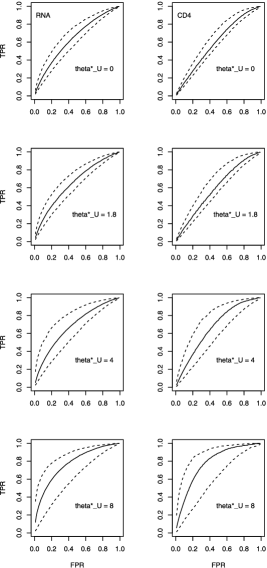
Figure 3 gives another comparison of the two biomarkers based on ROC curves estimated using the indirect approach of Section 3.2 with . Here, the value corresponds to conditional independence, and the value 1.8 is a lower confidence bound (to be discussed later). The associated AUC estimates and standard errors are shown in the lower half of Table 1. These results are consistent with those from the direct approach in suggesting that both biomarkers are useful as predictive biomarkers. In particular, the results for conditional independence () are fairly consistent with their counterparts under the direct approach (with ). Like Figure 2, Figure 3 also shows an increasing trend for the predictive performance of each biomarker as a function of the sensitivity parameter . The trend is confirmed for additional values of , although the results are not shown. Thus, considering the remarks at the end of Section 3.2, it appears that evaluation of a predictive biomarker can also be sensitive to an unmeasured prognostic factor. The results from the indirect approach reinforce the previous observation that baseline viral load appears to perform better than baseline CD4 cell count, although the differences here also fail to reach statistical significance. As is the case with the direct approach, increasing tends to produce greater variability in the estimates.
Although the uncertainty in comparing the two biomarkers could potentially be reduced by an increased sample size, some uncertainty will likely remain in evaluating each individual marker, given the apparent dependence on sensitivity parameters. Nonetheless, the increasing trend observed under both approaches suggests that a lower bound for predictive performance may be available under each approach. For the direct approach, the lower bound is given by , as noted in Section 3.1. For the indirect approach, a lower bound for (and hence for the performance of each biomarker) may be available from longitudinal data (see Web Appendix B). For the THRIVE study, the lower bound for is estimated as 2.5 (95% CI: 1.8–3.7, based on 1000 bootstrap samples) from a GLMM analysis of repeated measurements at 24, 32, 40 and 48 weeks. Although earlier measurements (baseline through 20 weeks) are also available, we restrict our analysis to the later measurements in order to reduce misspecification bias; see Zhang et al. [(2013), Section 4] for a detailed explanation of this strategy. This GLMM analysis suggests that, under the additional assumptions given in Web Appendix B, the value represents the worst case scenario for the indirect approach. The corresponding ROC and AUC estimates are better than those for under the direct approach and thus more informative as lower bounds.
Our ROC analyses under both (direct and indirect) approaches also illustrate that measures of predictive accuracy need not correlate with interactions. Although baseline CD4 cell count exhibits a more dramatic interaction in Figure 1, there is no indication (in the same data set) that it outperforms baseline viral load as a predictive biomarker.
5 Discussion
In this article we have proposed new methods for evaluating predictive biomarkers in the potential outcome framework of Huang, Gilbert and Janes (2012). Instead of monotonicity, our starting point is conditional independence of potential outcomes given observed covariates. Possible departures from the latter assumption can be addressed by incorporating a random effect that accounts for any residual dependence between potential outcomes. Because the random effect models are not completely identifiable, we propose a sensitivity analysis approach based on quantities related to the random effect. Our analysis of the THRIVE data reveals a great deal of sensitivity for the performance of each individual biomarker and much less sensitivity for the comparison of the two markers. Despite the uncertainty about individual biomarkers, the lower bounds on their predictive performance, available under both (direct and indirect) approaches, show that they are both useful as predictive biomarkers. For comparing the two markers, our analysis does not show much sensitivity and does not indicate a significant difference in the predictive performance of the two markers.
There does appear to be a lot of sensitivity (particularly in the upper portion) in quantifying the performance of an individual marker. Such sensitivity introduces additional uncertainty into the overall conclusion of the analysis, which is certainly undesirable. We see this as a reminder of the inherent limitation of the observed data for answering certain questions. As in many other statistical problems (e.g., missing data, censoring, confounding), the parameters of interest to us are not identifiable from the observed data without making untestable assumptions. When such assumptions are in doubt, the parameters are partially identified and the associated inference cannot be as sharp as that for point-identified parameters [Manski (2003)]. It may be disappointing to see that different assumptions (about the sensitivity parameter) can lead to a wide range for the parameter of interest. On the other hand, one could argue that the sensitivity analysis serves its purpose well by revealing the limitation of the available data and information.
In theory, point identification is achieved under the conditional independence assumption (6), which requires that the observed covariates be sufficient for explaining the dependence between the potential outcomes. Although we may never be certain that assumption (6) holds, it seems reasonable to believe that the assumption will get close to being true with a growing set of relevant covariates obtained from increasing knowledge of the disease. The more we know about the disease, the more information we have about relevant covariates, the more confidence we should be able to place in assumption (6). In practice, it may be difficult to determine when we have sufficient information to rely on assumption (6) and when we have to perform a sensitivity analysis. One possible solution would be a Bayesian approach with an informative prior on the sensitivity parameter which quantifies our uncertainty about assumption (6). As we become more confident about assumption (6), the prior will become more concentrated at or near that assumption.
Each of the direct and indirect approaches has unique advantages. The direct approach is able to accommodate complex definitions of treatment benefit involving several outcome variables of arbitrary types, as long as they are all observed. The indirect approach is best suited for a single outcome of primary interest. Although the outcome model can include multiple outcomes in principle, their dependence structure can be difficult to specify and estimate. Even for a single outcome, the indirect approach requires a greater amount of modeling (in the sense that an outcome model implies a benefit model) and is therefore more prone to misspecification bias. On the other hand, the indirect approach is able to use all the information in the observed outcome data and therefore may have an efficiency advantage. Finally, for sensitivity analysis, the direct approach is more appropriate for an unmeasured effect modifier, and the indirect approach for an unmeasured prognostic factor. In practice, we recommend that both approaches be used in a complementary fashion, as in our analysis of the THRIVE data.
A reviewer has pointed out that some elements of personal judgment may be involved in choosing among different treatments. While this is not a major issue in the THRIVE data, where the definition of a treatment benefit is quite objective, it can certainly become a major issue in other therapeutic areas such as weight loss. For example, some patients may be willing to accept the extra risks of a surgical procedure (relative to a nonsurgical one) for an additional loss of 20 pounds, while others may not. To incorporate such personal judgment into the proposed approach, we could allow to vary across patients, and we would need to be able to measure for individual patients or at least be able to predict using measurable individual characteristics. In the latter case, the methodology will need to be modified to incorporate a prediction model for and the associated variability. It will be of interest to explore that possibility in the context of a suitable application.
Because of the complexity of the proposed methodology, a sample size formula is not yet available; however, for a given application, one could perform a simulation study to gauge the adequacy (in terms of power and precision) of a proposed sample size. Such an assessment should obviously consider the objective of the analysis (e.g., evaluating a single biomarker versus comparing two or more biomarkers). In addition, the nonparametric regression in Section 3.3 may imply a higher requirement on the sample size than do the other parts of the methodology, which are based on parametric regression techniques. A sample size that is inadequate for one-dimensional nonparametric regression may compromise the performance of the methods.
Acknowledgment
We thank the Editor (Dr. Karen Kafadar), the Associate Editor and three anonymous reviewers for their insightful and constructive comments, which have greatly improved the manuscript. The views expressed in this article do not represent the official position of the U.S. Food and Drug Administration.
References
- Cohen et al. (2011) {barticle}[pbm] \bauthor\bsnmCohen, \bfnmCalvin J.\binitsC. J., \bauthor\bsnmAndrade-Villanueva, \bfnmJaime\binitsJ., \bauthor\bsnmClotet, \bfnmBonaventura\binitsB., \bauthor\bsnmFourie, \bfnmJan\binitsJ., \bauthor\bsnmJohnson, \bfnmMargaret A.\binitsM. A., \bauthor\bsnmRuxrungtham, \bfnmKiat\binitsK., \bauthor\bsnmWu, \bfnmHao\binitsH., \bauthor\bsnmZorrilla, \bfnmCarmen\binitsC., \bauthor\bsnmCrauwels, \bfnmHerta\binitsH., \bauthor\bsnmRimsky, \bfnmLaurence T.\binitsL. T., \bauthor\bsnmVanveggel, \bfnmSimon\binitsS., \bauthor\bsnmBoven, \bfnmKatia\binitsK. and \bauthor\bsnmTHRIVE study group (\byear2011). \btitleRilpivirine versus efavirenz with two background nucleoside or nucleotide reverse transcriptase inhibitors in treatment-naive adults infected with HIV-1 (THRIVE): A phase 3, randomised, non-inferiority trial. \bjournalLancet \bvolume378 \bpages229–237. \biddoi=10.1016/S0140-6736(11)60983-5, issn=1474-547X, pii=S0140-6736(11)60983-5, pmid=21763935 \bptokimsref\endbibitem
- Dodd and Pepe (2003) {barticle}[mr] \bauthor\bsnmDodd, \bfnmLori E.\binitsL. E. and \bauthor\bsnmPepe, \bfnmMargaret Sullivan\binitsM. S. (\byear2003). \btitleSemiparametric regression for the area under the receiver operating characteristic curve. \bjournalJ. Amer. Statist. Assoc. \bvolume98 \bpages409–417. \biddoi=10.1198/016214503000198, issn=0162-1459, mr=1995717 \bptokimsref\endbibitem
- Foster, Taylor and Ruberg (2011) {barticle}[mr] \bauthor\bsnmFoster, \bfnmJared C.\binitsJ. C., \bauthor\bsnmTaylor, \bfnmJeremy M. G.\binitsJ. M. G. and \bauthor\bsnmRuberg, \bfnmStephen J.\binitsS. J. (\byear2011). \btitleSubgroup identification from randomized clinical trial data. \bjournalStat. Med. \bvolume30 \bpages2867–2880. \biddoi=10.1002/sim.4322, issn=0277-6715, mr=2844689 \bptokimsref\endbibitem
- Gadbury and Iyer (2000) {barticle}[pbm] \bauthor\bsnmGadbury, \bfnmG. L.\binitsG. L. and \bauthor\bsnmIyer, \bfnmH. K.\binitsH. K. (\byear2000). \btitleUnit-treatment interaction and its practical consequences. \bjournalBiometrics \bvolume56 \bpages882–885. \bidissn=0006-341X, pmid=10985231 \bptokimsref\endbibitem
- Gail and Simon (1985) {barticle}[pbm] \bauthor\bsnmGail, \bfnmM.\binitsM. and \bauthor\bsnmSimon, \bfnmR.\binitsR. (\byear1985). \btitleTesting for qualitative interactions between treatment effects and patient subsets. \bjournalBiometrics \bvolume41 \bpages361–372. \bidissn=0006-341X, pmid=4027319 \bptokimsref\endbibitem
- Holland (1986) {barticle}[mr] \bauthor\bsnmHolland, \bfnmPaul W.\binitsP. W. (\byear1986). \btitleStatistics and causal inference (with discussion). \bjournalJ. Amer. Statist. Assoc. \bvolume81 \bpages945–970. \bidissn=0162-1459, mr=0867618 \bptnotecheck related \bptokimsref\endbibitem
- Huang, Gilbert and Janes (2012) {barticle}[mr] \bauthor\bsnmHuang, \bfnmYing\binitsY., \bauthor\bsnmGilbert, \bfnmPeter B.\binitsP. B. and \bauthor\bsnmJanes, \bfnmHolly\binitsH. (\byear2012). \btitleAssessing treatment-selection markers using a potential outcomes framework. \bjournalBiometrics \bvolume68 \bpages687–696. \biddoi=10.1111/j.1541-0420.2011.01722.x, issn=0006-341X, mr=3055173 \bptokimsref\endbibitem
- Karapetis et al. (2008) {barticle}[pbm] \bauthor\bsnmKarapetis, \bfnmChristos S.\binitsC. S., \bauthor\bsnmKhambata-Ford, \bfnmShirin\binitsS., \bauthor\bsnmJonker, \bfnmDerek J.\binitsD. J., \bauthor\bsnmO’Callaghan, \bfnmChris J.\binitsC. J., \bauthor\bsnmTu, \bfnmDongsheng\binitsD., \bauthor\bsnmTebbutt, \bfnmNiall C.\binitsN. C., \bauthor\bsnmSimes, \bfnmR. John\binitsR. J., \bauthor\bsnmChalchal, \bfnmHaji\binitsH., \bauthor\bsnmShapiro, \bfnmJeremy D.\binitsJ. D., \bauthor\bsnmRobitaille, \bfnmSonia\binitsS., \bauthor\bsnmPrice, \bfnmTimothy J.\binitsT. J., \bauthor\bsnmShepherd, \bfnmLois\binitsL., \bauthor\bsnmAu, \bfnmHeather-Jane\binitsH.-J., \bauthor\bsnmLanger, \bfnmChristiane\binitsC., \bauthor\bsnmMoore, \bfnmMalcolm J.\binitsM. J. and \bauthor\bsnmZalcberg, \bfnmJohn R.\binitsJ. R. (\byear2008). \btitleK-ras mutations and benefit from cetuximab in advanced colorectal cancer. \bjournalN. Engl. J. Med. \bvolume359 \bpages1757–1765. \biddoi=10.1056/NEJMoa0804385, issn=1533-4406, pii=359/17/1757, pmid=18946061 \bptokimsref\endbibitem
- Manski (2003) {bbook}[mr] \bauthor\bsnmManski, \bfnmCharles F.\binitsC. F. (\byear2003). \btitlePartial Identification of Probability Distributions. \bpublisherSpringer, \blocationNew York. \bidmr=2151380 \bptokimsref\endbibitem
- Paik et al. (2004) {barticle}[pbm] \bauthor\bsnmPaik, \bfnmSoonmyung\binitsS., \bauthor\bsnmShak, \bfnmSteven\binitsS., \bauthor\bsnmTang, \bfnmGong\binitsG., \bauthor\bsnmKim, \bfnmChungyeul\binitsC., \bauthor\bsnmBaker, \bfnmJoffre\binitsJ., \bauthor\bsnmCronin, \bfnmMaureen\binitsM., \bauthor\bsnmBaehner, \bfnmFrederick L.\binitsF. L., \bauthor\bsnmWalker, \bfnmMichael G.\binitsM. G., \bauthor\bsnmWatson, \bfnmDrew\binitsD., \bauthor\bsnmPark, \bfnmTaesung\binitsT., \bauthor\bsnmHiller, \bfnmWilliam\binitsW., \bauthor\bsnmFisher, \bfnmEdwin R.\binitsE. R., \bauthor\bsnmWickerham, \bfnmD. Lawrence\binitsD. L., \bauthor\bsnmBryant, \bfnmJohn\binitsJ. and \bauthor\bsnmWolmark, \bfnmNorman\binitsN. (\byear2004). \btitleA multigene assay to predict recurrence of tamoxifen-treated, node-negative breast cancer. \bjournalN. Engl. J. Med. \bvolume351 \bpages2817–2826. \biddoi=10.1056/NEJMoa041588, issn=1533-4406, pii=NEJMoa041588, pmid=15591335 \bptokimsref\endbibitem
- Pepe (2003) {bbook}[mr] \bauthor\bsnmPepe, \bfnmMargaret Sullivan\binitsM. S. (\byear2003). \btitleThe Statistical Evaluation of Medical Tests for Classification and Prediction. \bseriesOxford Statistical Science Series \bvolume28. \bpublisherOxford Univ. Press, \blocationOxford. \bidmr=2260483 \bptokimsref\endbibitem
- Pocock et al. (2002) {barticle}[pbm] \bauthor\bsnmPocock, \bfnmStuart J.\binitsS. J., \bauthor\bsnmAssmann, \bfnmSusan E.\binitsS. E., \bauthor\bsnmEnos, \bfnmLaura E.\binitsL. E. and \bauthor\bsnmKasten, \bfnmLinda E.\binitsL. E. (\byear2002). \btitleSubgroup analysis, covariate adjustment and baseline comparisons in clinical trial reporting: Current practice and problems. \bjournalStat. Med. \bvolume21 \bpages2917–2930. \biddoi=10.1002/sim.1296, issn=0277-6715, pmid=12325108 \bptokimsref\endbibitem
- Poulson, Gadbury and Allison (2012) {barticle}[mr] \bauthor\bsnmPoulson, \bfnmRobert S.\binitsR. S., \bauthor\bsnmGadbury, \bfnmGary L.\binitsG. L. and \bauthor\bsnmAllison, \bfnmDavid B.\binitsD. B. (\byear2012). \btitleTreatment heterogeneity and individual qualitative interaction. \bjournalAmer. Statist. \bvolume66 \bpages16–24. \biddoi=10.1080/00031305.2012.671724, issn=0003-1305, mr=2934737 \bptokimsref\endbibitem
- Qian and Murphy (2011) {barticle}[mr] \bauthor\bsnmQian, \bfnmMin\binitsM. and \bauthor\bsnmMurphy, \bfnmSusan A.\binitsS. A. (\byear2011). \btitlePerformance guarantees for individualized treatment rules. \bjournalAnn. Statist. \bvolume39 \bpages1180–1210. \biddoi=10.1214/10-AOS864, issn=0090-5364, mr=2816351 \bptokimsref\endbibitem
- Russek-Cohen and Simon (1998) {barticle}[auto:parserefs-M02] \bauthor\bsnmRussek-Cohen, \bfnmE.\binitsE. and \bauthor\bsnmSimon, \bfnmR. M.\binitsR. M. (\byear1998). \btitleEvaluating treatments when a gender by treatment interaction may exist. \bjournalStat. Med. \bvolume16 \bpages455–464. \bptokimsref\endbibitem
- Simon (2008) {barticle}[mr] \bauthor\bsnmSimon, \bfnmRichard\binitsR. (\byear2008). \btitleDevelopment and validation of biomarker classifiers for treatment selection. \bjournalJ. Statist. Plann. Inference \bvolume138 \bpages308–320. \biddoi=10.1016/j.jspi.2007.06.010, issn=0378-3758, mr=2412589 \bptokimsref\endbibitem
- Simon (2010) {barticle}[pbm] \bauthor\bsnmSimon, \bfnmRichard\binitsR. (\byear2010). \btitleClinical trials for predictive medicine: New challenges and paradigms. \bjournalClin. Trials \bvolume7 \bpages516–524. \biddoi=10.1177/1740774510366454, issn=1740-7753, mid=NIHMS589918, pii=1740774510366454, pmcid=4041069, pmid=20338899 \bptokimsref\endbibitem
- Su et al. (2008) {barticle}[mr] \bauthor\bsnmSu, \bfnmXiaogang\binitsX., \bauthor\bsnmZhou, \bfnmTianni\binitsT., \bauthor\bsnmYan, \bfnmXin\binitsX., \bauthor\bsnmFan, \bfnmJuanjuan\binitsJ. and \bauthor\bsnmYang, \bfnmSong\binitsS. (\byear2008). \btitleInteraction trees with censored survival data. \bjournalInt. J. Biostat. \bvolume4 \bpagesArt. 2, 28. \biddoi=10.2202/1557-4679.1071, issn=1557-4679, mr=2383729 \bptokimsref\endbibitem
- Tian et al. (2012) {bmisc}[auto:parserefs-M02] \bauthor\bsnmTian, \bfnmL.\binitsL., \bauthor\bsnmAlizadeh, \bfnmA. A.\binitsA. A., \bauthor\bsnmGentles, \bfnmA. J.\binitsA. J. and \bauthor\bsnmTibshirani, \bfnmR.\binitsR. (\byear2012). \bhowpublishedA simple method for detecting interactions between a treatment and a large number of covariates. Available at \arxivurlarXiv:1212.2995. \bptokimsref\endbibitem
- van der Laan and Robins (2003) {bbook}[mr] \bauthor\bsnmvan der Laan, \bfnmMark J.\binitsM. J. and \bauthor\bsnmRobins, \bfnmJames M.\binitsJ. M. (\byear2003). \btitleUnified Methods for Censored Longitudinal Data and Causality. \bpublisherSpringer, \blocationNew York. \biddoi=10.1007/978-0-387-21700-0, mr=1958123 \bptokimsref\endbibitem
- Zhang et al. (2012) {barticle}[mr] \bauthor\bsnmZhang, \bfnmBaqun\binitsB., \bauthor\bsnmTsiatis, \bfnmAnastasios A.\binitsA. A., \bauthor\bsnmLaber, \bfnmEric B.\binitsE. B. and \bauthor\bsnmDavidian, \bfnmMarie\binitsM. (\byear2012). \btitleA robust method for estimating optimal treatment regimes. \bjournalBiometrics \bvolume68 \bpages1010–1018. \biddoi=10.1111/j.1541-0420.2012.01763.x, issn=0006-341X, mr=3040007 \bptokimsref\endbibitem
- Zhang et al. (2013) {barticle}[mr] \bauthor\bsnmZhang, \bfnmZhiwei\binitsZ., \bauthor\bsnmWang, \bfnmChenguang\binitsC., \bauthor\bsnmNie, \bfnmLei\binitsL. and \bauthor\bsnmSoon, \bfnmGuoxing\binitsG. (\byear2013). \btitleAssessing the heterogeneity of treatment effects via potential outcomes of individual patients. \bjournalJ. R. Stat. Soc. Ser. C. Appl. Stat. \bvolume62 \bpages687–704. \bidissn=0035-9254, mr=3118329 \bptokimsref\endbibitem
- Zhang et al. (2014) {bmisc}[author] \bauthor\bsnmZhang, \binitsZ., \bauthor\bsnmNie, \binitsL., \bauthor\bsnmSoon, \binitsG. and \bauthor\bsnmLiu, \binitsA. (\byear2014). \bhowpublishedSupplement to “The use of covariates and random effects in evaluating predictive biomarkers under a potential outcome framework.” DOI:\doiurl10.1214/14-AOAS773SUPP. \bptokimsref \endbibitem\bptokimsref\endbibitem
- Zhou, Obuchowski and McClish (2002) {bbook}[mr] \bauthor\bsnmZhou, \bfnmXiao-Hua\binitsX.-H., \bauthor\bsnmObuchowski, \bfnmNancy A.\binitsN. A. and \bauthor\bsnmMcClish, \bfnmDonna K.\binitsD. K. (\byear2002). \btitleStatistical Methods in Diagnostic Medicine. \bpublisherWiley, \blocationNew York. \biddoi=10.1002/9780470317082, mr=1915698 \bptokimsref\endbibitem
- Zou et al. (2011) {bbook}[mr] \bauthor\bsnmZou, \bfnmKelly H.\binitsK. H., \bauthor\bsnmLiu, \bfnmAiyi\binitsA., \bauthor\bsnmBandos, \bfnmAndriy I.\binitsA. I., \bauthor\bsnmOhno-Machado, \bfnmLucila\binitsL. and \bauthor\bsnmRockette, \bfnmHoward E.\binitsH. E. (\byear2011). \btitleStatistical Evaluation of Diagnostic Performance: Topics in ROC Analysis. \bpublisherCRC Press, \blocationBoca Raton, FL. \bidmr=3052764 \bptnotecheck year \bptokimsref\endbibitem