Luminosity determination for the deutron-deutron reactions using free and quasi-free reactions with WASA-at-COSY detector
Abstract
Two methods of the luminosity determination for the experiment performed by WASA collaboration to search for - bound state are presented. During the measurement the technique of continous change of the beam momentum in one accelerator cycle (called ramped beam) was applied. This imposes the requirement to determine not only the total integrated luminosity, but also its variation as a function of the beam momentum.
PACS numbers: 21.85.+d, 21.65.Jk, 25.80.-e, 13.75.-n
1 Introduction
The existence of -mesic nuclei in which the meson is bound within a nucleus via the strong interaction was postulated in 1986 by Haider and Liu [1]. Since then - and -mesic bound states have been searched for in many laboratories [2, 3, 4, 5, 6, 7, 8, 9, 10, 11, 12, 13, 14, 15, 16, 17]. Recent theoretical investigations e.g. [18, 19, 20, 21, 22, 23, 24] support the search for and -mesic bound states, however, so far no firm experimental confirmation of the existence of mesic nuclei has been found. The discovery of this new kind of an exotic nuclear matter would be very important for better understanding of the and meson properties and their interaction with nucleons inside nuclear matter [25]. Furthermore it would provide information about the (1535) resonance [26], as well as about the flavour singlet component of the quark-gluon wave function of the and mesons [27].
In November 2010 the search for the - bound state was performed with WASA-at-COSY
facility [28] by measuring
the excitation functions for and reactions near the production threshold [29, 30, 31, 32, 33, 2].
The measurement was carried out with a deuteron beam momentum ramping from 2.127 GeV/c to 2.422 GeV/c, corresponding to the range of the excess energy Q(-70,30) MeV. During an acceleration process the luminosity could vary due to beam losses caused by the interaction with the target and with the rest gas in the accelerator beam line, as well as due to the changes in the beam-target overlap correlated with momentum variation and adiabatic shrinking of the beamsize. Therefore, it is necessary to determine not only the total integrated luminosity but also its dependence on the excess energy.
The total integrated luminosity is determined based on the and quasi free reactions for which the cross sections were already experimentally established. Because of the acceptance variation for the beam momentum range for which ions are stopped between two Forward Detector layers, the excess energy dependence of the luminosity is determined based on quasi-free reaction for which the WASA acceptance is a smooth function of the beam momentum.
In this contribution we present the procedure of the calculation of the integrated luminosity and the determination of the luminosity dependence of the excess energy.
2 Determination of luminosity based on the
reaction
The absolute value of the integrated luminosity was determined using the experimental data on the cross-sections measured by SATURNE collaboration for four beam momenta in range between 1.65 and 2.49 GeV/c [34]. The cross section dependence on the transferred momentum squared may be parametrized as follows [34, 35]:
| (1) |
where parameters and are described as a function of the total energy :
| (2) |
where the values of , and were determined [35] by the fit of the above formula to the cross sections measured at SATURNE [34].
Based on the above parametrization we may determine angular dependence of the cross section using a following relation:
| (3) |
where the Jacobian term is calculated based on the transferred momentum squared in the CM system:
| (4) |
where is the emission angle in the CM frame.
The available experimental data closest to the range of beam momentum used in the WASA-at-COSY experiment for the angular range relevant for our analysis are shown in Fig. 1. Superimposed lines present results of the above described parametrisations for beam momenta the same as experimental points (red and black) and for two exemplary momenta corresponding to Q=0 and Q=-40 MeV.
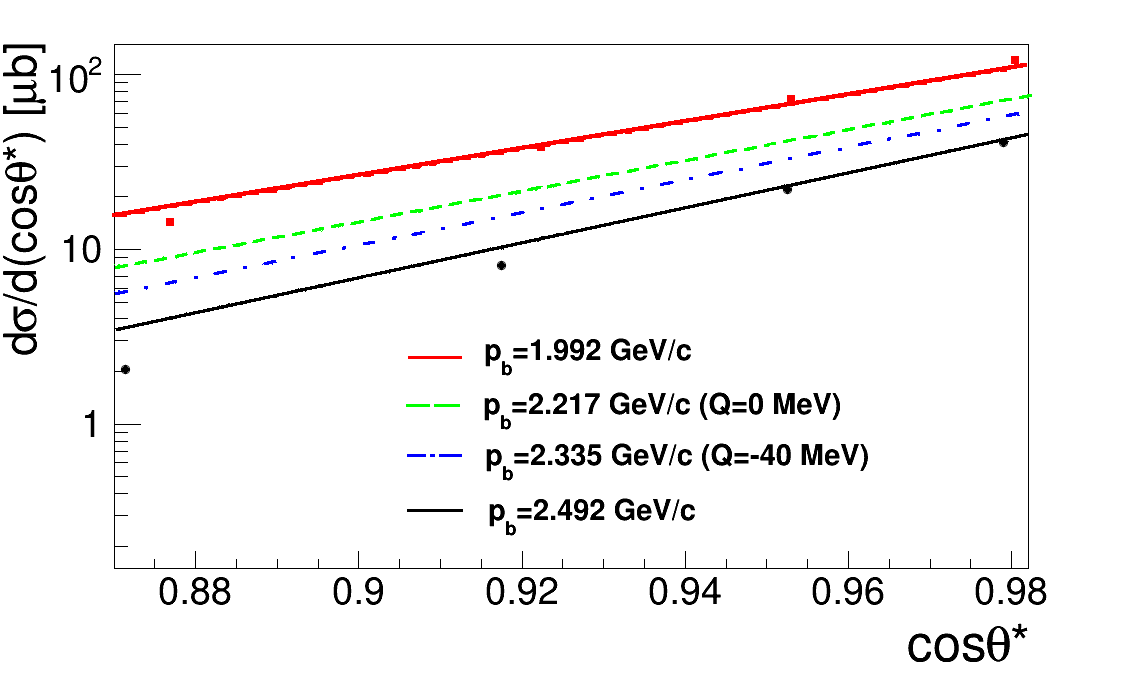
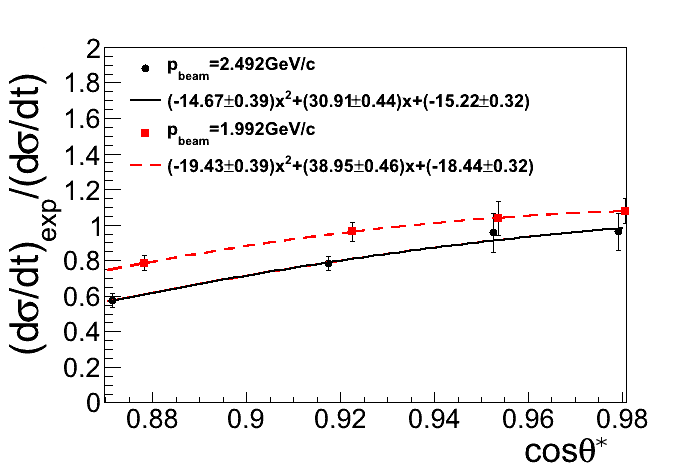
In the angular region of interest the experimental points lie below the curves. Therefore, the correction was applied for the angular range from about 4∘ to 10∘ which corresponds to the (0.88,0.98) for the considered reaction. The ratio between experimental (SATURNE) and parametrized cross section was fitted with second degree polynomial function for both experimental beam momentum values: 1.992 GeV/c and 2.492 GeV/c. Obtained result is presented in the right panel of Fig. 1. The cross section correction is calculated for fixed using the fitted functions and interpolated for the proper beam momentum value from range GeV/c.
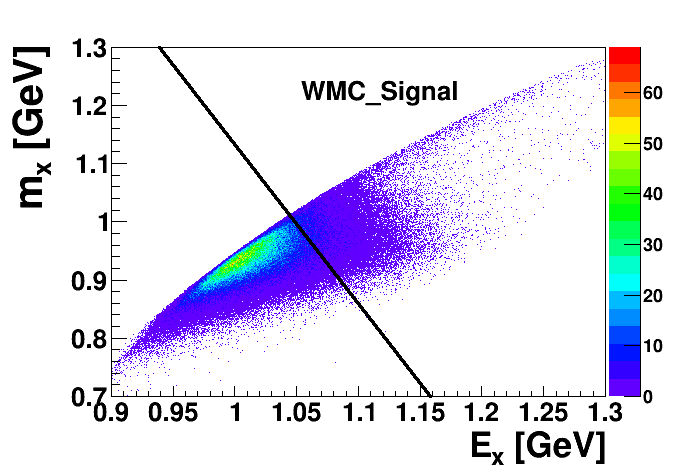
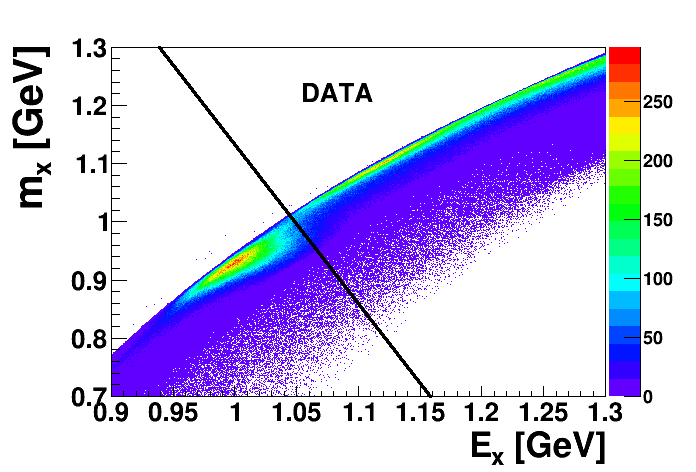
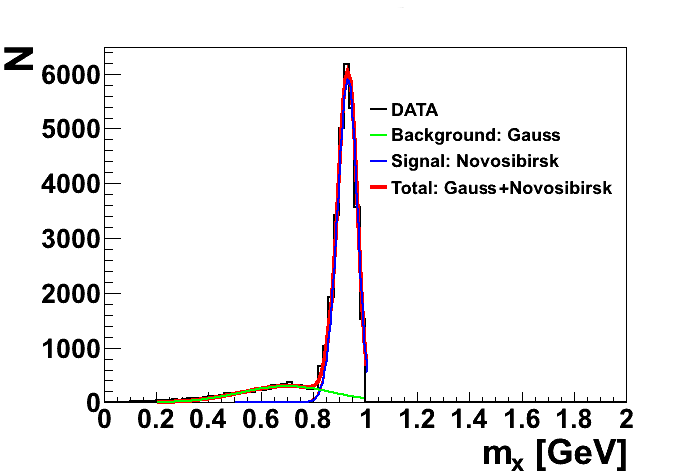
The measurement of the reaction was based on the registration of the outgoing helium in the Forward Detector. Low-energetic ions were stopped in the 3rd layer of the Forward Range Hodoscope, while high-energetic ions were stopped in the 4th layer. The helium identification was based on the E-E method. The outgoing neutrons were identified using the missing mass technique. In order to reduce background originating from quasi-free , the cut in missing mass vs. missing energy spectrum was applied as it is presented in upper panel of Fig. 2. Additionally, for high beam momentum region background was subtracted via fitting the signal and background function to the missing mass spectrum for different intervals of and beam momentum, what is presented in the lower panel of Fig. 2.
In order to calculate the total integrated luminosity, the number of events, efficiency, as well as cross section was determined for 5 intervals of in the range from 0.88 to 0.98 and 5 intervals of excess energy Q in the range from -70 MeV to 30 MeV corresponding to the angular range of the reaction and the beam momentum ramping, respectively. The integrated luminosity was then calculated for each -th interval in following way:
| (5) |
where is the width of the interval. The overall efficiency including reconstruction efficiency and geometrical acceptance of the detector was determined based on the Monte Carlo simulations and is varying between 50% and 70%.
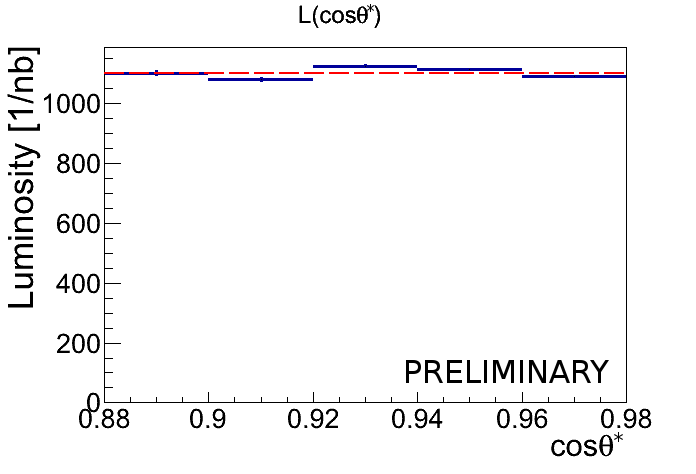
The preliminary luminosity dependence of for whole excess energy range is presented in Fig. 3. The total integrated luminosity was calculated as a weighted average of the luminosities determined for individual intervals:
| (6) |
The average integrated luminosity with its statistical uncertainty equals =(11022). It is marked in Fig. 3 with dashed red line.
3 Luminosity dependence on the excess energy
In order to determine the luminosity dependence on the beam momentum we used the quasi-elastic proton-proton scattering in the deuteron-deuteron collisions: . In this reaction protons from the deuteron beam are scattered on the protons in the deuteron target. We assume that the neutrons are acting only as spectators which means that they do not take part in reactions but move with the Fermi momentum of their parent deuterons.
In the case of quasi-free proton-proton scattering the formula for the calculation of the integrated luminosity can be written in the following form [36]:
| (7) |
The formula is determined based on the fact, that the number of quasi-free scattered protons into the solid angle is proportional to the integrated luminosity L, as well as the inner product of the differential cross section for scattering into the solid angle around and angles expressed in proton-proton CM system: and the probability density of the Fermi momentum distributions: inside the deuteron beam and deuteron target, respectively. The detailed description of the luminosity calculation for quasi-free reaction one can find in Ref. [36].
Due to the complex detection geometry a solid angle corresponding to particular part of the detector cannot be in general expressed in a closed analytical form. Therefore, the integral in above equation was computed with the Monte-Carlo simulation programme, containing the geometry of WASA detection system and taking into account detection and reconstruction efficiencies. The Monte-Carlo simulations were carried out for the deuteron beam momentum range (2.127,2.422)GeV/c corresponding to the experimental ramping. The program first choose randomly the momentum of the nucleon inside the deuteron beam and deuteron target, respectively, according to the Fermi distribution [37]. Then, the total proton-proton invariant mass and the vector of the center-of-mass velocity are determined. Next, the effective proton beam momentum was calculated in the frame where one of the proton is at rest and momentum of protons is generated isotropically in the proton-proton center-of-mass frame. Further on, the momenta of outgoing particles are transformed to the laboratory frame and are used as an input in the simulation of the detection system response with the GEANT computing package. For each of simulated event we assign a weight corresponding to the differential cross section, which is uniquely determined by the scattering angle and the total proton-proton collision energy .
The factor in Eq. 7 is a normalization constant. It results from the fact that the integral is not dimensionless and its units correspond to the units of the cross sections used for the calculations. Therefore, it must be normalized in such a way that the integral over the full solid angle equals to the total cross section for the elastic scattering averaged over the distribution of the total proton-proton invariant mass resulting from the Fermi distribution of the target and beam nucleons. In the absence of the Fermi motion it should be simply equal to a total elastic cross section for a given proton beam momentum. A factor comes from the fact that protons taking part in the scattering are indistinguishable.
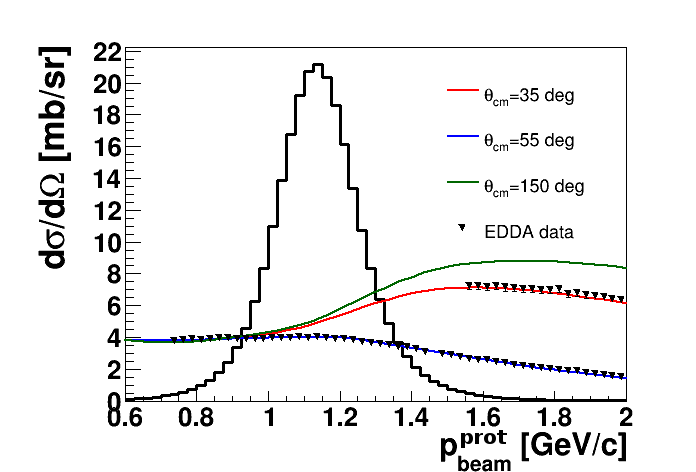
The differential cross section for quasi free reaction is a function of the scattering angle and the total energy in the proton-proton centre-of-mass system which is dependent on effective proton beam momentum seen from the proton in the proton-proton system. In order to calculate it, we have used the cross section values for proton-proton elastic scattering computed based on the SAID program [38] because the EDDA collaboration data base [39] is insufficient. The distribution of the effective beam momentum as well as a comparison of the SAID calculations and the existing differential cross section from the EDDA measurements are shown in Fig. 4. As we can see, the differential cross sections calculated using the SAID programme are in agreement with distributions measured by the EDDA collaboration.
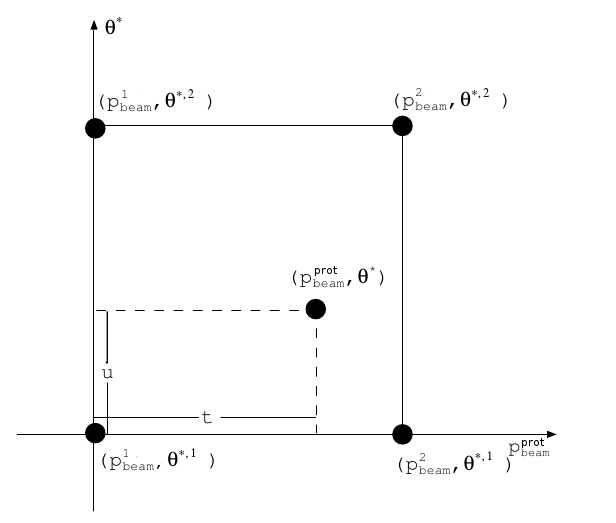
The differential cross section for appropriate and was calculated using bilinear interpolation in the momentum-scattering angle plane according to the formula:
| (8) |
where and variables are defined in right panel of Fig. 4.
The number of experimental events was determined based on conditions and cuts described in details in reference [40]. In the analysis, at the beginning, we carried out primary events selection applying condition of exactly one charged particle in the Forward Detector (FD) and one particle in the Central Detector (CD).
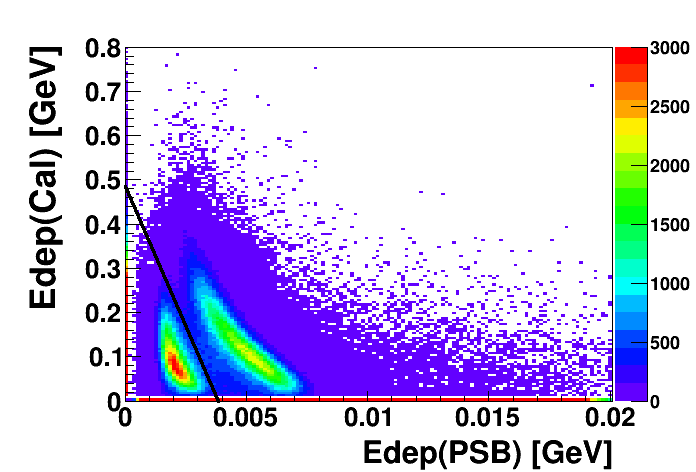
In Ref. [40] we can find detailed studies of the possible background reaction contributions. In case of this analysis the dominating background processes are , and , where the subscripts , and denote the spectators, particles from the beam and from the target, respectively. In order to reject the events corresponding to the charged pions registered in the Central Detector, the cut on the energy deposited in the Electromagnetic Calorimeter (Cal) vs. energy deposited in Plastic Scintillator Barrel (PSB) spectrum was applied and is presented in the Fig. 5.
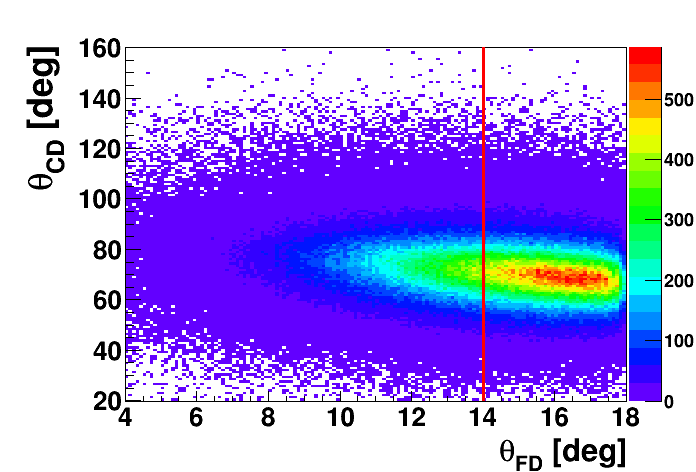
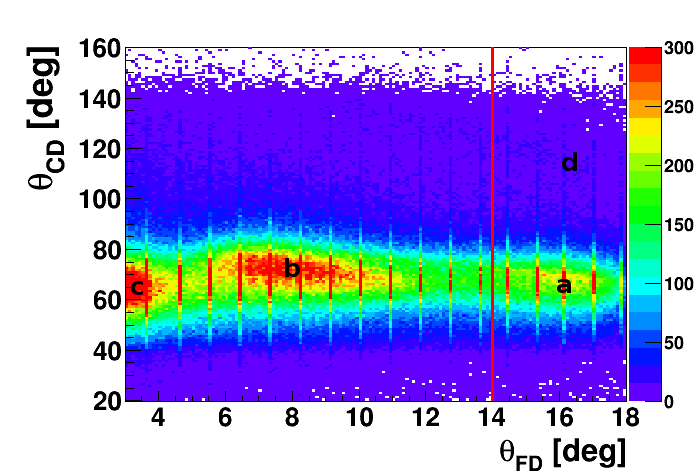
It is not possible to separate quasi-elastic - scattering from the quasi-elastic - scattering, however it was investigated that for the forward scattering angles of about =17∘, the - cross sections are about 20 times smaller than - cross sections and we take this uncertainty of abut 5% as a systematic error to the final result. The applied cut in polar angle is shown in Fig. 6. In order to subtract the background coming from reaction, the range (40,100)∘ was taken into account in further analysis.
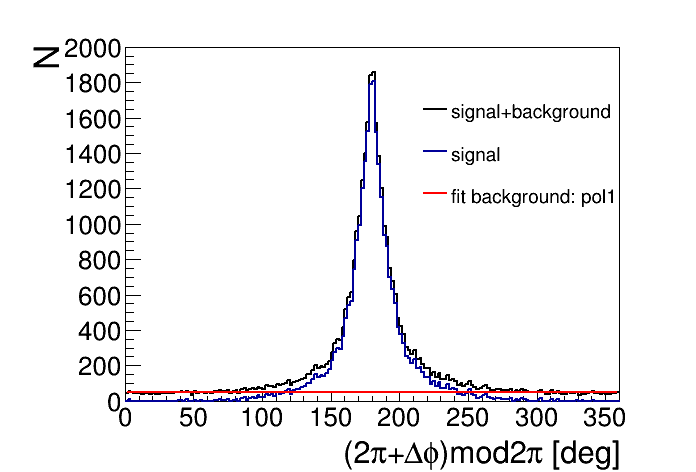
Additionally, the background was subtracted in spectrum. In order to symetrize the background instead of we define (2)mod2. Afterwards, the background was fitted with 1st order polynomial for each of excess energy Q intervals. The exemplary (2)mod2 spectrum is presented in Fig. 7.
After all cuts and conditions described above, the number of experimental data was determined and the luminosity was calculated according to formula (7) for each excess energy interval taking into account also prescaling factor of the applied experimental trigger equal to 4000 as well as shadowing effect equal to 9%. The latter results from the fact that proton is shadowed by the neutron inside the deuteron which reduces the probability of the quasi-elastic scattering. Unfortunately, there are no experimental results about the shadowing in collisions. However, we can try to estimate it based on the probability that a neutron shadows the proton in one deuteron which equals 0.045 [41] and assume that shadowing appears independently in deuteron beam and deuteron target. The rough estimation of the probability that the shadowing will not take place in reaction (1 - 0.045)2 gives about 0.91.
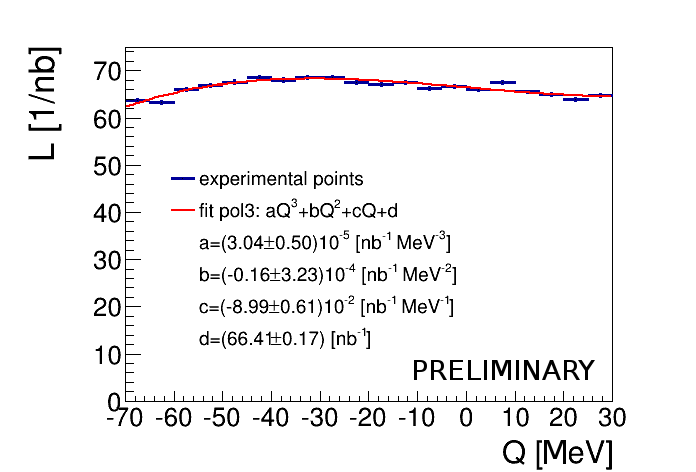
The preliminary result is presented in Fig. 8. The statistical uncertainty of each point is about 1%. The luminosity variation (increase in the excess energy range from about -70MeV to -40MeV, and then decrease) is caused by the change of the beam-target overlapping during the acceleration cycle and also by adiabatic beam size shrinking [42]. The obtained total integrated luminosity within its statistical uncertainty is equal to =(13292). For further analysis the luminosity was fitted by 3 degree polynomial . The fitted function is marked with the red line in Fig. 8.
4 Systematics
In case of the reaction one source of the systematic error originates from the variation of the cuts used for separation of high-energetic helium in Forward Detector and is equal to about 2%. Additionally we have also taken into account an uncertainty due to the method used for the background subtraction amounting to 1.6%. Another source of the luminosity calculation error is connected to normalization to SATURNE experiment and originates from three independent sources: i) statistical error of the SATURNE data (6.5%), ii) normalization uncertainty of the SATURNE data for the cross sections (7%) and iii) assumption of linear interpolation between SATURNE points used for the estimation of the correction for the parametrized cross section presented in Fig. 1 (1.8%).
The systematical errors for analysis resulting from the change of the cuts used for the separation of the quasi-free scattering from the background (Fig. 5 and Fig. 6) is equal to to about 4.1%. The another contribution to the systematical error comes from the assumption of the potential model of the nucleon bound inside the deuteron and is equal to about 0.8%. This uncertainty was established as the difference between results determined using the Paris [37] and the CDBonn [43] potentials. The next source of the systematic error may be attached to the assumption of the bilinear approximation of the cross section shown in Fig. 4 (right). This systematical uncertainty was estimated using assumption in which instead of the interpolation we took the cross section value from the closest data point in the effective proton beam momentum - scattering angle plane. The performed calculations give the difference of about 1.8%. Additionally we have also taken into account an uncertainty related to the background subtraction in (2)mod2 spectra which does not exceed 0.6%. The systematical uncertainty includes also contribution connected to the shadowing effect. Untill now, we have no theoretical estimation of the possible error of this effect calculation, therefore conservatively we take as an systematic uncetainty half of this effect: 4.5%. In the systematical error calculation we also take into account the uncertainty 5% resulting from the background of the quasi-elastic - scattering (Sec. 3). The normalization error includes two contributions: normalization uncertainty of the EDDA data (4%) and the systematical errors for elastic scattering cross-sections (2.7%) [39]. The cross section was approximated by the calculation using the SAID procedure. Because, the SAID cross section very well describes EDDA data, we assume the systematical errors of the differential cross section based on EDDA calculations.
The total integrated luminosity calculated based on and the quasi-free reactions with statistical, systematical and normalization error are equal to and , respectively. The systematical and normalization errors were calculated by adding in quadrature the appropriate contributions described above.
5 Summary
We carried out the luminosity determination for the experiment performed with WASA-at-COSY to search for the - bound states in deuteron-deuteron fusion. The luminosity was calculated based on two reactions: and the quasi-free . We calculated the total average integrated luminosity and compared it for both channels. The obtained results are consistent, however within large normalization errors.
6 Acknowledgements
We acknowledge support by the Foundation for Polish Science - MPD program, co-financed by the European Union within the European Regional Development Fund, by the Polish National Science Center through grant No. 2011/01/B/ST2/00431, Grant PRELUDIUM No 2013/11/N/ST2/04152 and by the FFE grants of the Research Center Jülich.
References
- [1] Q. Haider, L. C. Liu, Phys. Lett. B172, 257 (1986).
- [2] M. Skurzok, P. Moskal, W. Krzemień, Prog. Part. Nucl. Phys. 67, 445 (2012).
- [3] P. Moskal, J. Smyrski, Acta. Phys. Pol. B41, 2281 (2010).
- [4] P. Adlarson et al., Phys. Rev. C87, 035204 (2013).
- [5] W. Krzemien et al., Int. J. Mod. Phys. A24, (2009) 576.
- [6] T. Mersmann et al., Phys. Rev. Lett. 98, (2007) 242301.
- [7] J. Smyrski et al., Phys. Lett. B649, (2007) 258.
- [8] G. A. Sokol et al., arXiv:nucl-ex/9905006 (1999).
- [9] A. Gillitzer, Acta. Phys. Slovaca 56, 269 (2006).
- [10] A. Budzanowski et al., Phys. Rev. C79, 012201 (2009).
- [11] M. Nanova et al., Phys. Lett. B727, 417 (2013).
- [12] Y. K. Tanaka et al., Few Body Syst. 54, 1263 (2013).
- [13] S. V. Afanasiev, Phys. Part. Nucl. Lett. 8, 1073 (2011).
- [14] H. Fujioka, Acta Phys. Pol. B41, 2261 (2010).
- [15] V. A. Baskov et al., PoS Baldin-ISHEPP-XXI 102 (2012).
- [16] B. Krusche et al., J. Phys. Conf. Ser. 349, 012003 (2012).
- [17] F. Pheron et al., Phys. Lett. B709, 21 (2012).
- [18] S. D. Bass, A. W. Thomas, Acta Phys. Pol. B45, 627 (2014).
- [19] S. Wycech, W. Krzemien, Acta Phys. Pol. B45, 745 (2014).
- [20] S. Hirenzaki, H. Nagahiro, Acta Phys. Pol. B45, 619 (2014).
- [21] B. Krusche, C. Wilkin, Prog. Part. Nucl. Phys. 80, 43 (2014).
- [22] C. Wilkin, Acta Phys. Pol. B45, 603 (2014).
- [23] H. Nagahiro et al., Phys. Rev. C87, 045201 (2013).
- [24] N. G. Kelkar et al., Rept. Prog. Phys. 76, 066301 (2013).
- [25] T. Inoue, E. Oset, Nucl. Phys. A710, 354 (2002).
- [26] D. Jido, H. Nagahiro, S. Hirenzaki, Phys. Rev. C66, 045202 (2002).
- [27] S. D. Bass, A. W. Thomas, Acta Phys. Pol. B41, 2239 (2010).
- [28] WASA-at-COSY Collaboration: H.-H. Adam et al., arXiv:nucl-ex/0411038 (2004).
- [29] M. Skurzok, W. Krzemień, P. Moskal, EPJ Web Conf. 81, 02020 (2014).
- [30] W. Krzemień, P. Moskal, M. Skurzok, Acta Phys. Pol. B 45, 689 (2014).
- [31] W. Krzemień, P. Moskal, M. Skurzok, Few Body Syst. 55, 795 (2014).
- [32] W. Krzemień , P. Moskal, J. Smyrski, M. Skurzok, EPJ Web Conf. 66, 09009 (2014).
- [33] M. Skurzok, P. Moskal, W. Krzemien, Acta Phys. Pol. B Suppl. 6, 1107 (2013).
- [34] G. Bizard et al., Phys. Rev. C22, 1632 (1980).
- [35] A. Pricking, PhD Thesis, Tuebingen University, Germany (2010).
- [36] P. Moskal and R. Czyżykiewicz, AIP Conf. Proc. 950, 118 (2007).
- [37] M. Lacombe et al., Phys. Lett. B101, 139 (1981).
- [38] The CNS Data Analysis Center, http://www.gwu.edu.
- [39] D. Albers et al., Phys. Rev. Lett. 78, 1652 (1997).
- [40] W. Krzemień, PhD Thesis, Jagiellonian University, arXiv:nucl-ex/1202.5794 (2011).
- [41] E. Chiavassa et al., Phys. Lett. B337, 192 (1994).
- [42] B. Lorentz - private communication (2014).
- [43] R. Machleidt et al., Phys. Rev. C63, 024001 (2001).