Predicting the Voltage Dependence of Interfacial Electrochemical Processes at Lithium-Intercalated Graphite Edge Planes
Abstract
The applied potential governs lithium-intercalation and electrode passivation reactions in lithium ion batteries, but are challenging to calibrate in condensed phase DFT calculations. In this work, the “anode potential” of charge-neutral lithium-intercalated graphite (LiC6) with oxidized edge planes is computed as a function of Li-content () at edge planes, using ab initio molecular dynamics (AIMD), a previously introduced Li+ transfer free energy method, and the experimental Li+/Li(s) value as reference. The voltage assignments are corroborated using explicit electron transfer from fluoroethylene carbonate radical anion markers. PF is shown to decompose electrochemically (i.e., not just thermally) at low potentials imposed by our voltage calibration technique. We demonstrate that excess electrons reside in localized states-in-the-gap in the organic carbonate liquid region, which is not semiconductor-like (band-state-like) as widely assumed in the literature.
keywords: lithium ion batteries; voltage prediction; density functional theory; ab initio molecule dynamics; computational electrochemistry
I Introduction
The applied potential governs the thermodynamics and kinetics of lithium ion battery (LIB) interfacial processes. Li+ insertion into graphite anodes to form LiC6 is completed at 0.1 V vs. Li+/Li(s), or V vs. standard hydrogen potential. Before this low voltage is reached, commonly used battery electrolytes containing ethylene carbonate (EC), cosolvents, and Li+/PF salt already decompose at 0.7-0.8 V vs. Li+/Li(s). Fortunately, the growth of self-limiting films (called “solid-electrolyte interphase,” or SEI) formed via electron-injection-induced sacrificial electrolyte degradation passivates and stabilizes the anode.review0 ; review SEI considerations are also relevant for new anode materials like silicon. To intepret measurements and to help devise better artificial SEI/passivation layers,dillon there is a need to use electronic structure computational tools (e.g., Density Functional Theory, DFT) to predict the voltage dependence of liquid-solid interfacial processes. Such a capability will have significant impact for studying not just LIB,tateyama ; greeley but also lithium-air batteries,bryantsev water-splitting processes,selloni ; sprik12 and broad areas relevant to fuel cells, catalysis,otani08 ; casewestern ; rossmeisl13 ; gross and electrodeposition.schmickler ; zavadil In this work, we validate a recently devised potential calibration scheme,voltage apply it to interfaces between liquid EC and oxidized edge planes of LiC6, and explore the possibility of electrochemical decomposition of the counter-ion (PF) used in commercial LIB electrolytes. In the electronic supporting information (S.I.), we document the significant error that can arise if the liquid electolyte is omitted in voltage estimates at interfaces.
For non-redox active systems like non-Faradaic supercapacitors, the voltage difference between two electrodes arises from their different surface charges mediated by electric double layers in the liquid regino.borodin In contrast, on complex LIB electrode surfaces, what a certain “applied voltage” means at the atomic level has not been sufficiently conceptualized, partly due to the difficulty in probing details at such lengthscales.harris On the theory side, potential calibration has been challenging in periodic boundary conditions, condensed-phase DFT simulations that depict liquid-solid interfaces.sprik12 ; otani08 ; casewestern ; rossmeisl13 ; gross DFT calculations are performed at constant number of electrons, not constant voltage. Each DFT simulation cell is associated with one electrode/Fermi level and is incompatible with a second reference electrode. Furthermore, most DFT electrochemistry calculations are conducted at T=0 K, which precludes explicit treatment of liquid solvents, dissolved salts, and, in the majority of cases, charged interfaces. Several interesting recent advances have coupled the Poisson-Boltzmann equation or related approaches to DFT at the expense of introducing vacuum-solid or -liquid interfaces into the model.otani08 ; casewestern (The vacuum layer in effect serves as the reference electrode.) Purely condensed phase simulations with no vacuum region require other methods.
We recently estimated what will be called the “anode potential” () of inert LiC6 basal planes at finite temperature.voltage The justification is briefly and heuristically described here. Our approach seeks to mimic LIB experimental processes, where Li-deintercalation occurs via transfer of Li+ from LiC6, through the liquid-solid interface, to the liquid electrolyte, and ultimately into the Li metal counter electrode not explicitly depicted in the simulation. flows in the same direction, but through the external circuit. Experimentally, it is known that these charge transfer processes occur at the onset potential of 0.1 V vs. Li+/Li(s).
We model this half-cell reaction at the onset of LiC6 delithiation,
| (1) |
While our model does not include counter electrodes, and the excess is left on the anode in the simulation (with finite surface area correction, see below), Eq. 1 has effectively completed the circuit. This is because, at equilibrium and in the absence of load-induced voltage drop, the Fermi level () of the Li metal “counter electrode” in our thought experiment must be lowered by 0.1 V to coincide with the of LiC6. Under these conditions, the excess on Li1-δC6 can start to flow to Li(s). By reaching equilibrium (tuning the free energy change () of the Eq. 1 to zero) via varying the surface charge () on the electrode surface, we arrive at the experimentally known half-cell voltage for this reaction. This is the reference point that can be pegged to measurements. Away from this =0.1 V vs. Li+/Li(s) fixed point, anode voltages are clearly related to the free energy of monovalent Li+ transfer between LiC6 and EC liquid (), , provided that the interior Li atoms are frozen and not allowed to leak into the electrolyte (i.e., there is no redox reaction), which is the case in our simulations.voltage The - relationship associated with our frozen-Li basal plane LiC6 model electrode is reminiscent of those in non-Faradaic supercapacitors.
The ab initio molecular dynamics (AIMD, or DFT/MD) technique is used to calculate .voltage calculations deal with physical ions, not infinitesimal/theoretical test charges, and therefore circumvent formal/unmeasurable concepts like the difference between “Volta” and “Galvani” definitions of the potential.sprik12 ; pratt92 Further justification, including a thought experiment on explicitly including the interface between the liquid electrolyte and the Li metal reference electrode, and comparison between our approach and related methods found in the aqueous computational electrochemistry literature, are given in Ref. voltage, .
The present work focuses on LiC6 edge planes through which Li+ can intercalate and deintercalate. Edge planes are far more technologically relevant and complex than the proof-of-principle pristine basal plane considered previously.voltage But the same theoretical method can be used to examine the edge plane voltage. Indeed, Ref. voltage, (Fig. 2) implies that this Li+ transfer protocol can in priciple directly compare the voltage on any two electrodes. This is because a sufficiently thick liquid electrolyte region intervening between a basal and an edge plane can chemically and electrostatically screen them from each other. So the difference in equilibrium free energies of Li+ transfer from each electrodes to the electrolyte, divided by should be proportional to their voltage difference. Since LiC6 is an electronic conductor, at equilibrium flows between surfaces to make the voltage the same on basal and edge planes. On pristine edge planes, the all-important =0 point is determined not only by the electronic charge () compensated by mobile Li+ in the liquid electrolyte, but also the fraction of Li occupying the edge sites (). At a fixed, applied potential, these two quantities should adjust themselves to minimize the free energy of the system. For the illustrative purpose of this work, we have fixed =0 and only varied , and can be considered the instantaneous voltage before the edge Li+ content can change.
Our predicted edge plane voltage as varies will be corroborated using explicit electron transfer from fluoroethylene carbonate radical anion markers. Using AIMD simulations with appropriately calibrated potentials, PF is shown to exhibit concerted transfer and bond-breaking reactions at low voltages, suggesting that under such conditions electrochemical decomposition may need to be considered. This is significant because it is widely accepted that PF decomposes only thermally or due to reaction with trace water.kostecki_pf6 ; plak_pf6 Finally, the simulation cells used in this work provide information about the electronic orbital alignment at explicit electrode/electrolyte interfaces. We show that excess electrons reside in localized states-in-the-gap in the organic carbonate liquid region, not in delocalized states at the conduction band minimum. The band structure is not semiconductor-like (band-state-like) as widely assumed in the literature.goodenough
II Method
Our simplified electrode model consists of a LiC6 strip with all C=O termination.ec ; mccreery Four neighboring C=O bonds form a pocket where Li+ can reside. The Li+ surface density () is unity if all such pockets are occupied. Figure 1 depicts the periodically replicated 29.7414.9715.06 Å3 interfacial simulation cell containing a LixC192O48 anode slab and 32 EC molecules. Interior atoms in the anode, with LiC6 stochiometry, are frozen while C, O, and Li atoms at the edges are allowed to move. electrode configurations are obtained by randomly, and as uniformly as possible, removing Li atoms from the two LiC6 edge planes.
| (Li) | ||||||
|---|---|---|---|---|---|---|
| A | 0.417 | 0 | 0.211 | 43.9 | +5.450.11 | |
| B | 0.417 | 0 | 0.789 | 44.4 | -6.630.04 | -1.14 |
| C | 0.500 | 0 | 0.211 | 52.1 | +5.860.10 | |
| D | 0.500 | 0 | 0.789 | 40.8 | -6.310.10 | -0.78 |
| E | 0.583 | 0 | 0.211 | 26.1 | +6.590.11 | |
| F | 0.583 | 0 | 0.789 | 20.9 | -6.230.11 | -0.36 |
| G | 0.417 | 1 | 0.211 | 25.0 | +5.800.05 | |
| H | 0.417 | 1 | 0.789 | 25.2 | -6.610.07 | -0.94 |
AIMD trajectories and a two-point thermodynamic integration (T.I.) formula with corrections/extrapolations are used to compute (Table 1). These simulations apply the VASP codevasp with PAW pseudopotentialspaw and the DFT/PBE functional.pbe An energy cut-off of 400 eV, 10-6 eV wavefunction convergence, and -point sampling are enforced. Spot checks show that 122 -point sampling changes the integrands in by less than 0.05 eV, similar to basal plane cases.voltage A thermostat keeps the trajectories at an elevated T=450 K to improve statistics and prevent EC crystallization. Tritium masses are substituted for proton masses to permit 1 fs time steps. Compared to the previous work,voltage the predicted is shifted by V to correct the prior neglect of quantum nuclear effect inside bulk LiC6 and the inadvertent use of T=450 K when adding translational and vibrational entropies to compare with experiments performed at T=300 K.
The trajectories are initiated using Monte Carlo (MC) simulations in which anode atoms are frozen in DFT/PBE-optimized configurations. LIB salt concentration is typically 1.0 M, the static dielectric constant is large (Debye length 3 Å), and electrode surfaces should be screened from each other even in a small simulation cell. Electrical double layers should be well-equilibrated to the extent that the simple classical force fields used are accurate. More MC details are described in the S.I.
III Results
III.1 Controlling Potential at LiC6 Edge Planes
Instead of mapping the entire two-dimensional potential , we focus on . In Fig. 1a, the linearly extrapolated reaches the LiC6 experimental plateau voltage of 0.1 V vs. Li+/Li(s) at 0.69. If 0.69, would be needed to raise back to the green line and achieve the experimental potential associated with LiC6. This merely means that some of the edge Li must then be considered Li+ ions — not atoms — compensated with mobile PF further away in the electrolyte.conceit
Note that a “half-electron rule” vertical shift has been included to convert (Table 1) to (Fig. 1a). T.I. calculations involve moving a Li+ from LiC6 to the middle of the solvent region of a charge-neutral simulation cell, leaving an behind. Along the T.I. path, an average of half an , or =/(, exists on the two electrode surfaces, where is the lateral surface area. We assume this excess charge is uniformly distributed on the conducting electrode surfaces, in accordance with classical electrostatic predictions; see the S.I. of Ref. voltage, for analysis of instantaneous charge distributions. The effect of this average is estimated by finite difference and subtracted from Fig. 1a, as follows. We inject one mobile Li+, compensating an excess on the electrode, and recompute (Table 1, trajectories G-H). The simulation cells remain charge-neutral. is found to be V (= C/(cm) after adding the one . This is smaller in magnitude than that in basal plane simulation cells.voltage To undo this surface charging effect, a V correction is thus applied. The shift vanishes at large , and represents an extrapolation to infinite system size. We stress that experimentalists can impose a potential without knowing details about the surfaces, but DFT calculations work differently; and need to be adjusted to arrive at the desired voltage.
In the absence of the liquid electrolyte, the potential at zero surface charge is directly related to the work function of the electrode in vacuum. In the S.I., we report work functions and show that the potential in vacuum, predicted as a function of , is significantly modified by the inclusion of the liquid electrolyte in the main text. This observation dovetails with predictions that work functions of metals can vary by 1 V when their surfaces are covered with a monolayer of watergross or organic molecules.brocks
(a) 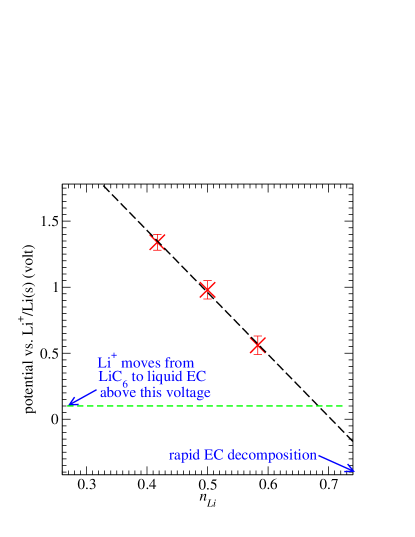
(b) 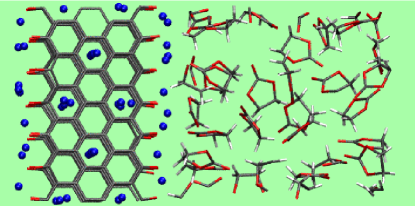
Although linear extrapolation is not expected to hold over the entire range, appears to extrapolate to a value substantially below 0 V vs. Li+/Li(s) at =1. Negative potentials relative to Li+/Li(s) are below the operating conditions of LIB anodes. This strongly suggests that =0 and =1 yield an overpotential for electrolyte decomposition. In the literature, C=O edge AIMD simulations have been reported at =1 and =0, and EC molecules are found to decompose in picosecond via two different 2- mechanisms, releasing CO and C2H4 gases, respectively.ec What are the potential dependences of these two competing processes? Recently, it has been predicted that the 2- CO-releasing route has a far lower reaction barrier than C2H4 generation in bulk liquid electrolyte regions.cpl It is therefore unlikely that C2H4 should be a dominant 2- product unless there is an overpotential. Consistent with this deduction, Fig. 1 indeed suggests the Ref. ec, system, where , is at V. If this were not the case, mostly CO products are expected. Note that two-electron reduction can yield C2H4 gas if are added sequentially, not simultaneously, separated by milliseconds.cpl This timescale is far larger than our AIMD trajectory durations.
III.2 Validating Predicted Potential: Electron Transfer
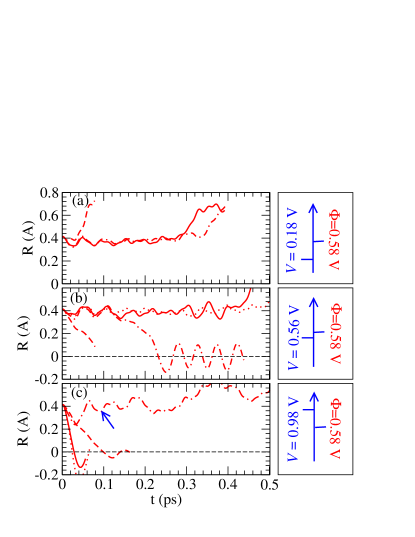
The predicted potential should not depend on whether Li+ or moves across the interface. Next we demonstrate that , calibrated using Li+ transfer above, is also consistent with transfer. In the middle of the liquid region is placed a fluoroethylene carbonate (FEC-) radical anion (Fig. 2), which is an effective electrolyte additive molecule for improving SEI on anode surfaces.fec In charge-neutral FEC (Fig. 2c), the carbonyl carbon (CC) is coplanar with the three O atoms. In contrast, FEC- is bent (Fig. 2d), with CC now hybridized. This leads to a large “reorganization energy” in the Marcus theory sense,marcus discussed below. We define the CC out-of-plane displacement as the scalar product between (i) the normalized vector product connecting the three O-atoms, and (ii) , where “Oave” is the mean position of the three oxygen atoms. =0.0 Å and 0.4 Å in the optimized FEC and FEC- geometries. Monitoring grants easy access to FEC charge states. To initiate AIMD simulations, we first conduct MC using classical force fields (see the S.I.), then run AIMD for 1.0 ps while freezing all FEC- atoms, and finally remove FEC constraints at “=0” of AIMD trajectories. The time evolution of are shown in Fig. 2.
(d) 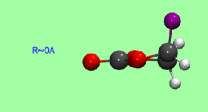 (e)
(e) 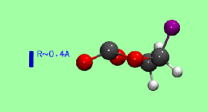
The reduction potential of FEC in bulk liquid regions is predicted to be =0.58 eV when it is not coordinated to Li+ (S.I.). If , the excess should stay on FEC-, ultimately leading to a second reduction of FEC- and rapid decomposition.fec ; note3 In the opposite case, the excess should be transferred to the electrode. The S.I. shows that this expectation is always satisfied with different initial configurations on less electrochemically active basal plane surfaces. At edge planes, this test is successful, but less than 100 % of the time. When 0.18 V (=0.667), lower than =0.58 V, FEC- persists in all trials until it absorbs a second and decomposes (Fig. 2a). This dovetails with our expectation. When =0.56 V, very close to , FEC- is stable for hundreds of femtoseconds until it decomposes in two out of four trials; in the remaining two cases FEC- loses its electron (Fig. 2b). Given our statistical uncertainties, this 50/50 split in the outcome is reasonable. When =0.98 V, FEC- should give up its excess . This is observed 3 out of 4 times (Fig. 2c).
On the whole, Fig. 2 demonstrates that calibrated using Li+ transfer also correctly governs transfer. The one glaring “error” at =0.98 V is apparently due to overly rapid C-O bond breaking in FEC- predicted using the PBE functional. This occurs within 100 fs (arrow in Fig. 2c; the predicted MP2 barriers for breaking this bond in EC- and FEC- are consistent with slower reaction rates.cpl ; fec ). Afterwards, the FEC- ring cannot be reformed in AIMD timescale even if the anode potential favors it. It is also worth pointing out that DFT/PBE allows unphysical splitting of an excess between the electrode and the redox center, artificially accelerating transfer rate,wtyang and may make Fig. 2 unduly sensitive to initial configurations. Instantaneous fluctuations in the potential experienced by redox centers are physical and real, but transfer occurs over a finite timescale that partially averages out the fluctuations. Despite this, the overall trend of and correspondence is correctly predicted: as decreases, FEC- retains its excess more readily.
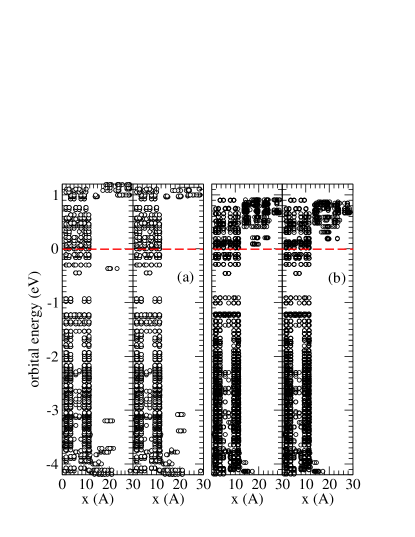
III.3 Excess Electrons Form Localized States in the Gap
Figure 3 depicts spatially-demarcated DFT Kohn Sham spin-orbital levels at =0 ps in two trajectories taken from Fig. 2b & c. In panel (a) (=0.56 V), the highest occupied molecular orbital (HOMO) is localized on FEC- — reminiscent of a polaron in solid state physics — just below the Fermi level (). FEC- is found to decompose from this configuration. In panel (b), =0.98 V, higher than =0.58 V; the localized orbital resides above , and FEC- loses its excess rapidly in this trajectory. Fig. 3 illustrates that, for organic carbonate-based liquid electrolytes, the thermodynamic onset of electrolyte electrochemical reduction and SEI formation occurs when coincides with the organic carbonate localized orbital found in the gap between liquid HOMO and liquid LUMO (lowest unoccupied molecular obrital or liquid conduction band minimum).note4 SEI formation does not begin, thermodynamically speaking, when the electrolyte LUMO coincides with the anode Fermi level, as has been widely assumed in the literature.goodenough The LUMO lies above the organic carbonate localized orbital and exhibits substantial statistical fluctuations; however it may influence transfer kinetics if electron transfers from the anode, through a substantial liquid layer, to FEC in the bulk liquid electrolyte region, instead of towards FEC that diffuses near the anode surface.
The above discussion adopts the solid state physics language often used in the battery community. It is important and of great interest to reconcile our study with molecular electrochemistry terminologysaveant less often featured in battery studies. According to Marcus theory,marcus injection into FEC is accompanied with reorganization (free) energies (). For FEC-, contains a large intramolecular component, and is not solely due to “outer shell” solvation effects. The “polaronic shift” of the HOMO of FEC-, from above the liquid conduction band edge if FEC- were flat, to within the liquid gap due to FEC- geometry change and dielectric solvation, is a non-trivial manifestation of this . Quantitatively, the vertical electron affinity should be at a value above the molecular reduction potential .adriaanse Unfortuately, it is difficult to compute in simulation cells with electrodes which are electron conductors. For example, the liquid electrolyte LUMO at frozen liquid geometry tend to reside above the Fermi level. As a result, injecting an to the system to calculate the vertical electron affinity immediately populates the Fermi level of the electrode, not the the electrolyte, unless constrained DFT methods are used in the electrolyte region. In this sense, the systems considered in this work may differ from electrodes with a significant band gap, like TiO2.cheng2014 Thus all AIMD simulations in this work report adiabatic free energy changes and redox potentials, not vertical excitations that include . To estimate , we have applied a localized basis set and dielectric continuum approach similar to Ref. cpl, . We find that the total for FEC is 3.2 eV. This is somewhat larger than that of the structurally similar EC.cpl Our predicted can be compared with future optical measurements in organic solvents analogous to those in aqueous media.adriaanse Incidentally, the wide separation between the localized excess orbital in FEC- and the liquid electrolyte HOMO minimizes hybridization between the localized state and solvent orbitals, which has been shown to be important for accurate DFT treatment of anions.adriaanse ; galli
III.4 PF Electrochemical Reduction
Finally, this potential-calibration technique is used to investigate possible PF reductive decompostion on anode surfaces as varies. A recent AIMD study has predicted rapid reductive decomposition of PF into LiF and PF fragments, 4, at liquid EC/graphite edge interfaces.kent Seemingly consistent with this prediction, simple cluster-based calculations suggests that the LiPF6 “molecule” has a reduction potential of V (S.I.), far above LiC6 potentials during battery charging. However, such a PF reduction signature has not been observed in cyclic voltametry. Experimentally, the SEI formed in LiPF6-based electrolytes is known to contain LiF from PF breakdown, but it has been widely accepted that PF decomposes thermally or due to reaction with trace water over a period of hours,kostecki_pf6 ; plak_pf6 not electrochemically in seconds.
To reconcile these observations, we note that, unlike FEC reduction, transfer to PF occurs in concert with P-F bond breaking. This is reminiscent of alkyl halide reduction,saveant which is clearly voltage dependent. Previous PF modeling workkent has not specified its anode potential. In Fig. 4, we apply AIMD potential-of-mean-force () techniques to estimate the free energy barrier () of PF decomposition at two different potentials.
The trajectories include a PF pre-equilibrated at each graphite edge, charge-balanced by Li+ in the electrolyte. The 3-atom reaction coordinate is =; P, F, and Li atoms are chosen such that they are in position to react at =0 ps. Increasing is correlated with F- transfer from P to an edge Li. Umbrella sampling potentials of the form are enforced, where =4 to 10 eV and span the range between the reactant and the transition state. See the S.I. for details.
Figure 4a shows that, at =0.56 V (=0.583), is at least 0.9 eV. As soon as one P-F bond breaks completely, is transferred, other F-’s detach from the P-atom spontaneously (Fig. 4d), and these irreversible steps render a quasi-equilibrium sampling of in the barrier top region impossible. In contrast, at = V (=0.75), the barrier appears not much higher than 0.2 eV. Fig. 4 indicates that PF electrochemical reduction may occur during the initial stage of SEI formation if the anode is at sufficiently low potentials, although this process faces competition from solvent reductive decomposition.
(a) 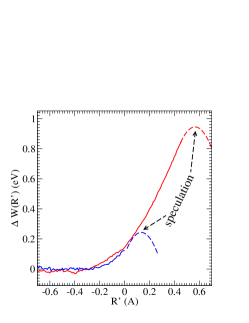 (b)
(b) 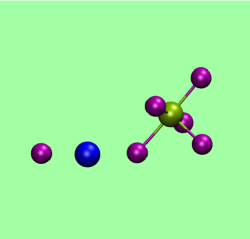
(c) 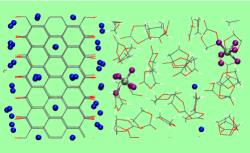 (d)
(d) 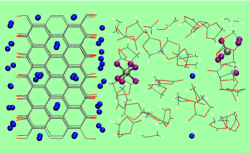
Conclusions
In conclusion, we have calibrated the anode potential () of lithium intercalated graphite edge planes at zero surface electronic charge (=0) as a function of the edge Li content () by computing the free energy of Li+ transfer between electrode and liquid electrolyte. The estimated is shown to be reasonable by correlating with observed electron transfer from reduced fluoroethylene carbonate (FEC-) radical anions inserted into the liquid region. Electrochemical reduction of PF at the pristine edge plane is shown to be viable at low potentials and to exhibit potential-dependent kinetics. This reduction pathway may need to be considered during SEI formation, in addition to thermal/impurity water-induced PF decomposition routes widely accepted in the literature. In the future, optimization of the free energy with respect to all surface parameters ( and ) will be performed, and our method will be used to study the dynamics of Li+ insertion into passivated anodes as a function of the applied potential.
Acknowledgement
We thank Kevin Zavadil and Jun Cheng for interesting discussions. This work was supported by Nanostructures for Electrical Energy Storage (NEES), an Energy Frontier Research Center funded by the U.S. Department of Energy, Office of Science, Office of Basic Energy Sciences under Award Number DESC0001160. Sandia National Laboratories is a multiprogram laboratory managed and operated by Sandia Corporation, a wholly owned subsidiary of Lockheed Martin Corporation, for the U.S. Deparment of Energy’s National Nuclear Security Administration under contract DE-AC04-94AL85000.
Electronic supporting Information available. See DOI:TBA.
References
- (1) K. Xu, Chem. Rev., 2004, 104, 4303-4417.
- (2) P. Verma, P. Maire and P. Novak, Electrochim. Acta, 2010, 55, 6332-6341.
- (3) Y.S. Jung, A.S. Cavanagh, A.C. Dillon, M.D. Groner, S.M. George, and S.-H. Lee, J. Electrochem. Soc. 2010, 157, A75.
- (4) Y. Yamada, K. Furukawa, K. Sodeyama, K. Kikuchi, M. Yaegashi, Y. Tateyama and A. Yamada, J. Am. Chem. Soc., 2014, 136, 5039-5046.
- (5) M.K.Y. Chan, C. Wolveton, and J.P. Greeley, J. Am. Chem. Soc., 2012, 134, 14362-14374.
- (6) V.S. Bryantsev and M. Blanco, J. Phys. Chem. Lett., 2011, 2, 379-383.
- (7) J. Chen, Y.F. Li, P. Sit and A. Selloni, J. Am. Chem. Soc., 2013, 135, 18774-18777.
- (8) J. Cheng and M. Sprik, Phys. Chem. Chem. Phys., 2012, 14, 11245-11267.
- (9) M. Otani, I. Hamada, O. Sugino, Y. Morikawa, Y. Okamoto and T. Ikeshoji, J. Phys. Soc. Jpn., 2008, 77, 024802.
- (10) R. Jinnouchi, K. Kodama, T. Hatanaka and Y. Morimoto, J. Electroanal. Chem., 2014, 716, 31-44.
- (11) M.E. Bjorketun, Z.H. Zeng, R. Ahmed, V. Tripkovic, K.S. Thygesen and J. Rossmeisl, Chem. Phys. Lett., 2013, 555, 145-148.
- (12) S. Schnur and A. Gross, Catalysis Today, 2011, 165, 129-137.
- (13) L.M.C. Pinto, E. Spohr, P. Quaino, E. Santos, and W. Schmickler, Angewandte Chemie Int. Ed., 2013, 52, 7883-7885.
- (14) C.J. Barile, R. Spatney, K.R. Zavadil, and A.A. Gewirth, J. Phys. Chem. C, 2014, 118, 10694-10699.
- (15) K. Leung and C.M. Tenney, J. Phys. Chem. C, 2013, 117, 24224-24235.
- (16) See, e.g., J. Vatamanu, O. Borodin and G.D. Smith, J. Phys. Chem. C 2012, 116, 1114-1121, and references therein.
- (17) J.D. Foster, S.J. Harris and J.J. Urban, J. Phys. Chem. Lett. 2014, 4, 2007-2011.
- (18) L.R. Pratt, J. Phys. Chem., 1992, 96, 25-33.
- (19) S.F. Lux, L.T. Lucas, E. Pollak, S. Passerini, M. Winter, R. Kostecki, Electrochem. Commun., 2012, 14, 47-50.
- (20) A.V. Plakhotnyk, L. Ernst and R. Schmutzler, J. Fluorine Chemistry, 2005, 126, 27-31.
- (21) In the literature, the onset of SEI formation is often assumed to occur when the LUMO aligns with in all electrolytes. See, e.g., J.B. Goodenough and K.-S. Park, J. Am. Chem. Soc., 2013, 135, 1167-1176.
- (22) K. Leung and J.L. Budzien, Phys. Chem. Chem. Phys., 2010, 12, 6583-6586.
- (23) Edge C atoms are terminated in various functional groups. See R.L. McCreery, Chem. Rev., 2008, 108, 2646-2687.
- (24) G. Kresse and J. Furthmüller, Phys. Rev. B, 1996, 54, 11169.
- (25) G. Kresse and J. Joubert, Phys. Rev. B, 1999, 59, 1758-1775.
- (26) J.P. Perdew, K. Burke and M. Ernzerhof, Phys. Rev. Lett., 1996, 77, 3865-3868.
- (27) We have used LiC6 inside the electrode throughout, instead of pure graphite at high voltage and LiC6 at low. The rationale is that the electrolyte does not see the electrode interior. See Ref. ec, for a discussion.
- (28) P.C. Rusu and G. Brocks, J. Phys. Chem. B, 2006, 110, 22628-22634.
- (29) K. Leung, Chem. Phys. Lett., 2013, 568-569, 1-8.
- (30) K. Leung, S.B. Rempe, M.E. Foster, Y. Ma, J.M. Martinez de Hoz, N. Sai and P.B. Balbuena, J. Electrochem. Soc., 2014, 161, A213-A221, and references therein.
- (31) R.A. Marcus, Rev. Mod. Phys., 1993, 65, 599.
- (32) Organic carbonates have been shown to exhibit higher second reduction potentials than first in high dielectric media, especially if they have broken bonds.cpl
- (33) P. Mori-Sánchez, A.J. Cohen and W. Yang, Phys. Rev. Lett., 2008, 100, 146401.
- (34) Although Kohn-Sham orbitals are not physical quantities in general and the above discussion is therefore qualitative, at the onset of FEC reduction, when the occupied FEC- HOMO orbital is at the Fermi level, the change of total electronic energy as a function of the partial occupancy of this orbital should indeed correspond to the orbital energy. In that sense Fig. 3 is well defined at the onset of FEC reduction.
- (35) See, e.g., J.-M. Saéant, Chem. Rev. 2008, 108, 2348-2378.
- (36) C. Adriaanse, J. Cheng, V. Chau, M. Sulpizi, J. VandeVondele and M. Sprik, J. Phys. Chem. Lett., 2012, 3, 3411-3415.
- (37) J. Cheng, J. VandeVondele and M. Sprik, J. Phys. Chem. C 2014, 118, 5437.
- (38) D. Opalka, T.A. Pham, M. Sprik, and G. Galli, J. Chem. Phys., 2014, 141, 034501.
- (39) P. Ganesh, P.R.C. Kent and D. Jiang, J. Phys. Chem. C, 2012, 116, 24476-24481.