Advanced Mean Field Theory of the Restricted Boltzmann Machine
Abstract
Learning in restricted Boltzmann machine is typically hard due to the computation of gradients of log-likelihood function. To describe the network state statistics of the restricted Boltzmann machine, we develop an advanced mean field theory based on the Bethe approximation. Our theory provides an efficient message passing based method that evaluates not only the partition function (free energy) but also its gradients without requiring statistical sampling. The results are compared with those obtained by the computationally expensive sampling based method.
pacs:
02.50.Tt, 87.19.L-, 75.10.NrRestricted Boltzmann machine (RBM) forms building blocks of a deep belief network Hinton and Salakhutdinov (2006); Bengio et al. (2013), which is able to learn complex internal representations of structured objects (such as nature image, speech, or hand writing). RBM also has wide applications in computational biology problem, for example, modeling high-dimensional neural activity data from cortical microcolumns Köster et al. (2014).
However, learning in RBM is computationally hard, since gradients of the log-likelihood function needs to be computed at every iteration step to update the model parameters. This computation is usually accomplished by Gibbs-sampling-based method or its variants Hinton (2002); Hinton et al. (2006), for which the tradeoff between accuracy and convergence speed requires careful considerations. Furthermore, an efficient way to evaluate the partition function (e.g., log-likelihood function for cross-validation analysis) remains unknown.
Here, we develop a mean field theory for the RBM based on the cavity method (Bethe approximation) Mézard and Parisi (2001), which yields an efficient and fully-distributed algorithm to evaluate the free-energy (partition function) of a RBM of interest. The remarkable efficiency is confirmed by comparing the computation results of gradients of log-likelihood function by Gibbs sampling and the proposed mean field theory.
A RBM Smolensky (1986); Freund and Haussler (1994) consists of one hidden layer and one visible layer without lateral connections between nodes in each layer. We assume the hidden layer has nodes, while the visible layer has nodes. Hidden node with external field is connected to visible node with field by a symmetric coupling . The energy function for RBM is thus defined by , where and are used to specify the state of visible node and hidden node , respectively. Due to the conditional independence of hidden nodes’ state given , the state of the hidden nodes can be marginalized. This leads to the following probability of a visible state:
| (1) |
where denotes the -th row vector of the coupling matrix . is a normalization constant (also called the partition function) of the model. As a model study, we assume the element of the matrix is independently and identically distributed with a normal distribution with mean zero and variance . We assume that the external field for both layers follows a normal distribution with mean zero and variance . We denote the ratio between the number of hidden nodes and that of visible nodes by , where and can be arbitrarily large. A schematic representation of a RBM (, ) is shown in Fig. 1.
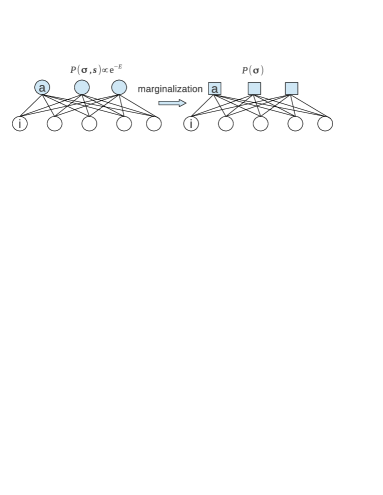
An exact computation of requires an exponential computational complexity (), which becomes impossible for a relatively large . However, advanced mean field approximation can be used to compute approximate values under certain condition, and its prediction should be compared with numerical simulations. Here, we propose the Bethe approximation Mézard and Parisi (2001) to tackle this problem. First, we transform the original model (left panel of Fig. 1) into a factor graph (right panel of Fig. 1) Kschischang et al. (2001), where each square node indicates a Boltzmann factor in Eq. (1). Then, we introduce the cavity probability that the visible node takes state in the absence of the contribution from factor node Mézard and Montanari (2009), and satisfies the following self-consistent equations:
| (2a) | ||||
| (2b) | ||||
where the symbol indicates a normalization constant, denotes the neighbors of node except factor node , denotes the neighbors of factor node except visible node , and the auxiliary quantity represents the contribution from factor node to visible node given the value of Mézard and Montanari (2009). With these definitions, the products in Eq. (2) are reasonable under the weak correlations assumption, whereas, the validity of this Bethe approximation should be checked by a stability analysis.
Note that the computation in Eq. (2b) is still intractable due to the summation over all possible except . However, because is a sum of a large number of nearly independent random variables, the central-limit theorem implies that the distribution of is well characterized by its mean and variance Huang et al. (2013), i.e., and respectively, where denotes the cavity magnetization (the average of in the absence of factor node ).
Because we consider the binary spin variable , and can be parametrized by and cavity bias , respectively. is defined as . The practical recursive equations, the so-called message passing equations, are thus derived as:
| (3a) | ||||
| (3b) | ||||
where the dependency in Eq. (3b) drops because of the symmetry of . The cavity magnetization can be understood as the message passing from the visible node to the factor node, while the cavity bias is interpreted as the message passing from the factor node to the visible node. This message passing based computation is much more accurate than naive mean field approximation Kappen and Rodriguez (1998), which assumes a fully factorized distribution for Eq. (1). In contrast, Eq. (3) captures nearest neighbors’ correlations.
Once the iteration of Eq. (3) converges, the free energy of the model can be computed from the fixed-point solution. Under the Bethe approximation, the Bethe free energy is expressed as Huang et al. (2013); Mézard and Montanari (2009):
| (4) |
where , in which . . and are given by and respectively. Each stable solution of the message passing algorithm of Eq. (3) corresponds to a local minimum of the free energy function in Eq. (4) Heskes (2004).
RBM defined in Fig. 1 is basically a densely-connected graphical model. Our mean field theory provides a practical way to estimate the free energy of single instances (typical examples of the model). More precisely, we initialize the cavity magnetization and bias on each link of the factor graph by random values, and then iterate Eq. (3) until it converges within a prescribed accuracy. Note that the overall time complexity is of the order , furthermore, the algorithm is fully-distributed, and thus amenable to large-scale applications.
In the remaining part, we demonstrate the computation of the free energy on large single instances by applying the message passing algorithm, and confirm the accuracy of the results by comparing gradients of the log-likelihood with those obtained by the Gibbs sampling method. A stability analysis of the message passing algorithm is also presented.
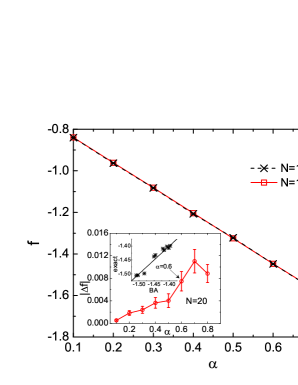
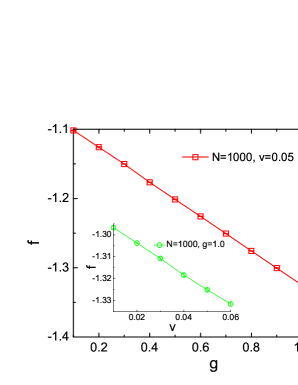
We run the message passing equations on single instances of RBMs as size , hidden-node density , and coupling strength are varied. As displayed in Fig. 2 (a), the free energy density decreases as increases. Note that the density does not change significantly at two large sizes ( and ). Furthermore, the inset of Fig. 2 (a) shows that the theoretical result even matches well with the exact enumeration result for small size . As the variance parameter of weights increases, the free energy density also decreases (Fig. 2 (b)). The same property also holds when the variance of external field increases (the inset of Fig. 2 (b)). In the explored range of (or ) and , Eq. (3) converges in a few steps to single fixed point on which the free energy is calculated. Therefore, the Bethe approximation provides an accurate estimation of free energy much faster than other sampling based procedures which are typically slow to reach an equilibrium state.
The stability of Eq. (3) can also be studied on single instances. Apart from the cavity magnetization, we introduce its variance as an extra message denoted by Kabashima (2003); Montanari and Ricci-Tersenghi (2004). The evolution of follows:
| (5) |
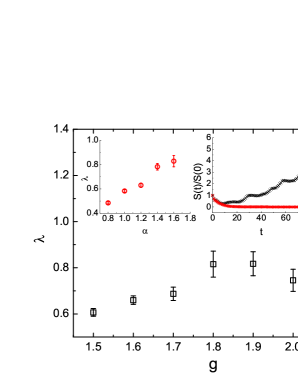
where and . The stability is measured by the total variance summed over all connected pairs , where is the iteration step. The explosion of indicates the instability of the message passing equations, which is related to the divergence of the (non-linear) spin glass susceptibility Rivoire et al. (2004), and thus the Bethe approximation becomes inconsistent. We study this effect on single instances of RBM as shown in Fig. 3. A relative strength is denoted as where denotes the step at which the iteration converges or exceeds a prefixed maximal number (). grows with and , and the fluctuation across instances becomes strong near to the critical point (). Note that increasing has an equivalent effect of increasing . In the right inset, two typical examples are shown. Near to the critical point, some instances have decaying variance strength (), while some have growing strength (). Eq. (5) thus tells us how stable (unstable) the iteration of Eq. (3) is for a particular RBM. The algorithm converges in a few iteration steps to a solution unless the recursive process is close to the instability boundary.
RBM can be used to model the real data, and the parameters are fitted to maximize the probability of observing the training data Bengio et al. (2013). This would lead to computation of the following quantities, , and , where the average, , is taken over the distribution defined in Eq. (1), which is intractable without approximations. Here, is the average of visible state , is the average of hidden state , and is the correlation between and . Although an accurate evaluation of the above quantities requires a sufficiently long Gibbs sampling (so-called the most difficult negative phase in machine learning community Bengio et al. (2013)), we can compute them by the message passing equations and then compare the results with those obtained by Gibbs sampling to check the consistency of the theory.
Following the same spirit, our theory gives the theoretical evaluation of the above quantities as
| (6a) | ||||
| (6b) | ||||
| (6c) | ||||
where is a Gaussian measure. , , and Huang and Kabashima (2014). Eq. (6) is computed based on the fixed point of the iterative algorithm (Eq. (3)).
We used alternating Gibbs sampling Hinton et al. (2006) to evaluate the equilibrium average of the gradients. More precisely, the hidden nodes are updated in parallel according to , while the visible nodes are then all updated in parallel according to where is the -th column of the weight matrix. Note that the visible nodes are conditionally independent given the hidden states and vise versa Hinton et al. (2006). These two steps of updates form one full step of the alternating Gibbs sampling. If this Markov chain is run for a sufficiently long time, the stationary (equilibrium) distribution is expected to be reached, from which the averages can be estimated. We test our theory in a system with visible nodes and run the Markov chain with steps for thermal equilibration and the other steps to collect a total number of samples to calculate the average. We measure the performance by the root-mean-square (RMS) error between the Gibbs sampling (GS) result and the Bethe approximation (BA) result, which is shown in Fig. 4. The RMS error is defined as where takes either , , or , and indicates the number of these parameters. Small RMS error indicates that the Bethe approximation is accurate.
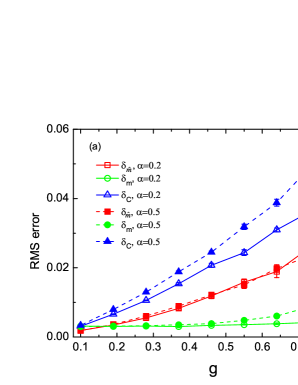
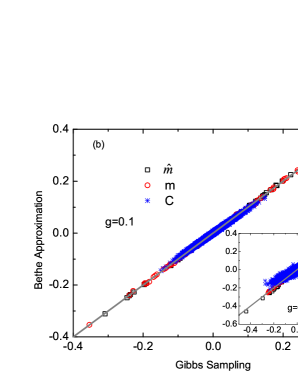
As shown in Fig. 4 (a), all evaluation errors grow with the weight strength , which is reasonable since our mean field theory will break down when the network enters a strongly correlated state, as already shown by the stability analysis. In a similar manner, the error grows with the hidden node density , because each hidden node puts a constraint to the network and all constraints compete with each other to give an equilibrium state, resulting in strong correlations with high . However, the magnitude of all errors is small, implying that one can acquire accurate estimation of gradients of log-likelihood function by passing messages on a factor graph as well. We show this point more clearly with a scatter plot in Fig. 4 (b) (Bethe approximation result versus Gibbs sampling result). This accuracy is obtained by requiring much fewer computational costs compared with the Gibbs sampling. The comparison further confirms the efficiency of the proposed mean field method across a wide range of model parameters.
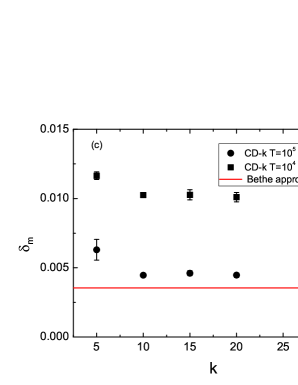
Note that the Gibbs sampling result serves as the ground truth here, since we run the Markov chain for a long time. More practically, one can estimate the statistics by -steps contrastive divergence (CD-) algorithm Hinton et al. (2006) that requires a time complexity of , where denotes the number of sample particles. However, to reach a similar accuracy as the Bethe approximation, it typically requires and under the current setup (Fig. 4 (c)). In contrast, the Bethe approximation yields a time complexity of with , where is the number of iterations and one iteration involves the update of cavity messages.
In conclusion, we propose a mean field theory for the RBM, a widely used model in machine learning community and biological data analysis. The theory captures nearest neighbors’ correlations by operating on the cavity factor graph (by removing factor nodes), leading to an approximate estimation of the free energy function (log-likelihood function) for single instances of large-size networks, for which the standard Gibbs sampling procedure becomes prohibitively slow to get a reliable result (e.g., for evaluating the log-likelihood function for cross-validation analysis). Moreover, we replace the normal Gibbs sampling with a mean field computation based on message passing algorithm, to estimate the gradients of log-likelihood function and show its efficiency by extensive numerical simulations on single instances. The nature of this fast inference lies in the fact that, the information is exchanged locally between factor nodes and visible nodes, to reach a coherent fixed point, which may provide a computation paradigm for probabilistic inference in neural networks. We expect the mean field theory inspired calculation will be useful in practical applications and bring more insights to understand the RBM and its role in deep learning Mehta and Schwab (2014).
This work was supported by RIKEN Brain Science Institute and the Brain Mapping by Integrated Neurotechnologies for Disease Studies (Brain/MINDS) by the Ministry of Education, Culture, Sports, Science and Technology of Japan (MEXT).
References
- Hinton and Salakhutdinov (2006) G. E. Hinton and R. R. Salakhutdinov, Science 313, 504 (2006).
- Bengio et al. (2013) Y. Bengio, A. Courville, and P. Vincent, Pattern Analysis and Machine Intelligence, IEEE Transactions on 35, 1798 (2013).
- Köster et al. (2014) U. Köster, J. Sohl-Dickstein, C. M. Gray, and B. A. Olshausen, PLoS Comput Biol 10, e1003684 (2014).
- Hinton (2002) G. Hinton, Neural Computation 14, 1771 (2002).
- Hinton et al. (2006) G. Hinton, S. Osindero, and Y. Teh, Neural Computation 18, 1527 (2006).
- Mézard and Parisi (2001) M. Mézard and G. Parisi, Eur. Phys. J. B 20, 217 (2001).
- Smolensky (1986) P. Smolensky (MIT Press, Cambridge, MA, USA, 1986), chap. Information Processing in Dynamical Systems: Foundations of Harmony Theory, pp. 194–281.
- Freund and Haussler (1994) Y. Freund and D. Haussler, Tech. Rep., Santa Cruz, CA, USA (1994).
- Kschischang et al. (2001) F. R. Kschischang, B. J. Frey, and H.-A. Loeliger, IEEE Trans. Inf. Theory 47, 498 (2001).
- Mézard and Montanari (2009) M. Mézard and A. Montanari, Information, Physics, and Computation (Oxford University Press, Oxford, 2009).
- Huang et al. (2013) H. Huang, K. Y. M. Wong, and Y. Kabashima, J. Phys. A: Math. Theor. 46, 375002 (2013).
- Kappen and Rodriguez (1998) H. J. Kappen and F. B. Rodriguez, Neural Comput 10, 1137 (1998).
- Heskes (2004) T. Heskes, Neural Comput 16, 2379 (2004).
- Kabashima (2003) Y. Kabashima, J. Phys. A 36, 11111 (2003).
- Montanari and Ricci-Tersenghi (2004) A. Montanari and F. Ricci-Tersenghi, Phys. Rev. B 70, 134406 (2004).
- Rivoire et al. (2004) O. Rivoire, G. Biroli, O. Martin, and M. Mézard, Eur. Phys. J. B 37, 55 (2004).
- Huang and Kabashima (2014) H. Huang and Y. Kabashima, J. Stat. Mech.: Theory Exp p. P05020 (2014).
- Mehta and Schwab (2014) P. Mehta and D. J. Schwab, ArXiv e-prints (2014), eprint 1410.3831.