]www.single-molecule.ru
Single-molecule spectromicroscopy: the door into sub-diffraction refractometry
Abstract
We suggest a novel approach for probing of local fluctuations of the refractive index in solids by means of single-molecule (SM) spectroscopy. It is based on the dependence of the effective radiative lifetime of dye centres in solids on due to the local-field effects. Detection of SM zero-phonon lines at ultra-low temperatures gives the values of SM natural spectral linewidth (which is inverse proportional to ) and makes it possible to reveal the distribution of the local values in solids. Here we demonstrate this possibility on the example of amorphous polyethylene and polycrystalline naphthalene doped with terrylene.
pacs:
81.07.-b; 78.55.-m; 77.22.Ch; 87.80.NjOne of the most important characteristics of a material that determine many of its macroscopic properties is the refractive index . It is included as a parameter in classical equations (e.g., Fresnel’s and Maxwell’s), linked to dielectric permitivity and magnetic permeability, and known to depend on temperature, pressure and wavelength Ioffe (1960). In recent years a special attention has been attracted to the refractive index in relation to metamaterials, which are assumed to have the negative Foteinopoulou et al. (2003); Kästel et al. (2007).
Since Ernst Abbe invented the refractometer in 1874 Abbe (1874) the most precise techniques for measuring have been based on the principle of the total internal reflection (TIR) on the interface of two media. There are also some other practical techniques for direct and indirect measurements of (goniometry, ellipsometry, interferometry, frustrated TIR, see, e.g. Ioffe (1960); Chamberlain et al. (1963); Müller et al. (1996); Nassif (1997); Zvyagin et al. (2003)), however, most of them require averaging over a large macroscopic volume of the sample. As a result the question of the local fluctuations of in real solids remains unanswered. Moreover, in view of the growing interest to nanotechnology and nanophotonics, it is important to know whether there is a relation between and micro- and nanoscopic structure of solids. In order to give the answer some special instruments for probing the local values on the sub-diffraction (nanometer) level must be developed.
The topical papers describe a great number of very promising “nanoinstruments” for probing of various local parameters of a sample based on single quantum light emitters embedded into the sample’s material. For example, single-molecule (SM), single quantum dot (QD) and single nanocrystals spectroscopy and imaging provides an outstanding basis for various kind of nanoinstrumentation, like nanoscale thermometry Kucsko et al. (2013), nanodetectors of acoustic strain Tian et al. (2014), single charges detectors Faez et al. (2014), instruments for probing of low-energy excitations in disordered solids Basché et al. (1997); Naumov (2013); Osad’ko (2010); Geva and Skinner (1997); Vainer et al. (2006); Tamarat et al. (2000), etc. Besides, we see a possibility to use SM spectroscopy for probing the local-field effects in dye-doped solids. It is well know that the local-field effects cause the dependence of the exited state lifetime of a light emitter on the refractive index of the hosting medium Meltzer et al. (1999); Dolgaleva and Boyd (2012); Kuznetsov et al. (2011); Barnett et al. (1992); Fleischhauer (1999); Glauber and Lewenstein (1991); Crenshaw (2008); de Vries and Lagendijk (1998). Thus, the study of photo-physical properties of a single dye center is the way to probe the local values. For example, in Pillonnet et al. (2012) such an idea was realised by analysing the fluorescence decay of QDs.
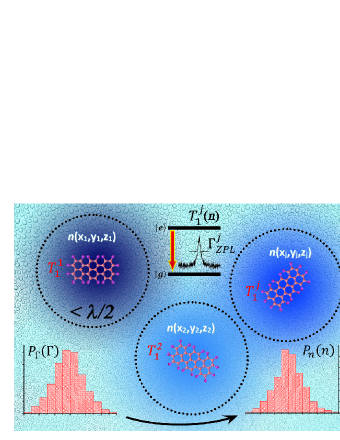
In this work we propose a method for the probing of the local (nm-scale) fluctuations of in solids by the analysis of zero-phonon spectral lines (ZPL) of single impurity dye-molecules at ultra-low temperatures (Fig. 1).
ZPL, which corresponds to a purely electronic transition in an impurity molecule Rebane (2002), is a unique source of information about dye-matrix interactions Basché et al. (1997); Naumov (2013). ZPL parameters (frequency, intensity, width, etc.) are very sensitive to the local environment of the corresponding chromophore SM. This fact makes SMs good candidates for spectral probes to obtain data on the structure and the internal dynamics of solids.
As we know from numerous studies, the temperature dependence of the homogeneous spectral width of ZPL is determined by three main contributions Basché et al. (1997); Naumov (2013); Osad’ko (2010); Geva and Skinner (1997); Vainer et al. (2006), i.e.:
| (1) |
where the natural (lifetime limited) linewidth is
| (2) |
the ZPL broadening due to the interaction of electronic transitions in impurity molecules with tunneling excitations in a matrix is
| (3) |
the ZPL broadening due to the quadratic electron-phonon interaction, which in the simplest case of interaction with a single quasilocalized low-frequency vibrational mode (LFM) is expressed as
| (4) |
In these equations is the total time of measurement, and its exact value depends on the dye-matrix system, is the constant of quadratic electron-phonon coupling, is the energy of LFM.
ZPL width is also a function of the laser excitation intensity :
| (5) |
where is the saturation intensity and is the unsaturated ZPL spectral width.
From Eqs. (1)-(5) it follows that if and the temperature is in the range of ultra-low values, then the additional broadenings and can be neglected and for each SM it is possible to measure the lifetime–limited ZPL spectral width related to . Numerous experiments have shown, that these conditions are achieved at Wcm-2 and at (depending on the type of the matrix, see e.g. Plakhotnik et al. (1995); Navarro et al. (2014)). Thus, SMs can be used as very sensitive probes of fluctuations due to the local-field effects.
If we rule out the sophisticated cases and simulations of how structured environments (usually predefined by hand) may affect the lifetime of a specific light emitter (e.g., recent Vallée et al. (2005); Kuraptsev and Sokolov (2014); Senden et al. (2015)), the number of correction factors for used in practice can be limited to five models Barnett et al. (1992); Fleischhauer (1999); Glauber and Lewenstein (1991); Crenshaw (2008); Kuznetsov et al. (2011). They all consider the situation when a guest molecule emits light to the “continuous medium” of the host matrix, weakly absorbing, isotropic and characterised by . Most generally, the effective is written as Kuznetsov et al. (2011); Dolgaleva and Boyd (2012):
| (6) |
where is the “vacuum” value of the excited state lifetime; is the refractive index (if precisely, at the wavelength of the emitted light); function reflects the local-field contributions and includes either squared or straight –dependent coefficient being the proportionality between the local-field acting on the emitter and the average Maxwellian field , i.e., .
To this date, the choice of has been among two concepts of the local-field. One is the Lorentz local-field which is classically calculated under the assumption that the field due to polarized molecules inside a small sphere centered at the site of a light emitter may be neglected. The other is a simplified variant of Onsager’s approach, Landau and Lifshitz (1984) where there is a small empty cavity around the emitter. These cases are often distinguished by the concept of interstitial and substitutional guest molecules de Vries and Lagendijk (1998). The most popular models for the lifetime correction are the virtual–cavity model Barnett et al. (1992); Fleischhauer (1999) based, respectively, on the Lorentz local-field:
| (7) |
and the real– or empty–cavity model Glauber and Lewenstein (1991) based on the Onsager model for the local-field:
| (8) |
Another approach is called the fully microscopic model Crenshaw (2008), in which
| (9) |
Similar to Eq. (7) it uses the Lorentz field but here the function is not squared. At the same time it misses the factor in the final form of (6). The remaining models imply Kuznetsov et al. (2011) which brings back the missing and provides agreement with the fully microscopic model (9) in terms that the local-field coefficients are not squared. Thus, for the likely-to-be-interstitial emitters:
| (10) |
while for the likely-to-be-substitutional emitters:
| (11) |
Speaking generally, the models in Eqs. (7) and (8) are based on the field quantization procedures in dielectrics and other macroscopic concepts for treating the problem of spontaneous emission. The models in Eqs. (9)-(11) appeared from derivation of the Maxwell-Bloch equations describing the light-matter interaction using the Heisenberg operator formalism for (9) and Bogoliubov-Born-Green-Kirkwood-Yvon equations for reduced density matrices and correlation operators of material particles and modes of the quantized radiation field for (10)-(11). In both approaches the field operators were initially written for material vacuum providing interactions between the guest and host particles.
Nevertheless, each of these models (7)-(11) has found “verification” during the analyses of the experimental data Dolgaleva and Boyd (2012); Kuznetsov et al. (2011). In all cases the so-called vacuum excitation lifetime was subjected to variation during the fitting procedure. Depending on the model used for data fitting, for each emitting system the preferable dependence was obtained. It must be noted, however, that the verifications of the models were based on the data from the excited state lifetime measurements for dopants in crystals and glasses as well as quantum dots in various solutions. It has never been performed for such impurity systems as organic molecules in solid matrices with different degree of disorder and, specifically, has never been tried on SMs. Here we make the first attempt to test this approach using several sets of unique data obtained by different research groups.
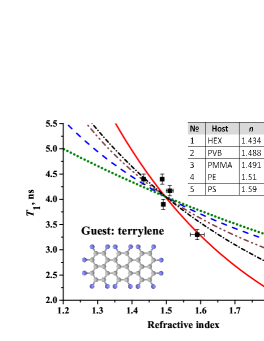
In this work we have chosen terrylene (Tr) Bohnen et al. (1990) as the object of analysis. It has been widely studied in different matrixes by the laser selective spectroscopy methods, and is one of the most used fluorophores in SMS. For this compound the values were measured for a set of solid matrices Harms et al. (1999): polyethylene (PE), polystyrene (PS), polyvinyl-butyral (PVB), polymethyl-methacrylate (PMMA), and solid n-hexadecane (Hex). In the context of the present work we also had to find the refractive indices for these matrices. The values for PE, PS, PVB were found in Cooper et al. (1982), whereas PMMA and HEX refractive indexes were measured by our team using the laboratory Abbe refractometer (URL-1, Russia) (see the table in Fig. 2). In Fig. 2 we have plotted the values for Tr molecules in all of the above mentioned matrixes against the values of in these systems. The obtained dependence was fitted using different models (Eqs. (7)-(11)). The best fit was proved to correspond to the virtual–cavity model Eq. (7) (red curve in Fig. 2), with the value of ns (i.e., MHz).
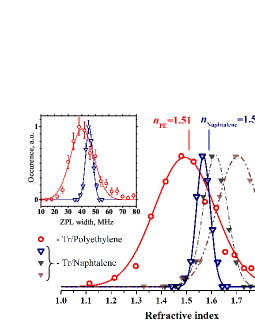
Given the value and the best dependence for the Tr molecule, we can calculate the local value of at the position of a SM from its lifetime-limited ZPL width measured in the matrix involved (Fig. 1). To do this, we have taken the unique experimental data on SM ZPL width distributions form Refs. Donley et al. (1999, 2000) obtained in the ETH, Zurich (inset in Fig. 3). The authors had performed unprecedented and complicated measurements at milliKelvin temperatures on the SMS setup equipped with the 3He/4He dilution cryostat. At these conditions, the broadening contributions and were negligible. The measurements were performed at the laser excitation intensities well below the saturation intensity. Thus, in accordance with Eq. (5) the obtained data were the distributions of lifetime-limited SM ZPL widths directly related to SM effective excited state lifetimes . These distributions can be easily converted into the distributions of using Eq. (2) and then into the distributions of refraction indices (Fig. 3) using the virtual–cavity model (Eq. (7)) with the ns.
Considering these distributions of obtained for the polycrystalline and the polymer media one should note the following: (a) there are significant fluctuations of the refractive index local values in real materials; (b) the value of measured in a bulk sample by classical methods corresponds to the peak of the obtained in the sample. Fig. 3 shows that this is valid for polyethylene and naphthalene. This implies the applicability of the proposed approach for the probing of the local fluctuations of the refractive index; (c) the local fluctuations of in the amorphous polymer are substantially greater than in the molecular polycrystal.
If one looks again at Fig. 2, another satisfactory fit is seen (black dash-dot curve), which corresponds to microscopic model (Eq. (10)). Note that it includes the Lorentz local-field factor as in the best fit with Eq. (7). The other three models result in much worse approximations. Yet, we have recalculated the distribution of lifetime-limited in naphthalene into the distributions of refraction indices using all the rest models. Fig. 3 shows that the distributions using the fits for Eqs. (10) and (8) are subjected to significant broadening and, what is most important, their peaks are notably shifted from the value of in bulk naphthalene. The other two distributions not shown are even worse. We treat this as another evidence of the correct choice of the model and the validity of the developed approach. Note that naphthalene was absent among the systems (Fig. 2), in which was directly measured.
To conclude, in our study we proposed a unique approach for the probing of the local refractive index fluctuations in solids. The method is based on the detection of SM ZPLs at conditions allowing lifetime-limited spectral line widths. The great potential of this approach is demonstrated. Particularly, simultaneous reconstruction of SM spatial coordinates with the nanometre accuracy by super-resolution fluorescence microscopy Naumov et al. (2014) opens the way to perform sub-diffraction refractometry. It was found that there are significant fluctuations of the local values in amorphous polymer and molecular polycrystalline media. These fluctuations are substantially greater in more disordered medium. The peak of the distribution corresponds to the value of , averaged over the bulk sample, which is usually obtained by traditional methods.
Acknowledgements.
This work was supported by the Russian Foundation for Basic Researches: 13-02-01303 and 14-29-07270 .References
- Ioffe (1960) B. V. Ioffe, Russ. Chem. Rev. 29, 53 (1960).
- Foteinopoulou et al. (2003) S. Foteinopoulou, E. N. Economou, and C. M. Soukoulis, Phys. Rev. Lett. 90, 107402 (2003).
- Kästel et al. (2007) J. Kästel, M. Fleischhauer, and G. Juzeliūnas, Phys. Rev. A 76, 062509 (2007).
- Abbe (1874) E. Abbe, Neue Apparate zur Bestimmung des Brechungs – und Zerstreuungsvermögens fester und fluüssiger Körper (Mauke’s Verlag, Jena, 1874).
- Chamberlain et al. (1963) J. E. Chamberlain, J. E. Gibbs, and H. A. Gebbie, Nature 198, 874 (1963).
- Müller et al. (1996) K. G. Müller, S. Sainov, S. Mittler-Neher, and W. Knoll, Appl. Opt. 35, 708 (1996).
- Nassif (1997) A. Y. Nassif, Appl. Opt. 36, 779 (1997).
- Zvyagin et al. (2003) A. Zvyagin, K. K. M. B. Silva, S. Alexandrov, T. Hillman, J. Armstrong, T. Tsuzuki, and D. Sampson, Opt. Express 11, 3503 (2003).
- Kucsko et al. (2013) G. Kucsko, P. C. Maurer, N. Y. Yao, M. Kubo, H. J. Noh, P. K. Lo, H. Park, and M. D. Lukin, Nature 500, 54 (2013).
- Tian et al. (2014) Y. Tian, P. Navarro, and M. Orrit, Phys. Rev. Lett. 113, 135505 (2014).
- Faez et al. (2014) S. Faez, S. J. van der Molen, and M. Orrit, Phys. Rev. B 90, 205405 (2014).
- Basché et al. (1997) T. Basché, W. E. Moerner, M. Orrit, and U. P. Wild, Single-molecule optical detection, imaging and spectroscopy (VCH, Weinheim; Cambridge, 1997).
- Naumov (2013) A. V. Naumov, Physics-Uspekhi 56, 605 (2013).
- Osad’ko (2010) I. Osad’ko, Selective Spectroscopy of Single Molecules (Springer, 2010).
- Geva and Skinner (1997) E. Geva and J. L. Skinner, J. Phys. Chem. B 101, 8920 (1997).
- Vainer et al. (2006) Y. G. Vainer, A. V. Naumov, M. Bauer, and L. Kador, Phys. Rev. Lett. 97, 185501 (2006).
- Tamarat et al. (2000) P. Tamarat, A. Maali, B. Lounis, and M. Orrit, J. Phys. Chem. A 104, 1 (2000).
- Meltzer et al. (1999) R. S. Meltzer, S. P. Feofilov, B. Tissue, and H. B. Yuan, Phys. Rev. B 60, R14012 (1999).
- Dolgaleva and Boyd (2012) K. Dolgaleva and R. W. Boyd, Adv. Opt. Photon. 4, 1 (2012).
- Kuznetsov et al. (2011) D. Kuznetsov, V. Roerich, and M. Gladush, J. Exp. Theor. Phys. 113, 647 (2011).
- Barnett et al. (1992) S. M. Barnett, B. Huttner, and R. Loudon, Phys. Rev. Lett. 68, 3698 (1992).
- Fleischhauer (1999) M. Fleischhauer, Phys. Rev. A 60, 2534 (1999).
- Glauber and Lewenstein (1991) R. J. Glauber and M. Lewenstein, Phys. Rev. A 43, 467 (1991).
- Crenshaw (2008) M. E. Crenshaw, Phys. Rev. A 78, 053827 (2008).
- de Vries and Lagendijk (1998) P. de Vries and A. Lagendijk, Phys. Rev. Lett. 81, 1381 (1998).
- Pillonnet et al. (2012) A. Pillonnet, P. Fleury, A. I. Chizhik, A. M. Chizhik, D. Amans, G. Ledoux, F. Kulzer, A. J. Meixner, and C. Dujardin, Opt. Express 20, 3200 (2012).
- Rebane (2002) K. K. Rebane, J. Lumin. 100, 219 (2002).
- Plakhotnik et al. (1995) T. Plakhotnik, W. Moerner, V. Palm, and U. P. Wild, Opt. Commun. 114, 83 (1995).
- Navarro et al. (2014) P. Navarro, Y. Tian, M. van Stee, and M. Orrit, ChemPhysChem 15, 3032 (2014).
- Vallée et al. (2005) R. A. L. Vallée, M. Van Der Auweraer, F. C. De Schryver, D. Beljonne, and M. Orrit, ChemPhysChem 6, 81 (2005).
- Kuraptsev and Sokolov (2014) A. S. Kuraptsev and I. M. Sokolov, Phys. Rev. A 90, 012511 (2014).
- Senden et al. (2015) T. Senden, F. T. Rabouw, and A. Meijerink, ACS Nano x, xx (2015).
- Landau and Lifshitz (1984) L. D. Landau and E. M. Lifshitz, Electrodynamics of Continuous Media (Second Edition) (Pergamon Press, 1984).
- Cooper et al. (1982) S. A. Cooper, Y. Heights, R. Shetty, and W. Plains, U.S. Patent (1982).
- Lide (2009) D. R. Lide, CRC Handbook of Chemistry and Physics (90th Edition) (CRC Press, 2009).
- Donley et al. (1999) E. A. Donley, V. Burzomato, U. P. Wild, and T. Plakhotnik, J. Lumin. 83–84, 255 (1999).
- Donley et al. (2000) E. A. Donley, S. Bonsma, V. Palm, V. Burzomato, U. P. Wild, and T. Plakhotnik, J. Lumin. 87–89, 109 (2000).
- Bohnen et al. (1990) A. Bohnen, K.-H. Koch, W. Luttke, and K. Mullen, Angew. Chem. (Int. Ed. in English) 29, 525 (1990).
- Harms et al. (1999) G. S. Harms, T. Irngartinger, D. Reiss, A. Renn, and U. P. Wild, Chem. Phys. Lett. 313, 533 (1999).
- Naumov et al. (2014) A. V. Naumov, I. Y. Eremchev, and A. A. Gorshelev, The European Physical Journal D 68, 348 (2014).