The progenitor of the FUor-type young eruptive star 2MASS J065931580405277††thanks: Based on observations made with the Herschel Space Observatory. Herschel is an ESA space observatory with science instruments provided by European-led Principal Investigator consortia and with important participation from NASA.
Abstract
Only a dozen confirmed FU Orionis-type young outbursting stars (FUors) are known today; this explains the interest in the recent FUor eruption of 2MASS J065931580405277. Its outburst and expected decline will be subject to numerous studies in the future. Almost equally important for the understanding of the eruption mechanism, however, is the physical characterization of the FUor’s precursor. Here we analyze unpublished archival data and summarize – and partly revise – all relevant photometry from optical to submillimeter wavelengths. Our analysis implies that the FUor is possibly associated with eight T Tauri star candidates and a strong Class 0 source. Adopting a distance of 450 pc for the FUor, we derive a quiescent bolometric luminosity and temperature of = 4.8 L⊙ and = 1190 K , typical for young Class II sources. The central star has a temperature of = 4000 K, a mass of 0.75 M⊙, and an age of about 6105 yr. The SED implies a circumstellar mass of 0.01 – 0.06 M⊙, and the system is surrounded by a faint infrared nebulosity. Our results provide an almost complete picture of a FUor progenitor, supporting the interpretation of future post-outburst studies.
1 Introduction
Nascent Sun-like stars are surrounded by circumstellar material, which builds up the growing protostar as matter is accreted through a circumstellar disk. The accretion rate varies in time: the protostar’s normal accretion at a low rate (10-8 M⊙ yr-1) is occasionally interspersed by brief episodes of highly enhanced accretion (Kenyon et al., 1990). FU Orionis-type variables (FUors) are the visible examples of episodic accretion. During their episodic “outbursts”, accretion rate from the circumstellar disk onto the star increases by several orders of magnitude, leading to a 5–6 mag optical brightening (Hartmann & Kenyon, 1996; Audard et al., 2014). The first FUors which defined the class (“classical FUors”) are in outburst for decades (Herbig, 1977). As a consequence, information on their progenitors is almost non-existing. The most common assumption is that they are Class II, or Class I/Class II transitional objects with massive disks and (in many cases) extended envelopes. Recent results, however, demonstrate that deeply embedded Class I objects (e.g., V1647 Ori, Ábrahám et al. 2004b; OO Ser, Kóspál et al. 2007) and Class II objects with very small disk masses and no envelopes (e.g., HBC 722, Miller et al. 2011) could also show FUor-like eruptions. Another class of young eruptive stars, called EXors after the prototype EX Lup, exhibit typically smaller, shorter, repetitive outbursts (Herbig, 1977, 2008).
On November 30, 2014, Maehara et al. (2014) reported the discovery of a new outbursting star, 2MASS J065931580405277. Optical spectra of the object obtained by Maehara et al. (2014) and by Hillenbrand (2014), and infrared spectra published by Reipurth & Connelley (2015) and by Pyo et al. (2015) are very similar to those of the classical FUors. Our group has been monitoring the area around this source with a robotic telescope at Bochum observatory near Cerro Armazones since 2010. The optical light curves show that the object started a slow rising at the end of 2013, and quickly brightened by about 3 mag both in and compared to the quiescent level, reaching peak brightness at the end of October 2014 (Hackstein et al., 2014).
Thanks to the object’s proximity to the Galactic plane, its position was covered with a number of all-sky or Galactic plane surveys, providing information on the system in its quiescent phase. Thus, 2MASS J0659315840405277 offers a unique opportunity to study the progenitor of a classical FUor. Here, we collect and analyze archival optical, infrared and submillimeter observations of the new outbursting star (hereafter, “the FUor”), and discuss the structure of its circumstellar and interstellar environment. Our study will serve as a basis for future work on the object in outburst, including possible changes in the circumstellar matter induced by the eruption.
2 Optical/infrared/submillimeter data
Optical data.
The FUor is visible in the digitized Palomar Observatory Sky Survey images. However, its magnitudes in the USNO-B1.0 catalog (Monet et al., 2003) probably suffer from source confusion due to a close-by star 57 to the north (2MASS J065931680405224, hereafter, “N component”). We repeated the photometry using a small, 3′′ radius aperture. For calibration, we selected all those nearby stars within 10′ whose instrumental magnitudes differ less than 0.1 mag from that of our target. Plotting their USNO-B1.0 magnitudes as a function of the instrumental magnitude, the distribution of data points could be fitted with a linear relationship. We used this linear fit to determine the magnitude of the FUor (Table 1). Due to its faintness and proximity to the FUor, no reasonable photometry could be obtained for the N component.
Near-infrared data.
JHKS magnitudes for the FUor in quiescent phase are available in the 2MASS catalog (Cutri et al., 2003). The source was also covered in the DENIS (Epchtein, 1998) and UKIDSS (Lawrence et al., 2007) near-infrared sky surveys. For the sake of homogeneous calibration, we performed aperture photometry on the DENIS and UKIDSS images, using a 3′′ radius aperture, and adopting nearby sources from the 2MASS catalog as photometric standards in the bands. In the DENIS band, we used the magnitudes of the comparison stars from the DENIS catalog. The resulting near-infrared photometry is listed in Table 1. Additionally, we obtained photometry for a number of fainter sources visible in the UKIDSS images in the vicinity of the FUor, whose colors will be analyzed in Sec. 3.1. These values are listed in Table 2.
Mid- and far-infrared data.
The area around the FUor was observed by the Infrared Array Camera (IRAC, Fazio et al. 2004) on-board the Spitzer Space Telescope (Werner et al., 2004) at 3.6 and 4.5m. We took photometry for the FUor from the GLIMPSE360 Catalog (Churchwell et al., 2009) and obtained psf-photometry for the N component using the idl-based tool Starfinder (Diolaiti et al., 2000). The FUor was also covered by the Midcourse Space Experiment (MSX, Egan et al. 2003), resulting a 8.28m flux in the MSX6C Point Source Catalog. The Wide-field Infrared Survey Explorer (WISE, Wright et al. 2010) observed our source in all four bands on April 1–2, 2010 in the cryogenic mission, and in the two shorter wavelength bands on October 10–11, 2010, as part of the post-cryo mission. At 3.35 and 4.60m we used data from the ALLWISE Multiepoch Photometry Table and averaged the April and October data points separately. At 11.56 and 22.09m, we used the ALLWISE Source Catalog, that combines all data from the WISE mission. The FUor was also covered by the AKARI mission (Murakami et al., 2007). It is present in the AKARI/IRC All-Sky Survey Point Source Catalogue, with photometry at 9 and 18m.
Far-infrared and submillimeter data.
The area around the FUor was observed with the Herschel Space Observatory (Pilbratt et al., 2010) in the PACS/SPIRE parallel mode (Poglitsch et al., 2010; Griffin et al., 2010). We processed the PACS 70 and 160 µm data with the Herschel Interactive Processing Environment v.13 (HIPE, Ott, 2010) using the standard script optimized for mapping observations. We used the recently developed gyro correction to reduce the pointing jitter. The final 70 and 160m maps were made with the photProject task. At 70m, two point sources are detectable: one corresponding to the FUor, while the other source is located 59 to the southeast (hereafter, “SE component”). We used 3′′ radius apertures to measure the flux ratio of these two targets, then measured the total flux in a large 22′′ radius aperture, and divided it between the two targets according to their flux ratio. At 160m, the two sources are not well resolved any more, but the centroid of the image is within 12 of the 70m position of the SE component, indicating that at this wavelength, the SE source dominates the emission. At this wavelength, photometry was obtained in a 22′′ radius aperture. The fluxes, whose uncertainties include the 7% overall calibration uncertainty of the PACS photometer, are presented in Table 1. To derive photometry in the SPIRE 250, 350, and 500m bands, we used the Timeline Fitter task of HIPE (Bendo et al., 2013) to fit circular Gaussians to the baseline-subtracted timeline data. Here again, the centroid of the source corresponds to the SE component, and not to the FUor. The resulting fluxes, whose uncertainties include the 5.5% overall calibration uncertainty of the SPIRE photometer, are presented in Table 1. The AKARI/FIS All-Sky Survey Point Source Catalogue contains a source which is closer to the SE component than to the FUor. While the photometry at 65m probably suffers from confusion of these two targets, the fluxes at longer wavelengths can be safely attributed to the SE component.
3 Results and analysis
3.1 The broader environment
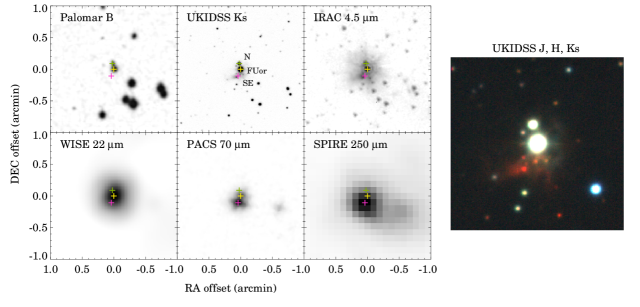
Fig. 1 displays the region around the FUor at different wavelengths revealing a complex environment. The FUor itself is well visible between the optical and 70m. The N component is located at a separation of 57, PA of 15∘, clearly discernible until 4.5m, and possibly present even in the WISE bands. The SE component is located at a distance of 59, PA of 157∘. This source is first visible at 70m, and we could not unambiguously link it to any point sources at shorter wavelengths. At 70m it is already brighter than the FUor and clearly dominates the emission at longer wavelengths.
The deep UKIDSS images reveal a faint nebulosity around the FUor, especially apparent to the south but visible to the west as well (Fig. 1, right). Its characteristic size is 15′′. This extended emission is also discernible in the IRAC images. The nebulosity, especially its southern part, is much redder than the FUor itself. If the origin of the nebulosity is light from the FUor scattered by the circumstellar matter, then the nebulosity should be bluer than the light source, unless it is reddened by some dust along the line-of-sight. We speculate that the extinction needed for this may be provided by the massive envelope of the SE component.
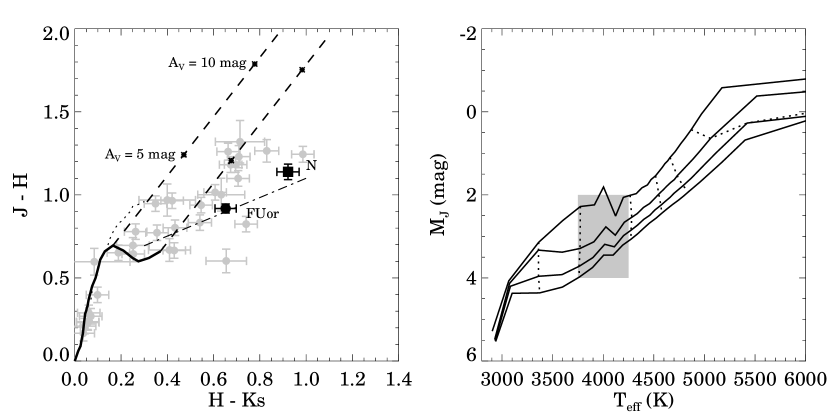
In order to find out whether the FUor is an isolated young star or there are other pre-main sequence objects in its vicinity, we obtained photometry on the UKIDSS images for several point sources within 1′ of the FUor. By plotting the objects on a vs. color-color diagram (Fig. 2, left), we found that most of them are on the main sequence, or they are reddened main sequence stars with extinction up to mag. In addition to the FUor, we found eight stars around the T Tauri locus (Meyer et al., 1997), one being the N component, while the other seven are marked in Table 2. This indicates that they are young stellar object candidates, thus the FUor is probably not isolated.
3.2 Variability in quiescence
In Table 1 we collected all available pre-outburst photometry for the FUor. In the 0.4–5m range, multi-epoch data is available, making it possible to search for variability in the quiescent phase. Significant flux changes up to 0.7 mag are revealed when comparing the two different red Palomar points, and also the infrared Palomar and DENIS -band points. In the , , and bands and in the 3–5m range, the object was constant within 0.15 mag. This indicates that the object has a well-defined quiescent state, with accretion rate changes probably much smaller than what caused the recent outburst.
3.3 Colors and spectral energy distribution
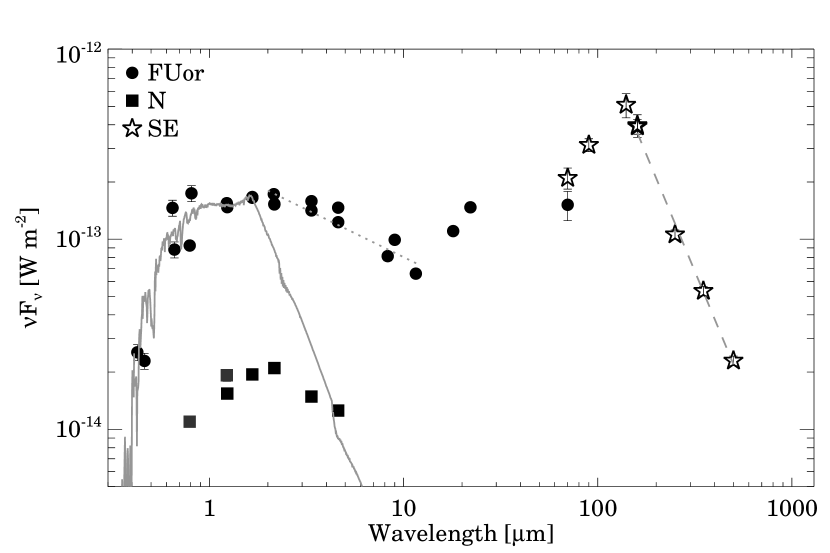
Based on the photometry in Table 1, we plotted the pre-outburst spectral energy distribution (SED) of the FUor in Figure 3 with dots, the N component with squares, and the SE component with asterisks. We only used points which can be unambiguously attributed to either of these three sources. Thus, the AKARI/FIS point at 65m, where the FUor and the SE source are probably blended together, is omitted.
The SED of the FUor indicates significant infrared emission from the circumstellar matter. On the vs. color-color diagram (Fig. 2, left), the object falls onto the T Tauri locus (Meyer et al., 1997), suggesting that it is a regular T Tauri star with negligible reddening ( 0.5 mag). Indeed, its optical–near-infrared SED (up to the band) can be reasonably well fitted using a Kurucz model of a late K-type or early M-type photosphere with effective temperatures between 3750 K and 4250 K (Fig. 3). Excess emission compared to the stellar photosphere appears first in the band. Until about 12m, the SED decreases like , typical for moderately flared disks (Kenyon & Hartmann, 1987). After about 12m, the SED starts rising again, suggesting the presence of an outer envelope.
The N component has a SED shape similar to the FUor, indicating that it is probably a T Tauri star as well, but with lower temperature and mass. Indeed, it falls onto the T Tauri locus in the near-infrared color-color diagram (see also Sec. 3.1 and Fig. 2, left). The SE component is probably a deeply embedded Class 0 object, invisible in the optical, and peaking at around 160m. Its submillimeter spectral slope is .
3.4 Distance
The FUor is situated in the Galactic plane ( = 217.5, = 0.1). The Herschel images of this area suggest that it sits on top of a long, elongated filament corresponding to the LDN 1650 molecular cloud (also known as S 287). CO observations by, e.g., Kim et al. (2004) suggest a velocity of = 26–28 km s-1 for the molecular gas, which gives a kinematic distance of 2.3 kpc. However, supposing that the FUor is a low-mass pre-main sequence star, as suggested by its optical–near-infrared SED (Sect. 3.3), its apparent brightness contradicts this relatively large distance.
The pre-main sequence evolutionary tracks of Siess et al. (2000) predict that the absolute magnitude of a star in the 3750–4250 K temperature range should be between 2 and 4 mag for ages between 5105 and 2106 yr (Fig. 2, right). The apparent = 11 mag would then correspond to a distance range of 250–630 pc for the FUor. If the object is located at 2.3 kpc, its absolute magnitude would be 0.8 mag, typical for much higher temperature young objects. The observed SED, however, peaks at near-infrared wavelengths, and could be consistent with a higher temperature photosphere only if significantly reddened. For instance, a = 6000 K photosphere with = 2.3 mag reddening would adequately fit the SED until the band. Thus, due to the well-known degeneracy between the stellar temperature and the interstellar extinction, the central star can either be an unreddened low-mass M-type young star at a distance of about 450 pc (a representative value between 250 and 630 pc), or a moderately reddened intermediate-mass F-type young star at a distance of 2.3 kpc.
Without a pre-outburst optical spectrum that could be used for stellar classification, it is very difficult to decide whether the FUor is an unreddened M-star close-by, or a reddened F-star far away. There is, however, extra information that we can use to decide. We scaled a blackbody function to the 70m flux of the FUor, extrapolated to 850m, and used this flux prediction to estimate the total mass of the circumstellar matter. We adopted a gas-to-dust mass ratio of 100. Assuming 55 K or 100 K for the dust temperature, we obtained 0.06 M⊙ or 0.01 M⊙, respectively, for a distance of 450 pc, and 1.6 M⊙ or 0.28 M⊙ for a distance of 2.3 kpc. A similar estimate can be done for the SE component using the 500m SPIRE flux. Here we used 50 K or 20 K, and obtained 0.31 M⊙ or 1.3 M⊙, respectively, for 450 pc, and 8.2 M⊙ or 34 M⊙ for 2.3 kpc. In the Galactic plane there is no guarantee that the FUor and the SE source is at the same distance. However, the fact that there is at least 2 (or possible a few more) T Tauri stars and an embedded submillimeter source all within 1′ strongly suggests that they are associated to each other. In this case, the larger distance would give an unrealistically large total mass for the SE component. Therefore, we suggest that the young stellar objects in this area, including new outbursting star, are not associated with LDN 1650, but located much closer to us, probably around = 450 pc. We will use this distance value in our subsequent discussion.
4 Discussion
In the following, we discuss the physical nature of the FUor in quiescence. The central star is a low-mass young star, with effective temperature of about = 4000 K 250 K (Sec. 3.3). The Siess models in Fig. 2 predict a stellar mass of = 0.75 0.25 . By integrating the SED in Fig. 3, we obtained a stellar luminosity of = 1.2 and a total bolometric luminosity is = 4.8 . Following Chen et al. (1995), we determined the bolometric temperature of the object, which is a distance-independent quantity. The resulting = 1190 K indicates that the object is Class II (their Fig. 6), and its age is approximately 6105 yr (their Fig. 4).
The circumstellar structure of the FUor resembles the canonical picture of classical FUors (Hartmann & Kenyon, 1996), where a young T Tauri star is surrounded by a moderately flared circumstellar disk and an envelope. In our case, the total circumstellar mass is on the order of 0.01–0.06 M⊙, falling into the range of typical T Tauri disks (Beckwith et al., 1990), and is somewhat lower than envelope masses measured by Sandell & Weintraub (2001) and by Kóspál (2011) for FUors. The SED shows a conspicuous break at 12m, which may indicate an inner hole in the envelope. Additionally, the envelope must have a cavity as well, through which we have an unobscured view of the star and the inner disk.
The comparison of the SED with other classical FUors is not straightforward, because for them, only outburst SEDs are known (Ábrahám et al., 2004a). For this reason, we compare the SED in Fig. 3 to the quiescent SED of the young eruptive star V1647 Ori dereddened by =13 mag (Fig. 3 in Ábrahám et al., 2004b). The two SEDs exhibit similar shapes, and it is remarkable that even their absolute flux levels agree within a factor of 3 in the whole 1–70m range, strengthening our distance estimate for the FUor. From an evolutionary point of view, Quanz et al. (2007) and Green et al. (2006) proposed that FUors are young stars in transition from the Class I to Class II. The transition process is associated with the gradual dispersion of the envelope due to the repetitive outbursts. In this picture, our results on the progenitor of the classical FUor candidate 2MASS J065931580405277 indicate that it is an evolved FUor, approaching the evolutionary phase of a disk-only T Tauri star.
References
- Ábrahám et al. (2004a) Ábrahám, P., Kóspál, Á., Csizmadia, S., et al. 2004a, A&A, 428, 89
- Ábrahám et al. (2004b) —. 2004b, A&A, 419, L39
- Audard et al. (2014) Audard, M., Ábrahám, P., Dunham, M. M., et al. 2014, ArXiv e-prints
- Beckwith et al. (1990) Beckwith, S. V. W., Sargent, A. I., Chini, R. S., & Guesten, R. 1990, AJ, 99, 924
- Bendo et al. (2013) Bendo, G. J., Griffin, M. J., Bock, J. J., et al. 2013, MNRAS, 433, 3062
- Cardelli et al. (1989) Cardelli, J. A., Clayton, G. C., & Mathis, J. S. 1989, ApJ, 345, 245
- Chen et al. (1995) Chen, H., Myers, P. C., Ladd, E. F., & Wood, D. O. S. 1995, ApJ, 445, 377
- Churchwell et al. (2009) Churchwell, E., Babler, B. L., Meade, M. R., et al. 2009, PASP, 121, 213
- Cutri & et al. (2014) Cutri, R. M., & et al. 2014, VizieR Online Data Catalog, 2328, 0
- Cutri et al. (2003) Cutri, R. M., Skrutskie, M. F., van Dyk, S., et al. 2003, VizieR Online Data Catalog, 2246, 0
- Diolaiti et al. (2000) Diolaiti, E., Bendinelli, O., Bonaccini, D., et al. 2000, The Messenger, 100, 23
- Egan et al. (2003) Egan, M. P., Price, S. D., Kraemer, K. E., et al. 2003, VizieR Online Data Catalog, 5114, 0
- Epchtein (1998) Epchtein, N. 1998, in IAU Symposium, Vol. 179, New Horizons from Multi-Wavelength Sky Surveys, ed. B. J. McLean, D. A. Golombek, J. J. E. Hayes, & H. E. Payne, 106
- Fazio et al. (2004) Fazio, G. G., Hora, J. L., Allen, L. E., et al. 2004, ApJS, 154, 10
- Green et al. (2006) Green, J. D., Hartmann, L., Calvet, N., et al. 2006, ApJ, 648, 1099
- Griffin et al. (2010) Griffin, M. J., Abergel, A., Abreu, A., et al. 2010, A&A, 518, L3
- Hackstein et al. (2014) Hackstein, M., Chini, R., Haas, M., Abraham, P., & Kospal, A. 2014, The Astronomer’s Telegram, 6838, 1
- Hartmann & Kenyon (1996) Hartmann, L., & Kenyon, S. J. 1996, ARA&A, 34, 207
- Herbig (1977) Herbig, G. H. 1977, ApJ, 217, 693
- Herbig (2008) —. 2008, AJ, 135, 637
- Hillenbrand (2014) Hillenbrand, L. 2014, The Astronomer’s Telegram, 6797, 1
- Ishihara et al. (2010) Ishihara, D., Onaka, T., Kataza, H., et al. 2010, A&A, 514, A1
- Kenyon & Hartmann (1987) Kenyon, S. J., & Hartmann, L. 1987, ApJ, 323, 714
- Kenyon et al. (1990) Kenyon, S. J., Hartmann, L. W., Strom, K. M., & Strom, S. E. 1990, AJ, 99, 869
- Kim et al. (2004) Kim, B. G., Kawamura, A., Yonekura, Y., & Fukui, Y. 2004, PASJ, 56, 313
- Koornneef (1983) Koornneef, J. 1983, A&A, 128, 84
- Kóspál (2011) Kóspál, Á. 2011, A&A, 535, A125
- Kóspál et al. (2007) Kóspál, Á., Ábrahám, P., Prusti, T., et al. 2007, A&A, 470, 211
- Lawrence et al. (2007) Lawrence, A., Warren, S. J., Almaini, O., et al. 2007, MNRAS, 379, 1599
- Maehara et al. (2014) Maehara, H., Kojima, T., & Fujii, M. 2014, The Astronomer’s Telegram, 6770, 1
- Meyer et al. (1997) Meyer, M. R., Calvet, N., & Hillenbrand, L. A. 1997, AJ, 114, 288
- Miller et al. (2011) Miller, A. A., Hillenbrand, L. A., Covey, K. R., et al. 2011, ApJ, 730, 80
- Monet et al. (2003) Monet, D. G., Levine, S. E., Canzian, B., et al. 2003, AJ, 125, 984
- Murakami et al. (2007) Murakami, H., Baba, H., Barthel, P., et al. 2007, PASJ, 59, 369
- Ott (2010) Ott, S. 2010, in Astronomical Society of the Pacific Conference Series, Vol. 434, Astronomical Data Analysis Software and Systems XIX, ed. Y. Mizumoto, K.-I. Morita, & M. Ohishi, 139
- Pilbratt et al. (2010) Pilbratt, G. L., Riedinger, J. R., Passvogel, T., et al. 2010, A&A, 518, L1
- Poglitsch et al. (2010) Poglitsch, A., Waelkens, C., Geis, N., et al. 2010, A&A, 518, L2
- Pyo et al. (2015) Pyo, T.-S., Oh, H., Yuk, I.-S., Kim, H., & Davis, C. J. 2015, The Astronomer’s Telegram, 6901, 1
- Quanz et al. (2007) Quanz, S. P., Henning, T., Bouwman, J., et al. 2007, ApJ, 668, 359
- Reipurth & Connelley (2015) Reipurth, B., & Connelley, M. S. 2015, The Astronomer’s Telegram, 6862, 1
- Sandell & Weintraub (2001) Sandell, G., & Weintraub, D. A. 2001, ApJS, 134, 115
- Siess et al. (2000) Siess, L., Dufour, E., & Forestini, M. 2000, A&A, 358, 593
- Werner et al. (2004) Werner, M. W., Roellig, T. L., Low, F. J., et al. 2004, ApJS, 154, 1
- Wright et al. (2010) Wright, E. L., Eisenhardt, P. R. M., Mainzer, A. K., et al. 2010, AJ, 140, 1868
- Yamamura et al. (2010) Yamamura, I., Makiuti, S., Ikeda, N., et al. 2010, VizieR Online Data Catalog, 2298, 0
| Instrument/Catalog | Filter/Wavelength | Date | Magnitude/Flux | Magnitude/Flux | Magnitude/Flux | Reference |
|---|---|---|---|---|---|---|
| (m) | FUor | N component | SE component | |||
| Palomar | B1 / 0.425 | 1953-01-17 | 15.20 0.1 mag | … | … | 1 |
| Palomar | R1 / 0.645 | 1953-01-17 | 12.47 0.1 mag | … | … | 1 |
| Palomar | B2 / 0.463 | 1983-01-17 | 15.18 0.1 mag | … | … | 1 |
| Palomar | R2 / 0.660 | 1989-03-05 | 12.97 0.1 mag | … | … | 1 |
| Palomar | I / 0.808 | 1982-01-22 | 11.82 0.1 mag | … | … | 1 |
| 2MASS | J / 1.235 | 1998-11-02 | 11.049 0.030 mag | 13.500 0.054 mag | … | 2 |
| 2MASS | H / 1.662 | 1998-11-02 | 10.122 0.036 mag | 12.445 0.068 mag | … | 2 |
| 2MASS | Ks / 2.159 | 1998-11-02 | 9.452 0.027 mag | 11.611 0.029 mag | … | 2 |
| DENIS | I / 0.791 | 1997-01-11 | 12.525 0.020 mag | 14.842 0.027 mag | … | 1 |
| DENIS | J / 1.228 | 1997-01-11 | 11.003 0.060 mag | 13.266 0.075 mag | … | 1 |
| DENIS | Ks / 2.145 | 1997-01-11 | 9.329 0.050 mag | 11.488 0.088 mag | … | 1 |
| UKIDSS | J / 1.235 | 2010-01-01 | 11.030 0.022 mag | 13.688 0.031 mag | … | 1 |
| UKIDSS | H / 1.662 | 2010-01-01 | 10.112 0.017 mag | 12.550 0.035 mag | … | 1 |
| UKIDSS | Ks / 2.159 | 2010-01-01 | 9.460 0.043 mag | 11.628 0.033 mag | … | 1 |
| UKIDSS | Ks / 2.159 | 2006-11-30 | 9.382 0.058 mag | 11.690 0.037 mag | … | 1 |
| Spitzer/IRAC | 3.6 | 2011-06-05 | 8.121 0.045 mag | 10.570 0.070 mag | … | 3 |
| Spitzer/IRAC | 4.5 | 2011-06-05 | 7.448 0.026 mag | 9.925 0.030 mag | … | 3 |
| MSX | A / 8.28 | 1996-05 – 1997-01 | 5.987 0.059 mag | … | … | 4 |
| WISE | W1 / 3.35 | 2010-04-01/02 | 8.063 0.023 mag | … | … | 5 |
| WISE | W1 / 3.35 | 2010-10-10/11 | 8.106 0.023 mag | … | … | 5 |
| WISE | W2 / 4.60 | 2010-04-01/02 | 7.186 0.022 mag | … | … | 5 |
| WISE | W2 / 4.60 | 2010-10-10/11 | 7.232 0.020 mag | … | … | 5 |
| WISE | W3 / 11.56 | 2010-04-01/02 | 5.240 0.016 mag | … | … | 6 |
| WISE | W4 / 22.09 | 2010-04-01/02 | 2.219 0.018 mag | … | … | 6 |
| AKARI/IRC | 9 | 2006-05 – 2006-11 | 5.690 0.022 mag | … | … | 7 |
| AKARI/IRC | 18 | 2006-05 – 2006-11 | 3.146 0.049 mag | … | … | 7 |
| AKARI/FIS | 65 | 2006-05 – 2006-11 | … | … | 6.723 1.826 Jy | 8 |
| AKARI/FIS | 90 | 2006-05 – 2006-11 | … | … | 9.396 0.734 Jy | 8 |
| AKARI/FIS | 140 | 2006-05 – 2006-11 | … | … | 23.751 3.448 Jy | 8 |
| AKARI/FIS | 160 | 2006-05 – 2006-11 | … | … | 21.203 2.879 Jy | 8 |
| Herschel/PACS | 70 | 2011-05-08 | 3.54 0.62 Jy | … | 4.90 0.62 Jy | 1 |
| Herschel/PACS | 160 | 2011-05-08 | … | … | 20.9 1.89 Jy | 1 |
| Herschel/SPIRE | 250 | 2011-05-08 | … | … | 8.83 0.50 Jy | 1 |
| Herschel/SPIRE | 350 | 2011-05-08 | … | … | 6.24 0.35 Jy | 1 |
| Herschel/SPIRE | 500 | 2011-05-08 | … | … | 3.83 0.22 Jy | 1 |
Note. — References: 1 – this work; 2 – 2MASS All-Sky Catalog of Point Sources (Cutri et al., 2003); 3 – GLIMPSE360 Catalog (Churchwell et al., 2009); 4 – MSX6C Infrared Point Source Catalog (Egan et al., 2003); 5 – ALLWISE Multiepoch Photometry Table (Cutri & et al., 2014); 6 – ALLWISE Source Catalog (Cutri & et al., 2014); 7 – AKARI/IRC All-Sky Survey Point Source Catalogue (Ishihara et al., 2010); 8 – AKARI/FIS All-Sky Survey Point Source Catalogue (Yamamura et al., 2010)
| RAJ2000 | DECJ2000 | mag | mag | mag | |
|---|---|---|---|---|---|
| 06:59:28.47 | 04:05:51.84 | 13.25 0.03 | 12.96 0.04 | 12.90 0.03 | |
| 06:59:28.63 | 04:05:46.55 | 12.64 0.03 | 12.41 0.04 | 12.35 0.03 | |
| T | 06:59:28.67 | 04:06:04.54 | 16.10 0.03 | 15.00 0.04 | 14.30 0.03 |
| T | 06:59:28.90 | 04:04:50.50 | 18.44 0.06 | 17.17 0.04 | 16.34 0.03 |
| 06:59:28.95 | 04:05:01.30 | 17.23 0.03 | 16.57 0.04 | 16.14 0.03 | |
| T | 06:59:29.10 | 04:05:11.11 | 17.89 0.03 | 16.65 0.04 | 15.66 0.03 |
| 06:59:29.58 | 04:05:34.60 | 16.83 0.03 | 16.19 0.04 | 15.93 0.03 | |
| 06:59:30.00 | 04:05:05.06 | 17.83 0.06 | 16.60 0.04 | 15.89 0.03 | |
| 06:59:30.11 | 04:06:14.84 | 18.28 0.05 | 17.61 0.05 | 17.20 0.08 | |
| 06:59:30.31 | 04:04:56.04 | 15.04 0.03 | 14.84 0.04 | 14.86 0.03 | |
| 06:59:30.36 | 04:04:57.08 | 14.82 0.03 | 14.43 0.04 | 14.33 0.03 | |
| 06:59:30.39 | 04:06:01.22 | 12.22 0.03 | 12.06 0.04 | 12.02 0.03 | |
| 06:59:30.49 | 04:05:41.42 | 12.87 0.03 | 12.66 0.04 | 12.61 0.03 | |
| 06:59:30.51 | 04:06:09.42 | 16.43 0.03 | 15.49 0.04 | 14.95 0.03 | |
| 06:59:30.87 | 04:05:57.09 | 13.13 0.03 | 12.86 0.04 | 12.79 0.03 | |
| 06:59:30.94 | 04:06:22.94 | 17.25 0.03 | 16.48 0.04 | 16.13 0.03 | |
| 06:59:31.01 | 04:05:06.78 | 16.39 0.03 | 15.73 0.04 | 15.55 0.03 | |
| 06:59:31.40 | 04:06:20.01 | 17.65 0.03 | 16.68 0.04 | 16.26 0.03 | |
| 06:59:31.87 | 04:05:42.41 | 16.28 0.03 | 15.09 0.04 | 14.42 0.03 | |
| T | 06:59:31.89 | 04:05:24.93 | 16.53 0.03 | 15.71 0.04 | 14.97 0.03 |
| 06:59:32.00 | 04:05:46.88 | 16.31 0.03 | 15.36 0.04 | 15.02 0.03 | |
| 06:59:32.36 | 04:06:11.75 | 13.75 0.03 | 13.51 0.04 | 13.45 0.03 | |
| T | 06:59:32.45 | 04:05:37.84 | 17.21 0.03 | 16.38 0.04 | 15.83 0.04 |
| T | 06:59:32.47 | 04:04:49.12 | 18.89 0.08 | 17.89 0.06 | 17.25 0.08 |
| T | 06:59:32.71 | 04:05:11.40 | 18.32 0.05 | 17.72 0.05 | 17.06 0.07 |
| 06:59:32.85 | 04:05:12.88 | 18.49 0.06 | 17.90 0.06 | 17.81 0.14 | |
| 06:59:32.97 | 04:04:59.10 | 19.12 0.11 | 17.81 0.07 | 17.09 0.08 | |
| 06:59:33.08 | 04:04:49.46 | 15.57 0.03 | 14.55 0.04 | 13.94 0.03 | |
| 06:59:33.26 | 04:05:06.37 | 17.71 0.03 | 16.53 0.04 | 15.84 0.03 | |
| 06:59:33.61 | 04:06:05.09 | 18.90 0.08 | 17.93 0.06 | 17.53 0.11 | |
| 06:59:33.74 | 04:05:32.00 | 18.06 0.04 | 16.80 0.04 | 16.14 0.03 | |
| 06:59:34.15 | 04:05:21.60 | 17.89 0.03 | 17.19 0.04 | 16.94 0.06 | |
| 06:59:34.75 | 04:06:12.32 | 17.47 0.03 | 16.67 0.04 | 16.24 0.04 | |
| 06:59:34.76 | 04:04:56.32 | 17.01 0.03 | 16.23 0.04 | 15.97 0.03 |
Note. — T marks T Tauri star candidates.