The GALEX/S4G UV-IR color-color diagram: Catching spiral galaxies away from the Blue Sequence
Abstract
We obtained GALEX FUV, NUV, and Spitzer/IRAC 3.6 m photometry for 2000 galaxies, available for 90% of the S4G sample. We find a very tight “GALEX Blue Sequence (GBS)” in the (FUV NUV) versus (NUV [3.6]) color-color diagram which is populated by irregular and spiral galaxies, and is mainly driven by changes in the formation timescale () and a degeneracy between and dust reddening. The tightness of the GBS provides an unprecedented way of identifying star-forming galaxies and objects that are just evolving to (or from) what we call the “GALEX Green Valley (GGV)”. At the red end of the GBS, at (NUV [3.6]) 5, we find a wider “GALEX Red Sequence (GRS)” mostly populated by E/S0 galaxies that has a perpendicular slope to that of the GBS and of the optical red sequence. We find no such dichotomy in terms of stellar mass (measured by M[3.6]), since both massive ( ) blue and red sequence galaxies are identified. The type that is proportionally more often found in the GGV are the S0-Sa’s and most of these are located in high-density environments. We discuss evolutionary models of galaxies that show a rapid transition from the blue to the red sequence on timescale of years.
Subject headings:
galaxies: evolution — galaxies: photometry1. INTRODUCTION
Color-magnitude and color-color diagrams are proven galaxy evolution diagnostic tools. Recent studies making use of GALEX and SDSS data, such as Wyder et al. (2007), have clearly shown the existence of a bimodal distribution of galaxies in (NUV r) vs r color-magnitude diagrams (CMDs), where the redder and brighter region is populated mainly by early-type galaxies in a “red sequence”, and where the bluer and fainter part of the diagram is populated mainly by late-type galaxies in a “blue sequence”.
We construct a color-magnitude and a color-color diagram using far-ultraviolet (FUV; effective wavelength 151.6 nm), near-ultraviolet (NUV; 226.7 nm) images from the Galaxy Evolution Explorer (GALEX; Martin et al., 2005), and 3.6 micron images from the images released by the Spitzer Survey of Stellar Structure in Galaxies (S4G, Sheth et al., 2010). The near-infrared (NIR) band is sensitive mainly to old stars, and the UV bands to young stars (1 Gyr). As we show below, a combination of UV and NIR bands allows us to separate star-forming from passively-evolving galaxies, while the use of the two GALEX UV bands makes this analysis very sensitive to transitional galaxies and to the transition timescale, as the FUV band is most sensitive to the presence of young (OB-type) stars. Our sample is based on the Spitzer Survey of Stellar Structure in Galaxies (S4G; Sheth et al., 2010). In this study, we gather the publicly available GALEX data (from data release GR6/7) for these S4G galaxies, and measure NUV and FUV surface and asymptotic photometry for over 2000 galaxies (90% of the S4G galaxies). We then combine this with consistent surface and asymptotic 3.6m photometry from S4G. We adopt a value of H0 = 75 km s-1 Mpc-1 for galaxies lacking a redshift-independent distance measurement (as in Sheth et al., 2010).
2. SAMPLE
The S4G is a volume-limited (d 40 Mpc), magnitude-limited (mBcorr 15.5 mag, corrected for inclination, galactic extinction, and K-correction), and size-limited ( 1 ) survey avoiding the Galactic equatorial plane( 30 ) of 2,352 galaxies, consisting of 3.6 m and 4.5 m IRAC-band images. Galaxies covered by this survey account for the majority of the significantly-sized galaxies in our extragalactic neighborhood, including galaxies of all Hubble types and masses, in various environments from field to clusters of galaxies (including 187 Virgo galaxies). The HI 21 cm-redshift selection, however, biases the sample against very massive ETGs (Early-Type Galaxies)111An extension of the S4G sample, aimed to correct for the HI selection effect, is currently in progress. (Lagos et al., 2014). We compiled a subsample of corresponding GALEX (data release GR6/7) tiles using GALEXView222http://galex.stsci.edu/GalexView/, in both FUV and NUV for over 2,100 galaxies.
FUV and NUV asymptotic magnitudes were obtained using the same method as in Gil de Paz et al. (2007), corrected for the Milky Way foreground attenuation, measured for 2053 galaxies. After excluding shallow observations with magnitude errors larger than unity, and bad photometry due to contamination from bright stars, we are left with 1931 galaxies. The S4G 3.6m photometry has been obtained using an identical procedure but adapted to the specifics of IRAC (Muñoz-Mateos et al., 2015 in prep.). All magnitudes throughout this paper are given in the AB system. Numerical morphological types, absolute B-band magnitudes and optical colors were obtained from HyperLeda (Paturel et al., 2003). The total UV coverage of our parent S4G sample is 90%, with a rather uniform fraction across all properties including absolute B-band magnitude, distance, and morphological types, and therefore represents and inherits the selection criteria of S4G.
3. RESULTS AND ANALYSIS
3.1. UV-IR Color-Color Diagram
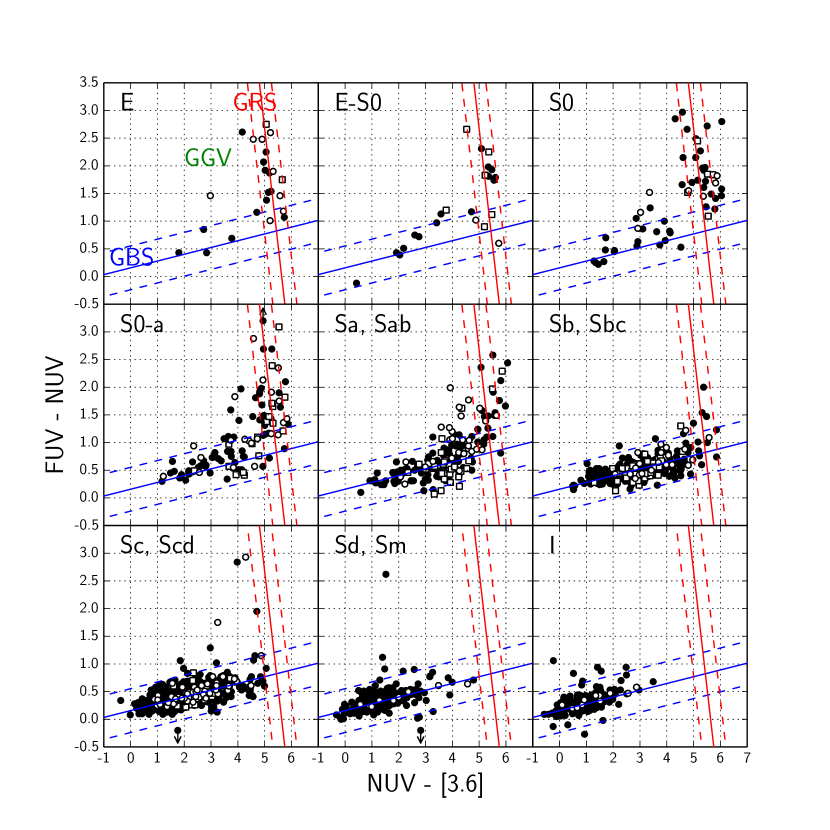
Using the asymptotic photometry described above, we construct the (FUV NUV) versus (NUV [3.6]) color-color diagram (Fig.1). We find a clear bimodal pattern: a very tight blue sequence, which we call the “GALEX Blue Sequence” (GBS hereafter), and a less tight red sequence we call the “GALEX Red sequence” (GRS hereafter). The distribution of the GRS is perpendicular to that seen in optical color-color diagrams (e.g., Strateva et al., 2001) likely due to the mass and metallicity dependence of the UV upturn (Boselli et al., 2005). The more massive and metal-rich a galaxy is, the more important the contribution from the UV upturn to the UV emission and bluer the (FUV NUV) color. Alternative use of this color are still being explored (e.g., Hernández-Pérez & Bruzual, 2014; Zaritsky, Gil de Paz, &
Bouquin, 2014, 2015).
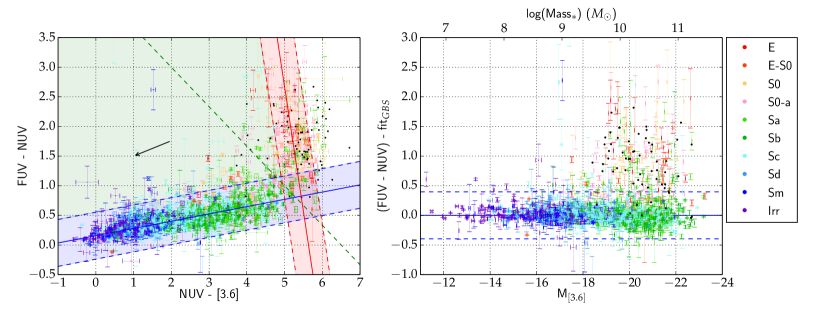
To quantify the GBS and the GRS, we split the color-color plane by choosing a line that passes through coordinates (2,3) and (5,1) (left panel of Fig.1). We fit the bluer-half with a simple error-weighted linear regression (the subsample size here is 1,787 galaxies), giving us a slope of 0.120.01 and a y-intercept at 0.160.01. The standard deviation of the sample over this range is rmsGBS = 0.20 while a Gaussian fit to the residuals yields an even smaller value of = 0.10.
We also fit the redder-half (144 galaxies) with a simple error-weighted linear regression (in the (NUV [3.6]) direction), giving us a slope of 4.211.62, and a rmsGRS = 0.45. The location of galaxies in this diagram is strongly correlated with the Hubble type (see also Fig.4). There are only two true ellipticals in the GBS, ESO548-023 and NGC 855. Some of the ellipticals found in the GBS are actually blue compact dwarfs (BCDs) morphologically misclassified as ellipticals. The latter plus the 31 later-typed ETGs (E-S0,S0) located in the GBS could be either in the tail of star formation (Bresolin, 2013) or could be rejuvenated systems (Kannappan et al., 2009; Thilker et al., 2010). Finally, early-type spiral galaxies (S0-a, Sa, Sab) are populating the GBS, the GRS and the region in between (which we name GALEX Green Valley; GGV hereafter) which is consistent with a scenario where these galaxies are transitional objects.
3.2. UV-IR Color-Magnitude Diagram
Fig.1 (Right) shows the residuals of the UV color to the GBS linear fit obtained in our UV-IR color-color diagram (Left), (FUV NUV) (FUV NUV)GBS, as a fraction of the absolute magnitude at 3.6 m, M[3.6] and stellar mass measured assuming a of 0.6 / (Meidt et al., 2014; Röck et al., 2015 in prep.). Stellar mass is not the driver for the evolution of these systems in or out the GBS. The distribution of our samples of ETGs (our data and those from Zaritsky et al., 2015) is similar, meaning that the bias against HI-poor ETGs in S4G is not driving our results.
3.3. Optical Color-Magnitude Diagram
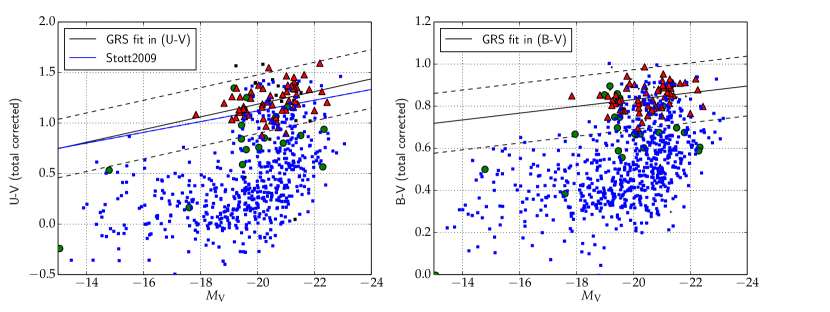
In Fig.2 we show the optical CMD, commonly used to study galaxy evolution (e.g., Faber et al., 2007). We show the position of our GBS, GRS, and GGV galaxies using blue, red, and green points, respectively (Fig.1).
Despite the low number of GGV galaxies overall, they fall either on the optical red sequence (RS) or on the (ill-defined) optical green valley (GV), with only a very few being optically blue galaxies. This result indicate that GGV galaxies are evolving off the GBS much slower in (NUV [3.6]) than in (FUV NUV), while the optical colors are reddened by more than [0.4 mag] 0.2 mag in [(UB)] (BV). Alternatively, the GGV galaxies are optically red systems that are growing a disk (towards the GBS), in which case the optical reddening is less than [0.3 mag] 0.2 mag in [(UB)] (BV).
It is interesting to note that the majority of the galaxies in the optical GV belong to the GBS, i.e., they are star-forming systems to be classified as such at UV wavelengths. The same can be said about the blue dots found in Fig.2 near the optical RS. This means that either they are in the tail end of star formation or they are regrowing a disk. In particular, a disk regrowth is unlikely, given that the GGV galaxies are found preferentially in dense environments where such a process may be more difficult than in the outskirts of a cluster or a lower-density environment (Section 4.3).
By using the classification of interacting systems within S4G given by Knapen et al. (2014) we do not find a clear difference between the fraction of close interactions in the three regions of our color-color diagram. When splitting the sample by level of interaction and morphological type, low number statistics hamper determining, for example, whether or not E/S0 in the GGV are mergers or post-starbursts.
4. Discussion
4.1. Modeling color evolution
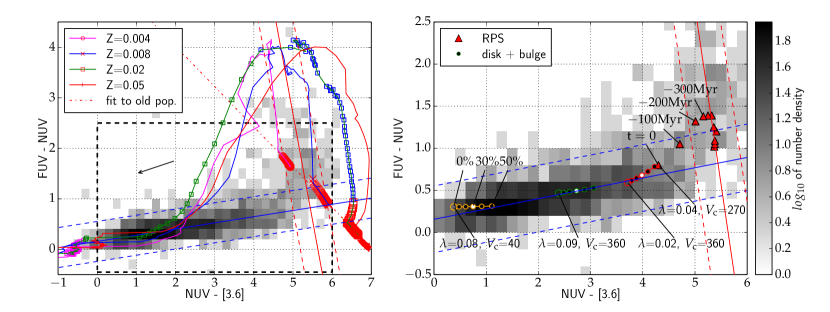
In Fig.3 (left), we show single stellar population (SSP) models (initial mass function (IMF): Chabrier) of Charlot and Bruzual (2007) for different metallicities and ages. For all cases, the (FUV NUV) color becomes redder until it reaches a peak (at about 1 Gyr in the case of Solar metallicity), and then becomes bluer again (UV-upturn) as the models age. For these SSP models, the color transition from GBS to GRS takes less than a few 108 years.
To better understand what drives the position of galaxies in the color-color diagram, we use a grid of disk galaxy models from Boissier & Prantzos (2000) with various circular velocities and spin parameters (Fig.3, right panel). These models span the entire GBS due to their variation in star formation timescale with and . Besides, the reddening arrow points along the GBS, so internal extinction contributes little to its spread, since star formation timescale and dust attenuation are nearly degenerate in these colors (Section 4.2). The tightness of the GBS is also due to the fact that the effects of an episodic SFH in the FUV-NUV color (compared to the NUV-[3.6]) are only expected at very low masses (typically rather blue NUV-[3.6] colors). Nice examples in this regard are PGC065367 or ESO245-007. To produce more realistic galaxy colors, we add a bulge to the Boissier & Prantzos (2000) disks using SSP predictions with ages between and Gyr and different formation timescale . We adopt a bulge model with (NUV [3.6]) = 5.3 mag, and (FUV NUV)color = 2.4 mag.
Three of these “disk+bulge” models are shown in Fig.3 (right) for various bulge-to-total mass ratios B/T. Each colored line represents the colors of the resulting galaxy model for B/T from 0.0 to 0.5 in steps of 0.1. Adding a BC03 SSP-based bulge to any of our disk models does not reproduce the reddening in (FUV NUV) observed in numerous early-type spirals unless we assume a very high B/T (typical observed B/T of S0 and S0-a galaxies are below 30%; Laurikainen et al., 2007). This shows that the position of transitional early-type spirals is not only due to their (red) massive bulges but also to their disks being red compared to the disks of galaxies in the GBS. This result explains the red (FUV NUV) colors of some (transitional) disk galaxies. Whether those disk galaxies could evolve into systems with properties similar to those of current-day ETGs cannot be determined from these data alone.
To analyze the transformation timescale of these disks under a more realistic scenario, we use a model that includes ram-pressure stripping of the gas (RPS hereafter) as a potential mechanism, albeit not the only (potential) one, to redden a galaxy disk. This RPS model starts from an unperturbed disk with = 270 km s-1 and = 0.04 but with additional ram-pressure to fit the properties of the Virgo galaxy NGC 4569 (Boselli et al., 2006). The points represent the epochs when the peak of RPS occurred, with t = 0 corresponding to the present. Both the disk models and the peak RPS models are shifted redward by 0.3 mag in (FUV NUV) to match the observed color-color distribution. The need for an offset has been discussed in Muñoz-Mateos et al. (2011) and is believed to be due to uncertainties in the calibration of the stellar atmospheres used in the spectral synthesis. This latter RPS disk model fits the observed distribution well, especially with a moderate bulge. The transition timescale derived from the GBS to the GRS in this case would again be of the order of a few years.
4.2. Internal dust reddening
To analyze the effects of internal dust, we show the reddening in both colors in Fig.1 (left), for = 0.5 mag, assuming the attenuation law of Calzetti et al. (1994). This law reproduces well the relation between IR excess and UV color (Gil de Paz et al., 2007). Interestingly, the reddening arrow indicates an almost complete degeneracy in these colors between reddening and a change in the star formation timescale (as illustrated by the models of Boissier & Prantzos, 2000). We find no change in the distribution of offsets from the GBS as a function of the galaxies’ axial ratio (not shown), so the (small) spread of the GBS is unlikely to be due to inclination effects.
4.3. Environmental effects
In Fig.4 we show, superposed on the number density color-color diagram, the distribution of galaxies that are in Virgo or in high-density regions (Laine et al., 2014). The relative abundance of transitional galaxies in the Virgo cluster is higher for the majority of morphological types, suggesting that an environmental effect is present. There are some indications that environment plays a role in determining whether galaxies lie in the GBS, GGV, or GRS. For example, 43% (12 of 28) of Sa galaxies classified as either GRS or GGV are in the Virgo cluster, while only 12% (16 of 137) of those classified as GBS are in Virgo. The relative preference of GGV and GRS galaxies for the Virgo environment is found for each morphological class separately (Table 1), although in some cases the results are not statistically significant. Finally, although the presence of early-type spirals in the GGV might be related to environment, this might not be simply due to RPS, there might be other, more fundamental drivers (that also depend on environment) which determine the position of galaxies in this color-color diagram and in the optical CMDs. One possibility might be the degree of uniformity of the angular momentum of accreted material, which would segregate galaxies by morphological type, mass and color in different environments (less uniform accretion having likely occurred in denser environments).
5. CONCLUDING REMARKS
We show that star-forming galaxies form a tight “Blue Sequence” in FUV-to-near-infrared color-color diagrams (the “GALEX Blue Sequence”, or simply GBS). One could even define a star-forming galaxy (SFG) as an object residing in that sequence. This is a clear advantage over the optical or optical-IR color-magnitude and color-color diagrams where star-forming galaxies are mixed with other types of sources, such as post-starbursts or, in general, galaxies in the GALEX Green Valley (GGV). Sb, Sa, and S0 galaxies are found all across the path between the GBS and the GRS, through the GGV. Their position is not only driven by their stellar mass or their bulge mass, but also by the color evolutionary state of their disk. Both SSP and realistic disk+bulge models with RPS indicate that the timescale for the color-transition could be as fast as a few 108 years. We cannot determine based solely on the integrated UV, optical and IR colors of these systems whether they are evolving off or towards the GBS.
The fact that transitioning galaxies are more common in clusters and in high-density regions in general suggests that environment plays a role and is likely to dim their disks. Environment-related mechanisms other than RPS, such as gas starvation (which can start happening in groups; Kawata & Mulchaey, 2008), galaxy harassment or processes related to the degree of uniformity of accretion are all viable. There could be galaxies in the field evolving backwards, i.e., from the GRS towards the GBS, including a large number of optical GV galaxies that we find in the GBS. A future spatially-resolved analysis may provide clues to discriminate between these mechanisms, since the radial color gradients may be different from one process to another. For example, RPS should lead to strong color gradients as the low density gas in the outskirts of galaxies would suffer the RPS effects first, while star formation in the inner parts should be unaffected.
| GBS | GGV | GRS | Others11footnotemark: 1 | ALL | |||||||||||
|---|---|---|---|---|---|---|---|---|---|---|---|---|---|---|---|
| Type22footnotemark: 2 | Virgo33footnotemark: 3 | all44footnotemark: 4 | ratio55footnotemark: 5 | Virgo | all | ratio | Virgo | all | ratio | Virgo | all | ratio | Virgo | all | ratio |
| E | 2 | 7 | 0.29 | 2 | 4 | 0.50 | 4 | 13 | 0.31 | — | — | — | 8 | 24 | 0.33 |
| E-S0 | 2 | 11 | 0.18 | — | 4 | — | — | 8 | — | — | — | — | 2 | 23 | 0.09 |
| S0 | 1 | 20 | 0.05 | 3 | 9 | 0.33 | 1 | 15 | 0.07 | 2 | 7 | 0.33 | 7 | 51 | 0.14 |
| S0-a | 11 | 61 | 0.18 | 3 | 12 | 0.25 | 6 | 24 | 0.25 | 2 | 6 | 0.22 | 22 | 103 | 0.21 |
| Sa | 16 | 137 | 0.12 | 9 | 14 | 0.64 | 3 | 14 | 0.21 | — | 10 | — | 28 | 175 | 0.16 |
| Sb | 21 | 331 | 0.06 | 1 | 5 | 0.20 | — | 4 | — | — | — | — | 22 | 340 | 0.06 |
| Sc | 51 | 656 | 0.08 | 2 | 11 | 0.18 | — | 1 | — | — | 1 | — | 53 | 669 | 0.08 |
| Sd | 4 | 162 | 0.02 | — | 3 | — | — | — | — | — | 3 | — | 4 | 168 | 0.02 |
| Sm | 5 | 189 | 0.03 | — | 2 | — | — | — | — | — | 1 | — | 5 | 192 | 0.03 |
| Irr | 11 | 179 | 0.06 | — | 6 | — | — | — | — | — | 1 | — | 11 | 186 | 0.06 |
| ALL types | 124 | 1753 | 0.07 | 20 | 70 | 0.29 | 14 | 79 | 0.18 | 4 | 29 | 0.14 | 162 | 1931 | 0.08 |
Galaxies where (FUV NUV) 2 of the GBS fit and (NUV [3.6]) 1 of the GRS fit.
22footnotemark: 2Based on Hubble t-type from RC2
33footnotemark: 3From the GOLDMine database (Gavazzi et al., 2003)
44footnotemark: 4including Virgo galaxies
55footnotemark: 5ratio=Virgo/all
References
- Boissier & Prantzos (2000) Boissier, S., & Prantzos, N. 2000, MNRAS, 312, 398
- Boselli et al. (2006) Boselli, A., Boissier, S., Cortese, L., et al. 2006, ApJ , 651, 811
- Boselli et al. (2005) Boselli, A., Cortese, L., Deharveng, J. M., et al. 2005, ApJL , 629, L29
- Bresolin (2013) Bresolin, F. 2013, ApJL , 772, L23
- Calzetti et al. (1994) Calzetti, D., Kinney, A. L., & Storchi-Bergmann, T. 1994, ApJ , 429, 582
- Cappellari et al. (2013) Cappellari, M., McDermid, R. M., Alatalo, K., et al. 2013, MNRAS, 432, 1862
- Faber et al. (2007) Faber, S. M., Willmer, C. N. A., Wolf, C., et al. 2007, ApJ , 665, 265
- Gavazzi et al. (2003) Gavazzi, G., Boselli, A., Donati, A., Franzetti, P., & Scodeggio, M. 2003, A&A , 400, 451
- Gil de Paz et al. (2007) Gil de Paz, A., Boissier, S., Madore, B. F., et al. 2007, ApJS , 173, 185
- Hernández-Pérez & Bruzual (2014) Hernández-Pérez, F., & Bruzual, G. 2014, MNRAS, 444, 2571
- Kannappan et al. (2009) Kannappan, S. J., Guie, J. M., & Baker, A. J. 2009, AJ , 138, 579
- Kawata & Mulchaey (2008) Kawata, D., & Mulchaey, J. S. 2008, ApJL , 672, L103
- Knapen et al. (2014) Knapen, J. H., Erroz-Ferrer, S., Roa, J., et al. 2014, A&A , 569, A91
- Lagos et al. (2014) Lagos, C. d. P., Davis, T. A., Lacey, C. G., et al. 2014, MNRAS, 443, 1002
- Laine et al. (2014) Laine, J., Laurikainen, E., Salo, H., et al. 2014, MNRAS, 441, 1992
- Laurikainen et al. (2007) Laurikainen, E., Salo, H., Buta, R., et al. 2007, in IAU Symposium, Vol. 235, IAU Symposium, ed. F. Combes & J. Palouš, 36–38
- Martin et al. (2005) Martin, D. C., Fanson, J., Schiminovich, D., et al. 2005, ApJL , 619, L1
- Meidt et al. (2014) Meidt, S. E., Schinnerer, E., van de Ven, G., et al. 2014, ApJ , 788, 144
- Muñoz-Mateos et al. (2011) Muñoz-Mateos, J. C., Boissier, S., Gil de Paz, A., et al. 2011, ApJ , 731, 10
- Muñoz-Mateos et al. (2015 in prep.) Muñoz-Mateos, J. C., Sheth, K., Kim, T., Laine, J., & Erroz-Ferrer, S. 2015 in prep.
- Paturel et al. (2003) Paturel, G., Petit, C., Prugniel, P., et al. 2003, A&A , 412, 45
- Röck et al. (2015 in prep.) Röck, B. R., Vazdekis, A., & Knapen, J. 2015 in prep.
- Sheth et al. (2010) Sheth, K., Regan, M., Hinz, J. L., Gil de Paz, A., & Menéndez-Delmestre, K. 2010, PASP , 122, 1397
- Stott et al. (2009) Stott, J. P., Pimbblet, K. A., Edge, A. C., Smith, G. P., & Wardlow, J. L. 2009, MNRAS, 394, 2098
- Strateva et al. (2001) Strateva, I., Ivezić, Ž., Knapp, G. R., et al. 2001, AJ , 122, 1861
- Thilker et al. (2010) Thilker, D. A., Bianchi, L., Schiminovich, D., et al. 2010, ApJL , 714, L171
- Wyder et al. (2007) Wyder, T. K., Martin, D. C., Schiminovich, D., et al. 2007, ApJS , 173, 293
- Zaritsky et al. (2014) Zaritsky, D., Gil de Paz, A., & Bouquin, A. Y. K. 2014, ApJL , 780, L1
- Zaritsky et al. (2015) —. 2015, MNRAS, 446, 2030