Measuring academic influence:
Not all citations are equal
Abstract
The importance of a research article is routinely measured by counting how many times it has been cited. However, treating all citations with equal weight ignores the wide variety of functions that citations perform. We want to automatically identify the subset of references in a bibliography that have a central academic influence on the citing paper. For this purpose, we examine the effectiveness of a variety of features for determining the academic influence of a citation.
By asking authors to identify the key references in their own work, we created a dataset in which citations were labeled according to their academic influence. Using automatic feature selection with supervised machine learning, we found a model for predicting academic influence that achieves good performance on this dataset using only four features.
The best features, among those we evaluated, were features based on the number of times a reference is mentioned in the body of a citing paper. The performance of these features inspired us to design an influence-primed -index (the hip-index). Unlike the conventional -index, it weights citations by how many times a reference is mentioned. According to our experiments, the hip-index is a better indicator of researcher performance than the conventional -index.
Introduction
One of the functions of citation analysis is to determine the impact of an author’s work on a research community. A first approximation for measuring this impact is to count the number of times an author is cited. Various other measures, such as the -index (?), the -index (?) and the -index (?), refine this basic measure using functions based on the distribution of citations (?).
Yet other measures of author impact are based on methods for scoring articles with weights and thresholds that depend on the journals in which they were published and the number of times the article was cited (?). However, all these indexes and score-based rankings treat each citation as having equal significance.
It has long been recognized that not all citations are created equal and hence they should not be counted equally. ? (?) estimated that authors read only 20% of the works they cite. This estimate was based on a detailed analysis of the frequency of replication of distinctive errors in citations, such as incorrect page numbers or volume numbers. When an error in a citation is replicated many times, it seems likely that the citers have copied the citation without actually reading the cited paper.
As an illustration, ? (?) reported that a commonly cited paper by Gerard Salton does not actually exist. An incorrect citation was accidentally created by mixing the citations for two separate papers. This incorrect citation has since been cited by more than 300 papers. If the citers had tried to read the paper before citing it, they would have discovered that the paper does not exist.
Like ? (?), we are concerned about the side-effects of counting insignificant references: “A large fraction of the references are perfunctory. This raises serious doubts about the use of citations as a quality measure, since it is then quite possible for somebody or some group to chalk up high citation counts by simply writing barely publishable papers on fashionable subjects which will then be cited as perfunctory, ‘also ran’ references.” (?, p. 91). Indeed, based on an analysis of hundreds of references, ? (?) found that a third of the references were redundant and 40% were perfunctory. In an independent study, ? (?) found that the majority (62.7%) of the references could not be attributed a specific function whereas the fraction of references that provided an essential component for the citing paper (definition, tool, starting point) was 18.9%.
The aim of our work is to determine the most effective features for identifying references that have high academic influence on the citing paper. An influential reference is one that inspired a new idea, method, experiment, or research problem that is a core contribution of the citing paper. We use the terms influence and influential to indicate the degree of academic influence of a single citation. In contrast, ? (?) used the term citation influence to refer to the academic influence of a journal.
Many attempts have been made to automatically identify which citations are most influential. Readers can often tell quickly whether a citation is shallow from the text itself, which has prompted several efforts to categorize citations by the linguistic context of their occurrence; that is, by the words near the citation in the body of the citing paper (?, ?, ?, ?).
In contrast to approaches based solely on linguistic context, our method uses machine learning to evaluate a number of citation features. We examine features based on linguistic context as well as other features, such as
-
•
the location of the citation in the text,
-
•
the semantic similarities between the titles of the cited papers and the content of the citing paper,
-
•
the frequency with which the articles are cited in the literature,
-
•
and the number of times a given reference is cited in the body of the paper.
We test the effectiveness of the features by applying machine learning to the problem of identifying the influential references. One of our most important contributions is to identify a set of four features that are particularly useful to determine influence. For example, the two best features are the number of times a reference appears and the similarity between the title of the cited paper and the core sections of the citing paper.
A secondary purpose of citation measures is to predict the future performance of authors, such as whether they will win a Nobel Prize (?, ?). The importance of researchers is reflected in the amount of influence they have on the research of their colleagues. Citation frequency is a measure of this influence, but a better measure would take into account how a researcher is cited, rather than giving all citations equal weight.
As a test of our method’s ability to determine whether a cited paper substantially influenced the citing paper, we attempt to identify which researchers in computational linguistics are Fellows of the Association for Computational Linguistics (ACL), based solely on their publication records and citations. For each ACL Fellow, we compare their conventional (unweighted) -index with an -index computed from citations weighted by our measure of academic influence. We get a better average precision measure with weighted citations.
Defining academic influence
What does it mean to say that one reference had more academic influence on a given citing paper than another reference? If our aim is to distinguish references according to their degrees of academic influence, then we must be precise about the meaning of academic influence. As researchers, we know that some papers have influenced the course of our research more than others, but how can we pin down this intuition?
A paper written by an evolutionary biologist is likely to have been influenced by Darwin’s On the Origin of Species, but we are more interested in the proximate influences on the paper. A good research paper contributes a new idea to the literature. What prior work was the proximate cause, the impetus for that new idea?
We believe that this question is best answered by the authors of the citing paper, because they are in the best position to decide which of their references should be labeled influential and which should be labeled non-influential. It could be said that we avoid the problem of precisely defining influence; instead we give a kind of operational definition: A cited paper is influential for a given citing paper if the authors of the citing paper say that it is influential.
We acknowledge that authors may be wrong about whether a paper was influential. Two types of error are possible: Authors may say a reference is influential when it is actually non-influential or authors may say a reference is non-influential when it is actually influential. Both types seem plausible to us. In the first case, the authors might feel obliged to say that a paper is influential, because the paper is very popular, very respected, or very well written. In the second case, a paper might have greatly influenced the authors at a subconscious level, but they might mistakenly say it is non-influential, or they might not want to admit that there was any influence, due to professional jealousy. Nevertheless, although the authors might be wrong, we know of no better, more reliable way of determining which references were influential. Therefore we base our experiments on author-labeled data.
? (?) also rely on author-labeled data. They collected a data set of twenty-two papers labeled by their authors. Each reference was labeled on a Likert scale and they experimented with unsupervised prediction of citation influence. Unlike us, their purpose was to model topical inheritance via citations.
Motivation
Suppose that we have a model for predicting the label (influential or non-influential) of a paper–reference pair, consisting of a given citing paper and a given citation within that citing paper. We label pairs rather than references alone, because a reference that is influential for one citing paper is not necessarily influential for another citing paper. Such a model would have many potential applications. Wherever citation counts play an important role, the model could be applied to filter or weight the citations. Some potential applications follow.
Summarizing: Given a paper with a long list of references, the model could identify the most influential references and list them. For those who are familiar with the field of the given paper, this list would rapidly convey the topic and nature of the paper. For those who are new to the field, this list would suggest further reading material. Citations have generally proven useful for summarization (?, ?, ?, ?, ?, ?).
Improved measures of an author’s impact: Indexes such as the -index (?), -index (?), and -index (?) could be made less sensitive to noise by filtering citation counts with a model of influence. Beyond reducing sensitivity to noise, a model of influence could also put more weight on original contributions. It is known that survey papers and methodology papers tend to be more highly cited than research contributions in general (?). ? (?) went as far as to recommend focusing on reviews: “Perhaps the best single thing an aspiring author can do to attract citations is to participate in a rigorous review rather than writing a conventional research article.” (?, p. 270). However, survey and methodology papers seem less likely to us to be labeled as influential by authors. Filtering citation counts by a model of influence might decrease the impact of survey and methodology papers, putting more weight on innovative research.
Improved journal impact factors: As with measures of author impact, measures of journal impact (?) could be made less sensitive to noise by filtering citation counts with a model of influence.
Improved measures of research organization impact: Citations counts are also used to evaluate research organizations. As with journal impact and author impact, performance measures that are based on citation counts may benefit from filtering by a model of influence.
Meme tracking: Historians of science are interested in tracking the spread of ideas (memes) (?, ?). Citations are a noisy way to track how ideas spread, because a reference may be cited for many reasons other than being the source of an influential idea (?). Filtering by a model of influence may result in a better analysis of the spread of an idea.
Research network analysis: Scientists belong to networks of people who collaborate with each other or influence each other’s work. Filtering citations with a model of influence may make it easier to identify these networks automatically.
Improved hyperlink analysis: In many ways, hypertext links in web pages are analogous to citation links in research papers. A good model of citation influence could suggest a model of hypertext link importance. This could improve measures of the importance of web pages, such as PageRank (?).
Improved recommender systems: Researchers often need help identifying relevant work that they should read. Filtering out less relevant citations might help paper recommender systems (?, ?).
Related work
The idea that the mere counting of citations is dubious is not new (?): The field of citation context analysis (a phrase coined by ?) has a long history dating back to the early days of citation indexing. There is a wide variety of reasons for a researcher to cite a source and many ways of categorizing them. For instance, ? (?) identified fifteen such reasons, including giving credit for related work, correcting a work, and criticizing previous work.
For articles in the field of high energy physics, ? (?) distinguished four major classes of polar opposite pairs, conceptual–operational, organic–perfunctory, evolutionary–juxtapositional, and confirmative–negational. They found that the fraction of negational references, i.e., citations indicating that the cited source is wrong, is not negligible (14%).
? (?) presented one of the first automatic citation indexing systems (CiteSeer). It could parse citations and use them to compute similarities between documents.
? (?) might have implemented the first automated classification systems for citations. They used over 200 manually selected rules to classify citations in one of 35 categories.
Machine learning methods for automatic classification can be applied to the text of a citing document. ? (?) distinguish categories of citations that can be identified via linguistic cues in the text. They are able to classify citations into one of four categories (weak, positive, contrast, neutral) with an average F-measure of 68%. For a classification in three categories (weakness, positive, neutral), they get an average F-measure of 71%. Their classifier relies on 892 manually selected cue phrases, such as whether the citation is a self-citation, the location of the citation in the text, and manually acquired verb clusters.
? (?) annotated a corpus of 43 open-access full-text biomedical articles. They built classifiers using Support Vector Machine (SVM) and Multinomial Naïve Bayes (MNB) models using the open-source Java library Weka. They report an average F-measure of 76.5%. They used unigrams (individual words) and bigrams (two consecutive words) as features. They ranked their features using mutual information. They found the SVM models were generally superior to the MNB models.
Our own methodology differs from ? (?) and ? (?) in at least one significant way: We asked the authors of the citing papers themselves to identify the influential references whereas they used independent annotations. We believe that it is difficult for an independent annotator to classify citations. This concern was raised by ? (?): “Since the intentions of the author are not normally available to the content analyst, there seems to be no way of conclusively resolving problems of classifications (…) The difficulties are more compounded when the analyst has only a superficial knowledge of the contexts in which the papers he examines were written and read.” (?, p. 120). Nevertheless, ? (?) report moderately good inter-annotator agreement.
To address concerns about the consistency of the -index, ranking and scoring have been proposed as alternative measures (?). Like the -index, these measures are based on citation counts, and they too could benefit from filtering or weighting citations with a model of influence.
There are other good reasons, beside assessing researchers, to make distinctions between different types of citations. The need also arises from the desire by publishers to provide scholarly research with semantic annotations. Thus CiTO, the Citation Typing Ontology (?, ?), provides a rich machine-readable RDF metadata ontology for the characterization of bibliographic citations.
From among the almost ninety semantic relations for citations identified in CiTO (for example, agrees with, obtains background from, supports, and uses conclusions from), it is natural to generalize at least two broad categories of citations, ones that acknowledge a fundamental intellectual legacy (such as critiques, extends, and disputes) and ones that are incidental (such as cites for information, obtains support from, and cites as related).
Several authors have proposed weighting citations based on factors such as the prestige of the citing journal (?, ?, ?, ?). Others have proposed weighting citations by the mean number of references of the citing journal (?). ? (?) proposed giving more weights to citations from more prestigious authors. He also argues that the citation of a paper published in a less prestigious venue should be considered more significant: “…if a paper is cited despite its handicap of having appeared in a low-IF [Impact Factor] journal, then this means that this paper has a high intrinsic value. Therefore a citation’s value should be inversely correlated with the IF of the journal in which the cited paper was published.” (?, p. 244).
? (?) propose to use frequency to assess the importance of a citation. That is, if a reference was cited 10 times in the citing paper it gets a weight of 10. They show that by weighting citations by the in-paper frequency, review articles lose part of their advantage over original contributions when counting citations. They state that greater credit is reverted to the discoverers. They also show that closely related references are cited more often in the body of a citing paper than less related references (on average, 3.35 times versus 1.88 times). They define closely related references as papers having at least ten references in common with the given paper.
? (?) studied hedging as a means to classify citations. ? (?) used finite-state machines for classification of citations.
Features for supervised learning
We are concerned with a binary classification problem: Given a research paper, classify its references as either influential or non-influential.
The task is to create a model that takes a pair, consisting of a given author’s paper (the citer) and a reference in the given paper (the cited paper), as input, and generate a label (influential or non-influential) as output. Our goal is to create a model that can predict the labels assigned by the authors in our gold-standard dataset. Our approach to this task is to use supervised machine learning.
For supervised machine learning, we must generate feature vectors that represent a variety of properties of each paper–reference pair. Given a training set of manually labeled paper–reference feature vectors, a learning algorithm can create a model for predicting the label of a paper–reference pair in the testing set.
We use a standard supervised machine learning algorithm in our experiments (a support vector machine). The main contribution of this paper is that we evaluate a wide range of different features for representing the paper–reference pairs. Finding good features is the key to successful prediction.
In our experiments, we consider five general classes of features:
-
1.
Count-based features
-
2.
Similarity-based features
-
3.
Context-based features
-
4.
Position-based features
-
5.
Miscellaneous features
Not all of these features are useful. However, many of these features are intuitively attractive, and we can only find out if (and the extent to which) they are useful through experiments. We describe these features in the following subsections.
Count-based features
The count-based features are based on the intuition that a reference that is frequently mentioned in the body of a citing paper is more likely to be influential than a reference that is only mentioned once. We created five different count-based features:
-
1.
Count-based features
-
1.1.
countsInPaper_whole
-
1.2.
countsInPaper_secNum
-
1.3.
countsInPaper_related
-
1.4.
countsInPaper_intro
-
1.5.
countsInPaper_core
-
1.1.
We count the occurrences of each reference in the entire citing paper (), in the introduction (), in the related work (), and in the core sections (), where core sections include all the other sections, excluding those already mentioned and excluding the acknowledgment, conclusion, and future-work sections.
We added a feature () to indicate the number of different sections in which a reference appears. This feature is based on the intuition that a reference that appears in several different sections is more significant than a reference that appears in only one section (even if it may have a high frequency within that one section).
Similarity-based features
It seems natural to suppose that the influence of a cited paper on a given citing paper (the citer) is proportional to the overlap in the semantic content of the cited paper and the citer. That is, if there is a high degree of semantic similarity between the text of the citer and the text of the cited paper, then it seems likely that the cited paper had a significant influence on the citer. Accordingly, we explored a variety of features that attempt to capture semantic similarity.
We assume that the text of the citer is given, but we do not assume that we have access to the text of the cited paper. The cited paper might not be readily available online, due to subscription charges or the age of the paper. A benefit of our approach is that all these features can be implemented efficiently: All features can often be computed from a single document. Even when the titles of references are not included by the journal, it may still be easier to locate the missing titles than the full text.
Since (by choice) we do not have access to the full text of the cited paper, we use the title of the cited paper as a surrogate for the full text. The first five similarity-based features compare the title of the cited paper to various parts of the citing paper:
-
2.
Similarity-based features
-
2.1.
sim_titleTitle
-
2.2.
sim_titleCore
-
2.3.
sim_titleIntro
-
2.4.
sim_titleConcl
-
2.5.
sim_titleAbstr
-
2.1.
We calculate the similarities between the title of a reference and the title (), the abstract (), the introduction (), the conclusion (), and the core sections () of the citing paper. These features should be able to capture the semantic similarity between the citer and a reference; in most cases, a title, abstract, and conclusion section are good summaries of the given citing paper. Core sections here refer to the same sections as in the count-based features.
More specifically, we calculated cosine similarity scores. A piece of text (e.g., a title or abstract) is first represented as a vector in the word space, where each dimension is a word (a word type; not a word token). The values in the vector are the word frequencies of each word appearing in this piece of text. ?’s (?) stemming algorithm was used to stem the text (remove suffixes) and we kept stop words (function words), since removing them did not improve the performance of our models during their development. Readers can refer to ? (?) for further discussions of vector space models of semantic similarity.
In a given citing paper (the citer), when a reference is mentioned in the body of the citer, the text that appears near the mention is called the citation context. Like the title of the cited paper, the citation context provides information about the cited paper; hence we can use the citation context as a surrogate for the full text of the cited paper, in the same way that we used the title as a surrogate. The next four similarity-based features compare the citation context to various parts of the citing paper:
-
2.
Similarity-based features
-
2.6.
sim_contextTitle
-
2.7.
sim_contextIntro
-
2.8.
sim_contextConcl
-
2.9.
sim_contextAbstr
-
2.6.
For each reference, we calculate the similarities between the citation contexts and the title (), abstract (), introduction (), and conclusion () of the citing paper. When a reference appears multiple times in the citer, we take the average of the similarities over all its contexts.
As with title similarity (features 2.1 to 2.5), we use cosine similarity, after the text was preprocessed with ?’s (?) stemmer. During development, we experimented with different window sizes, ranging from two words around a citation to several sentences around it. We found that using the entire sentence in which the citation appears gave the best results. In contrast, ? (?) found that contexts larger than one sentence were better for indexing purposes: further work might be needed to identify the optimal window.
Context-based features
The citation context of a reference could indicate the academic influence of the reference in other ways, beyond its value as as a surrogate for the full text of the cited paper (as in the above features 2.6 to 2.9). For example, if a citation appears in the context “the work of inspired us”, then seems likely to be influential for the given citing paper.
For these features, we define the citation context to be a window of ten words around a citation (five words on each side). If a reference appears multiple times in the citing paper, we calculate its average score.
The first three context-based features are based on the relation between the citation and the citation context:
-
3.
Context-based features
-
3.1.
contextMeta_authorMentioned
-
3.2.
contextMeta_appearAlone
-
3.3.
contextMeta_appearFirst
-
3.1.
The first feature () indicates whether the authors of a reference are explicitly mentioned in the citation context; for example, “the work of Smith et al. [4]” mentions the authors (Smith et al.) in the citation context of the reference ([4]). The second feature () indicates whether a citation is mentioned by itself (e.g., “[4]”) or together with other citations (e.g., “[3,4,5]”). When a citation is mentioned with other citations, the third feature indicates whether it is mentioned first (e.g., “[4]” is first in “[4,5,6]”).
These three features may be biased by the different citation format requirements of various journals, but we leave it to the supervised learning system to decide whether the features are useful. A feature may be useful for prediction even when it has some bias. (However, we will see later that these features were not particularly effective in our experiments.)
The next twelve context-based features are based on the meaning of the words in the citation context:
-
3.
Context-based features
-
3.4.
contextLex_relevant
-
3.5.
contextLex_recent
-
3.6.
contextLex_extreme
-
3.7.
contextLex_comparative
-
3.8.
contextLexOsg_wnPotency
-
3.9.
contextLexOsg_wnEvaluative
-
3.10.
contextLexOsg_wnActivity
-
3.11.
contextLexOsg_giPotency
-
3.12.
contextLexOsg_giEvaluative
-
3.13.
contextLexOsg_giActivity
-
3.14.
contextLexEmo_emo
-
3.15.
contextLexEmo_polarity
-
3.4.
We manually created four relatively short lists of words that we designed to detect whether the citation context suggests that the cited paper is especially relevant to the citer (), whether the citation context signals that the cited paper is new (), whether the citation context implies that the cited paper is extreme in some way (), and whether the citation context makes some kind of comparison with the cited paper (). The names of these features convey the kinds of words in the short lists. In Table 1, we give the full lists for and and a few terms for the other two features (as they both contain over 100 words).
| relevant, relevantly, related, relatedly, similar, similarly, likewise, pertinent, applicable, appropriate, useful, pivotal, influential, influenced, comparable, original, originally, innovative, suggested, interesting, inspiring, inspired | |
| recent, recently, up-to-date, latest, later, late, latest, subsequent, subsequently, previous, previously, initial, initially, continuing, continued, sudden, current, currently, future, unexpected, upcoming, expected, ongoing, imminent, anticipated, unprecedented, proposed, startling, preliminary, ensuing, repeated, reported, new, old, early, earlier, earliest, existing, further, update, renewed, revised, improved, extended | |
| greatly, intensely, acutely, almighty, awfully, drastically, exceedingly, exceptionally, excessively, … | |
| easy, easier, easiest, strong, stronger, strongest, vague, vaguer, vaguest, weak, weaker, weakest, … |
We also created features based on ?’s (?) semantic differential categories (). ? (?) discovered that three main factors accounted for most of the variation in the connotative meaning of adjectives. The three factors were evaluative (good–bad), potency (strong–weak), and activity (active–passive).
The General Inquirer lexicon (?) represents these three factors using six labels, Positiv and Negativ for the two ends of the evaluative continuum, Strong and Weak for the two ends of the potency continuum, and Active and Passive for the two ends of the activity continuum.11endnote: 1See http://www.wjh.harvard.edu/~inquirer/ to obtain a copy of the General Inquirer lexicon.
The feature is the number of words in the citation context that are labeled Positiv in the General Inquirer lexicon, is the number of words labeled Strong, and is the number of words labeled Active. The intuition behind these features is that a citation is more likely to be influential if positive, strong, active words occur in the citation context.
The General Inquirer lexicon has labels for 11,788 words. Using the algorithm of ? (?), we automatically extended the labels to cover 114,271 words. The additional words are from the WordNet lexicon. The WordNet features () are similar to the corresponding General Inquirer features (), except they include these additional words.22endnote: 2See http://wordnet.princeton.edu/ to download the WordNet lexicon.
Since the citation context is a window of ten words around the citation, the values of these features range from zero to ten. If a reference is cited multiple times in the body of the citing paper, we calculate its average value. For increased precision, we only considered the words in the citation context that have an adjective or adverb sense in WordNet.
We used an emotion lexicon (?) to check whether the citation context includes words that convey sentiment () or emotion (). The lexicon contains human annotation of emotion associations for about 14,200 words. The annotations in the lexicon indicate whether a word is positive or negative (known as sentiment, polarity, or semantic orientation), and whether it is associated with eight basic emotions (joy, sadness, anger, fear, surprise, anticipation, trust, and disgust).
The feature is the number of words in the citation context that are labeled either positive or negative. The feature is the number of words that are labeled with any of the eight basic emotions. The idea behind these features is that any kind of sentiment or emotion in the words in the citation context might indicate that the citation is influential, even if the sentiment or emotion is negative.
As with the other features, the values of range from zero to ten. Multiple occurrences of a citation are averaged.
Position-based features
The location of a citation in the body of a citing paper might be predictive of whether the cited paper was influential. Intuitively, the earlier the citation appears in the text, the more important it seems to us. The first two types of position-based features are based on the location of a citation in a sentence:
-
4.
Position-based features
-
4.1.
posInSent_begin
-
4.2.
posInSent_end
-
4.1.
These are binary features indicating whether a citation appears at the beginning () or the end () of the sentence. If a reference appears more than once in the citing paper, we calculated the percentages; for example, if a reference is cited three times in the paper and two of the three appear at the beginning of the sentences, the feature takes the value of 0.667.
The next four position-based features are based on the location of a citation in the entire citing paper:
-
4.
Position-based features
-
4.3.
posInPaper_stdVar
-
4.4.
posInPaper_mean
-
4.5.
posInPaper_last
-
4.6.
posInPaper_first
-
4.3.
We measured the positions of the sentences that cite a given reference, including the mean (), standard variance (), first (), and last position () of these sentences. These features are normalized against the total length (the total number of sentences) of the citing paper; thus the position ranges from 0 (the beginning of the citing paper) to 1 (the end of the citing paper).
More sophisticated location-based features are possible but not considered. For example, references appearing in a methodology section might be more influential than those appearing solely in the related work section.
Miscellaneous features
The next three features do not fit into the previous four classes and they have little in common with each other. We arbitrarily put them together as miscellaneous features:
-
5.
Miscellaneous features
-
5.1.
aux_citeCount
-
5.2.
aux_selfCite
-
5.3.
aux_yearDiff
-
5.1.
The citation count a paper has received (in the general literature; not the number of occurrences within a specific paper) is widely used as a metric for estimating the academic contribution of a paper, which in turn is an essential building block in calculating other metrics (e.g., -index) for evaluating the academic contribution of a researcher, organization, or journal. We are interested in understanding its usefulness in deciding academic influence (in a specific paper). That is, when cited in a given paper, is a more highly cited paper more likely to have academic influence on the citer? To explore this question, we collected the raw citation counts of each reference in Google Scholar ().
In accordance with convention, self-citation refers to the phenomenon where a citer and a reference share at least one common author. We are interested in knowing whether a self-citation would have a positive or negative correlation with academic influence. To study this, we manually annotated self-citation among the references and used it as a binary feature ().
Are older papers, if cited, more likely to be academically influential? We incorporated the publication year of a reference as a feature (). We calculated the difference in publication dates between a reference and the citer by subtracting the former from the latter, which resulted in a non-negative integer feature.
Contextual normalization
Many of the above features are sensitive to the length of the citing paper. For example, the number of occurrences of each reference in the entire citing paper () tends to range over larger values in a long paper than in a short paper. For predicting whether a reference is influential, it is useful to normalize the raw feature values for a given paper–reference pair by considering the range of values in the given citing paper. This is a form of contextual normalization (?, ?), where the citing paper is the context of a feature.
We normalize all our features so that their values are in the range . This kind of normalization is standard practice in data mining, as it improves the accuracy of most supervised learning algorithms (?). For example, consider the feature , where we count how many times a given reference is cited in the whole text. Suppose we find that, in a given citing paper, one reference is cited ten times, but all other references are cited only once. We would then give a score of 1 to the most cited reference, and a score of to the other references. That is, the most often cited references in any given citing paper always get a score of 1.
We formalize the normalization as follows. Our feature set contains both binary and real-valued features that take non-negative values. Binary features do not require normalization: Their values are 0 and 1.33endnote: 3This normalization leaves binary values unchanged, so it makes no difference whether it is applied to them. Other features are normalized to . Let be a paper–reference pair, where is the -th citing paper and is the -th reference in . Let be the -th feature in our feature set and let be the value of the feature in the paper–reference pair . Suppose that contains distinct references, , resulting in values for , . Let be the maximum of the values, . We normalize each to range from zero to one, using the formula . If is zero, then we normalize to zero.
Experiments with features
Using a labeled dataset, we first identify the features that are most correlated with academic influence. We then combine some of these features to achieve a good classification score.
Gold-standard dataset
We believe that the authors of a paper are in the best position to determine whether a given reference had a strong influence on their research. In a blog posting, we invited authors to help us create a gold-standard dataset of labeled references.44endnote: 4See http://tinyurl.com/counting-citations. The authors were directed to fill in an online form.55endnote: 5See http://tinyurl.com/influential-references. The instructions on the form were as follows:
We believe that most papers are based on 1, 2, 3 or 4 essential references. By an essential reference, we mean a reference that was highly influential or inspirational for the core ideas in your paper; that is, a reference that inspired or strongly influenced your new algorithm, your experimental design, or your choice of a research problem. Other references merely support the work.
We believe that authors are the best experts to assess which references are essential. We are interested in automatically finding these references. To know how well we are doing, we need your help: please give us the title of a few of your papers and list for each paper the references that you feel are most essential, those without which the work would not have been possible.
Forty different researchers filled out our online form (see Table 2). About half of them are from the USA and Canada. Three quarters of them are in computer science.
| Country | Number |
|---|---|
| Belgium | 1 |
| Brazil | 1 |
| Canada | 9 |
| Denmark | 1 |
| France | 4 |
| Germany | 2 |
| Greece | 1 |
| Norway | 1 |
| Poland | 1 |
| Portugal | 1 |
| Singapore | 1 |
| Slovenia | 1 |
| Spain | 1 |
| UK | 3 |
| USA | 12 |
| Discipline | Number |
|---|---|
| Biophysics | 1 |
| Chemistry | 1 |
| Computer Science | 30 |
| Ecology | 1 |
| Genetics | 2 |
| Geophysics | 1 |
| Mathematics | 1 |
| Physics | 1 |
| Signal Processing | 1 |
| Translation | 1 |
This gold-standard dataset provides us with a benchmark for supervised machine learning.66endnote: 6The dataset is freely available online at http://lemire.me/citationdata/. The authors gave us the titles of their papers and they indicated which references in each paper were influential for them. From the titles, we obtained PDF copies of their papers and converted them to plain text. We then extracted the references from the text and labeled them as influential or non-influential.
In total, the authors contributed 100 of their papers. OpenNLP was used to detect sentence boundaries and conduct tokenization.77endnote: 7See http://opennlp.apache.org/ to download OpenNLP. We then used ParsCit to parse the papers (?). ParsCit is an open-source package for parsing references and document structure in scientific papers. We first ran the papers through ParsCit and then used a few hand-coded regular expressions to capture citation occurrences in paper bodies that were not detected by ParsCit.
The contents of the papers were then further annotated. First, the section names were standardized to twelve predefined labels: title, author, abstract, introduction, related, main, conclusion, future, acknowledgment, reference, appendix, and date (the year of publication of the given paper). The default label for a section was main (the core or main body of the paper). For example, previous work and related work would both be standardized to related.
Second, the bibliographic items were manually corrected and meta-data about them (e.g., the Google citation counts) was included. The citations of these items in the main body of the paper were also manually corrected. For example, if references were cited as “[7-10]”, we modified the citation to “[7, 8, 9,10]”, so as to explicitly include references [8] and [9].
?’s (?) stemmer (mentioned in the preceding section) was only applied as a preprocessing step when generating feature vectors; the stemmer was not applied during the corpus annotation step described here.
The basic units in our study are paper–reference pairs, not papers. The 100 papers yield 3143 paper–reference pairs (that is, 3143 data points; 3143 feature vectors). In the main bodies of the 100 papers, there are 5394 occurrences of the references, so each paper contains an average of around 31 references (in the bibliographies) and 54 citations (in the main text). The dataset contains 322 (10.3% of 3143) influential references (strictly speaking, 322 influential paper–reference pairs). That is, their authors identified an average of 3.2 influential references per research paper.
Correlation between labels and features
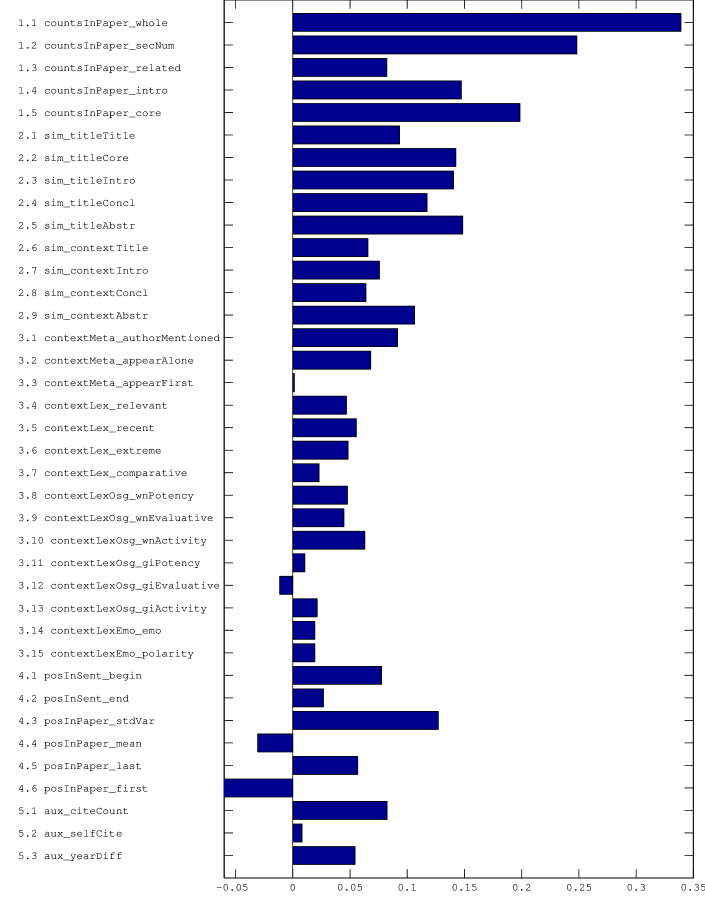
We seek to determine which features are better able to predict the academic influence of a reference. The Pearson correlation coefficients between the various features and the gold influence labels are a simple indication of how useful a feature might be. We show the coefficients in Figure 1.
First, consider the correlation coefficients for the count-based features:
-
1.
Count-based features
-
1.1.
countsInPaper_whole
-
1.2.
countsInPaper_secNum
-
1.3.
countsInPaper_related
-
1.4.
countsInPaper_intro
-
1.5.
countsInPaper_core
-
1.1.
Figure 1 shows that the most correlated individual features to academic influence are in-paper count features ( and ). This is a convenient result, because one of the best features, (the number of times a reference is cited in a paper), is also one of the easiest to compute from a technical point of view. Moreover, it suggests simple but potentially effective schemes for modifying the standard citation count (i.e., the number of papers that cite a given paper in the general literature): For each paper that cites a paper , increment the citation count for
-
•
only if was cited more than once in the body of ,
-
•
only if is cited more often in the body of than most of the other references in , or
-
•
only if is cited in more than one section of .
Intuitively, these modified citation counts may also be more robust than the standard citation count, considering that an author seems unlikely to cite a paper more than once when the paper is included in the references because it is de rigueur in the field.
Next, consider the similarity-based features. These are features that measure the semantic similarity between a citer and a reference. In general, we found such features well correlated with academic influence.
The first group of similarity-based features compares the similarities between the title of a cited paper and the title, introduction, conclusion, and abstract of the citer:
-
2.
Similarity-based features
-
2.1.
sim_titleTitle
-
2.2.
sim_titleCore
-
2.3.
sim_titleIntro
-
2.4.
sim_titleConcl
-
2.5.
sim_titleAbstr
-
2.1.
As shown in Figure 1, the correlation coefficients of the features (e.g., ) rank right after those of the two in-paper count features. As we will show soon, these features (e.g., ) can work synergetically with count-based features for predicting academic influence.
The second group of similarity-based features use citation context instead of the title of a cited paper:
-
2.
Similarity-based features
-
2.6.
sim_contextTitle
-
2.7.
sim_contextIntro
-
2.8.
sim_contextConcl
-
2.9.
sim_contextAbstr
-
2.6.
These features compare the similarities between citation contexts and the title, abstract, and conclusion of the citing paper. We found that the context–abstract () similarity feature is the one in this group that is most correlated with academic influence, followed by context–conclusion (), context–title(), and context–introduction ().
We turn to the context-based features. First, we focus on the features that consider the relation between the citation and the citation context:
-
3.
Context-based features
-
3.1.
contextMeta_authorMentioned
-
3.2.
contextMeta_appearAlone
-
3.3.
contextMeta_appearFirst
-
3.1.
In this group, has the highest correlation coefficient. This feature indicates whether the names of the authors appear in the citation context (e.g., “Smith et al. [4]”).
The second group of context-based features are based on the meaning of the words in the citation context:
-
3.
Context-based features
-
3.4.
contextLex_relevant
-
3.5.
contextLex_recent
-
3.6.
contextLex_extreme
-
3.7.
contextLex_comparative
-
3.8.
contextLexOsg_wnPotency
-
3.9.
contextLexOsg_wnEvaluative
-
3.10.
contextLexOsg_wnActivity
-
3.11.
contextLexOsg_giPotency
-
3.12.
contextLexOsg_giEvaluative
-
3.13.
contextLexOsg_giActivity
-
3.14.
contextLexEmo_emo
-
3.15.
contextLexEmo_polarity
-
3.4.
We used several different types of lexicons to capture different aspects of semantics in the citation contexts, including sentiment, emotion, and ?’s (?) semantic differential categories.
As we mentioned in the preceding section, is the number of words in the citation context that are labeled either positive or negative and is the number of words that are labeled with any of the eight basic emotions. Our hope was that any kind of sentiment or emotion in the words in the citation context might indicate that the citation is influential, even if the sentiment or emotion is negative, but Figure 1 shows that neither feature has a high correlation with the gold labels. This suggests to us that it might be better to split these features into more specific features for each of the possible categories.
To test this idea, we split into two features, one for positive polarity and one for negative polarity, and we split into eight features, one for each of the eight basic emotions. Figure 2 shows the correlation coefficients for each of these more specific features.
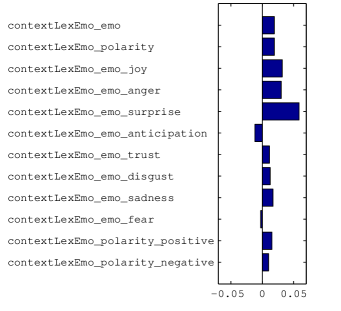
We see in Figure 2 that positive polarity has a higher correlation than negative polarity. Among the eight basic emotions, surprise has the highest correlation. These results are intuitively reasonable. However, none of the correlations is greater than 0.06. It seems that none of these features are likely to be of much use for predicting influence.
Let us consider the position-based features. First, we examine the position of a citation in a sentence:
-
4.
Position-based features
-
4.1.
posInSent_begin
-
4.2.
posInSent_end
-
4.1.
Our results suggest that references located at the beginning of a sentence might be more influential.
The second group of position-based features calculates the locations of citations in the body of the paper:
-
4.
Position-based features
-
4.3.
posInPaper_stdVar
-
4.4.
posInPaper_mean
-
4.5.
posInPaper_last
-
4.6.
posInPaper_first
-
4.3.
The best paper-position-based feature is the standard variance of a reference’s positions (). Note that this feature is likely to overlap with the in-paper-counts features to some degree: A larger in-paper-counts number could correspond to a higher position variance, so these features may not have additive benefit when used together.
Finally, we examine the miscellaneous features:
-
5.
Miscellaneous features
-
5.1.
aux_citeCount
-
5.2.
aux_selfCite
-
5.3.
aux_yearDiff
-
5.1.
Figure 1 shows that the correlation coefficient between citation counts and the influence labels is positive. This confirms the previous finding that highly cited papers are more likely to be cited in a meaningful manner (?). However, we find that the correlation is moderate: It is smaller than that of half of the features we tested. Hence, while highly cited papers may have more academic influence, the citation count is not an ideal indicator of influence. This result is consistent with the fact that papers are often cited for reasons other than academic influence. When a paper is highly cited, the authors of the citing paper may feel obliged to cite it, yet might not take the time to read it.
From Figure 1, we see a small positive correlation between self-citation and the gold influence labels. We will see later that is useful as a corrective factor in the final model.
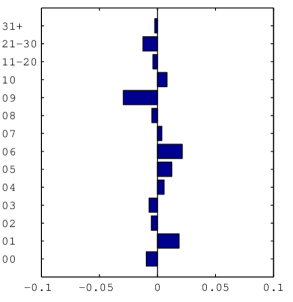
Are older papers more likely to be influential? In Figure 1, the feature has a small positive correlation with the influence. We discretized the feature over the ranges 0, 1, …, 10, 11–20, 21–30, . The corresponding Pearson coefficients are given in Figure 3. The figure shows that, when the cited paper is one or four to seven years older than the citing paper, there is a positive correlation with academic influence. More recent papers (0, 2 and 3 years) and older papers ( years) are poorly or negatively correlated with academic influence. This result is consistent with our interest (mentioned in the section on defining academic influence) in the proximate influences on a citing paper.
Results of predicting academic influence
We used the LIBSVM support vector machine (SVM) package (?) as our supervised learning algorithm.88endnote: 8LIBSVM is available for download at http://www.csie.ntu.edu.tw/~cjlin/libsvm/. We chose a second-degree polynomial as our kernel function.99endnote: 9The LIBSVM parameters we used are “-s 0 -d 2 -t 1 -r 1”.
The F-measure was applied to evaluate the performance of the learned model. The F-measure is defined as the harmonic mean of precision and recall : . The precision of a model is the conditional probability that a paper–reference pair is influential (according to the gold-standard author-generated label), given that the model guesses that it is influential. The recall of a model is the conditional probability that the model guesses that a paper–reference pair is influential, given that it actually is influential (according to the gold-standard).
Another metric is accuracy, defined as the ratio of properly classified paper–reference pairs (as either influential or not) over the total number of classified pairs. However, the classes in our data are imbalanced (10.3% in the influential class and 89.7% in the non-influential class). This makes accuracy inappropriate as a performance measure for our task, because we could achieve an accuracy of 89.7% by the trivial strategy of always guessing the non-influential class.
The F-measure is a better performance measure for imbalanced classes, because it rewards a model that has a balance of precision and recall. Always guessing non-influential yields an F-measure of zero (we take division by zero to be zero). Always guessing influential yields an F-measure of 18.7% (). Unlike accuracy, the F-measure penalizes trivial models.
The SVM algorithm is designed to optimize accuracy, whereas we want to optimize the F-measure. Since an SVM does not directly optimize the F-measure and our data are not balanced, we used a simple down-sampling method to handle this. In each fold of cross validation, we randomly down-sampled the negative instances (non-influential references) in the training data to make their number equal to that of the positive ones (influential references).
Table 3 shows the scores of different models under ten-fold cross-validation. We included two baselines. The first baseline randomly labels a reference with a probability equal to the distribution of the labels in the training data. The second predicts the academic influence of references based on their Google citation counts (). Note that the macro-averaged F-measure is not necessarily between the averaged precision and recall. For example, for model (3) in the table, 0.35 is not between 0.36 and 0.41.
Starting with model (3) in the table, we added features greedily: In each round, the feature resulting in the maximum improvement of the F-measure was added. That is, model (3) is the best model that uses only one single feature, and the best performing model (with four features) is model (6).
| Model | Features | F-measure | Precision | Recall | |
|---|---|---|---|---|---|
| (1) | random | ||||
| (2) | aux_citeCount | ||||
| (3) | countsInPaper_whole | * | |||
| (4) | (3) + sim_titleCore | *† | |||
| (5) | (4) + countsInPaper_secNum | *† | |||
| (6) | (5) + aux_selfCite | *† | |||
In Table 3, all of the models marked with a dagger sign () are statistically significantly better than model (3). The models marked with an asterisk (*) are statistically significantly better than the two baselines. We use a one-tailed paired t-test with a 99% significance level.
The first feature chosen for the model by greedy feature selection is , the feature with the highest correlation in Figure 1. The best model achieves an F-measure of about 42% (see Table 3). The model uses only four features, two of which are count-based () and one semantics-based (). Adding more features to model (6) did not result in further improvement. Using all features presented in Figure 1 results in an F-measure of 37%, which is significantly better than model (1) and (2) (), insignificantly better than the best single-feature model (3) (), and worse than model (6) (). This observation supports the hypothesis that feature selection is useful for this task. In general, feature selection removes useless or detrimental features, which often leads to better performance (e.g., higher F-measures) and greater efficiency.
We find it interesting that a semantic feature (, the similarity between the title of the cited paper and the core sections of the citing paper) is the second feature chosen. It seems that this feature complements the count-based feature; it covers some papers that are influential but have lower counts. The improvement of model (4) over model (3) is about 4% in terms of F-measure, which is statistically significant at a level of . Using another count-based feature, , additionally improves the performance. Although by itself has a small correlation with influence (see Figure 1), it seems to be useful when combined with the other three features.
Note that the F-measure we used here is the macro-averaged F-measure (?). That is, we calculated the F-measure for each paper individually and then computed the arithmetic average over all the F-measures obtained. For each reference in a given paper, we used the SVM model to estimate the probability that the reference is labeled influential. In the training data, the average paper contained three influential references. Therefore the model guesses that the top three references in the given paper, with the highest estimated probabilities, are influential, and the remaining references, with lower probabilities, are non-influential.
It is difficult to describe an SVM model intuitively. Moreover, given an SVM model, it is not straightforward to describe the importance of a feature. To further assess the importance of the four features in model (6), we have also applied logistic regression to our data (?). Logistic regression assumes that the probability distribution of some binary random variable is of the form
where are feature values and are weight vectors. Given training instances, we can solve for the weights by maximizing the likelihood function
where is the binary gold label of the training instance. Once we have solved for the weights, we can classify instances by using a threshold . That is, given an instance with feature values , we predict if and we predict otherwise. For our application, we set the threshold so that the relative number of influential citations is the same as in the training set.
With logistic regression, the magnitude (absolute value) of the weights, , indicates the importance of the corresponding feature in the model. We used the mnrfit command in Matlab to conduct logistic regression on our data. The weights assigned to the features , , , and are 2.7228, 1.2683, 1.1763, and -0.0923. Their absolute values correspond to the order they are selected by SVM in Table 3: The most important feature is and the least important is . Note that the weight for is smallest, which corresponds to the observation that self-citations are less likely to be influential. We have also used logistic regression to classify the references, using the same experimental setup as we used for the SVM. The logistic regression performance is slightly below that of the SVM ( vs. ).1010endnote: 10With logistic regression, the precision and recall are 0.38 and 0.42.
When only one feature is used with SVM (as in model (3)), the classification task can be regarded as setting a threshold on the feature, to separate the influential references from the rest. In Figure 4, we vary such a threshold to provide a full view of the F-measures of the two most relevant features shown in Figure 1. Different thresholds here resulted in different percentages of references being predicted as influential, corresponding to the x-axis in the figure. Note that our thresholds are in the range [0, 1], since we have normalized the count values (and all other features) to this range (as we discussed earlier).
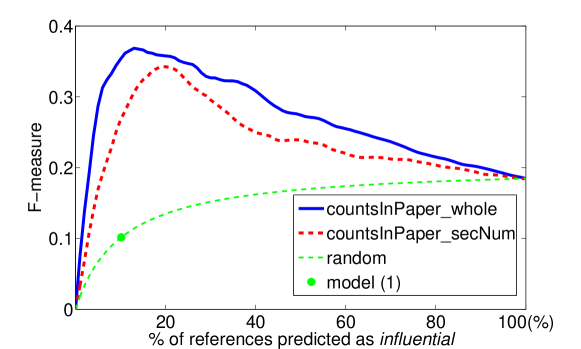
Figure 4 also includes the F-measure curve of random guesses (random in the figure). This curve serves as a minimum baseline for comparison with the other features. Model (1) in Table 3 corresponds to the point on the random curve such that the percentage of references predicted as influential equals the size of the influential class ( 322/3143 = 10.3%).
In Figure 4, the peak F-measure of our best feature, , is 0.37 (when the value on the x-axis is 13%). Model (3) attained an F-measure of 0.35 in Table 3, slightly below the value of 0.37 in Figure 4. Model (3) was trained and tested with ten-fold cross validation, whereas the F-measure of 0.37 is based on using the whole dataset as training data, with no independent testing data; thus the small gap in the F-measures (0.35 versus 0.37) indicates that SVM is performing well.
Experiments with in-paper citation counts
In the preceding section, we made a number of observations. A significant one is that the in-paper citation counts (how many times a reference is cited in a paper) are the most predictive features for academic influence. The following experiments are designed to further validate our results. Since the in-paper counts convey influence information, which is ignored in the conventional counting of citations, we wondered whether incorporating in-paper citation numbers into global citation counting would result in different rankings of papers and authors.
In contrast to the conventional citation counting, we refer to the methods that take into consideration the in-paper counts as influence-primed citation counts. We conducted two types of experiments. First, we explored the correlation between the rankings of papers and authors with and without influence-primed citation counts. Second, we tackled the task of identifying ACL Fellows.
Influence-primed citation counts
A classical citation network is a graph in which the nodes (vertices) correspond to papers and there is a directed link (directed edge) from one paper to another if the first paper cites the second paper. The network is usually acyclic (it has no loops), due to time: An earlier paper rarely cites a later paper (with some exceptions, due to overlap in the gestation periods of publications).
A slightly more sophisticated citation network could have weights or labels associated with the edges in the graph. For example, a directed edge from citing paper to cited paper might be labeled as provides evidence that supports claims in , or the directed edge might be weighted with a number that indicates how influential is to .
There are various ways that in-paper citation counts can be used to modify classical citation networks. We have experimented with using in-paper citation counts for filtering edges in the graph and for weighting edges in the graph.
A simple filtering method is to drop the edge from citing paper to cited paper when the in-paper citation count for in is below a threshold. Equivalently, when building a citation network, only add an edge when the in-paper citation count is greater than or equal to a threshold.
We have also tried filtering with a combination of two thresholds, and . For a given paper–reference pair (i.e., a given citing–citer pair in the citation network), when building a network, we add an edge from citing paper to cited paper based on the in-paper citation count of the reference (i.e., the number of times is mentioned anywhere in the body of ) and the rank of the reference relative to the other references in (i.e., the rank in a list, sorted in descending order of in-paper citation counts). An edge is added only if the in-paper citation count is at least and the rank is less than (lower rank is better, because the list is sorted in descending order).
An alternative to filtering is weighting edges. The edge between a reference and a citer can be weighted by the in-paper citation counts. Given a citing paper and a cited paper , suppose that is mentioned times in the body of . There are many functions that we might apply to convert the in-paper citation count to a weight. Any linear or polynomial function might be useful.
In the following experiments, we use the square of the in-paper count to weight an edge: We weight the edge from to with . Squaring gives more weight to higher values of .
The conventional citation count for a paper is calculated from a citation network. It is the number of edges in the graph that are directed into the vertex that represents the given paper. That is, the conventional citation count for a paper is the number of papers that cite the given paper.
We weight citations according to the square of the number of times the reference is mentioned in the text. For example, being cited once in a paper that mentions the reference once counts for one whereas being cited once in a paper that mentions the reference twice counts for four. Weights are added up: Being cited four times by four papers that mention the reference once counts the same as being cited once by a paper that mentions the reference two times.
The influence-primed citation count is like the conventional citation count, except it weights each edge by , instead of 1. We define influence-primed citation count formally as follows:
Definition.
Given two papers, and , let be the number of times paper mentions paper in the body of its text, excluding the reference section. If the paper cites paper , then ; otherwise . Let (the literature) be the set of all papers in the given citation network. The influence-primed citation count of paper , , is
The function name, , stands for citations, influence-primed.
The conventional -index for an author is the largest number such that at least of the author’s papers are cited by at least other papers. Each citation of a paper has a weight of 1.
The influence-primed -index for an author is like the conventional -index, except it weights each edge by , instead of 1. The influence-primed -index for an author is the largest number such that at least of the author’s papers have an influence-primed citation count of at least .
For example, if an author has four papers, each one cited only once, but each time they are cited, they are mentioned twice, then the influence-primed -index is 4. In contrast, with the conventional -index, the same author would receive an -index of 1.
We define influence-primed -index formally as follows:
Definition.
An author, , with a set of papers (the œuvre) has an influence-primed -index, , of if is the largest value such that
The function name, , stands for -index, influence-primed. We refer to this as the hip-index.
ACL Anthology Network
For this experiment, we use the AAN (ACL Anthology Network) dataset (?). AAN is a citation network constructed from the papers published in Association for Computational Linguistics (ACL) venues (conferences, workshops, and journals since 1965), approximately 20,000 papers. The AAN citation network is a closed graph; edges from or to the papers published outside ACL venues are not included. In effect, by using the AAN citation network, we can measure the impact of researchers and papers on the ACL community. This restriction might be desirable when we try to identify the recipients of honours granted by ACL. Table 4 shows the basic statistics for the dataset.1111endnote: 11The AAN corpus is available at http://clair.eecs.umich.edu/aan/index.php.
| Statistics | Values |
|---|---|
| Number of venues | 341 |
| Number of papers | 18,290 |
| Number of authors | 14,799 |
| Number of paper citations | 84,237 |
To obtain in-paper counts, we used regular expressions to locate citations. Our regular expressions are good at both precision and recall according to our manual examination, but they still make a few errors. For example, the regular expressions have trouble with citations that span two lines of text and with multiple papers written by the same author in the same year. Another problem is automatically distinguishing the main body text from the reference section of a paper. The regular expressions may wrongly increment the in-paper count by matching citations in the reference section.
Numerical citations (e.g., “[1]” or “[1,2,3]”) are more difficult to process than textual citations (e.g., “Smith et al. (1998)”). We used a random number generator to select a sample of 100 papers from AAN and then we manually determined their citation types. In this random sample, 7% used numerical citations. Since numerical citations are relatively rare in the AAN dataset, we simply ignored them.
We did not normalize the in-paper citation count for these experiments with the AAN dataset. In this section, the in-paper citation count is a non-negative integer value. The reason for this is that the AAN network is a closed graph: All citations to and from papers outside of the AAN dataset are ignored in the AAN citation network. The maximum value that we used for contextual normalization in the preceding section, , could be distorted by the ignored citations. For example, a paper that mainly cites the AAN papers could be normalized very differently from one that mainly cites non-AAN papers. The maximum value may be highly sensitive to whether a citing paper is influenced by cited work that is outside of the AAN network.
The in-paper citation count that we use in this section is essentially a raw (unnormalized) variation of . We did not use , because it might be more sensitive to noise introduced by the process of automatically detecting section boundaries. (We manually detected sections in the preceding experiments, but this manual process does not scale up from 100 papers to 20,000 papers.) Figure 4 suggests that performs better than , and it is easier to compute.
Conventional versus influence-primed counting
A natural question is whether there is any difference between conventional citation counts and influence-primed citation counts. In particular, do the two approaches yield different rankings of the papers?
Table 5 shows the Spearman correlation coefficients between the AAN papers. We grouped the papers according to their ranks in the conventional counting. For each group, we calculated the Spearman correlation coefficient between the conventional counts and the influence-primed counts.
| Papers | Correlations |
|---|---|
| 1–100 | |
| 101–200 | |
| 201–300 | |
| 301–400 | |
| 401–500 | |
| 501–600 | |
| 601–700 | |
| 701–800 | |
| 801–900 | |
| 901–1000 |
For example, papers 1–100 are the top 100 most highly cited papers, according to conventional citation counts, where each edge directed into a given paper increments that paper’s count by one. For these 100 papers, we have a vector of 100 conventional citation counts. We also calculate a vector of 100 influence-primed citation counts. The Spearman correlation between these two vectors is 0.67.1212endnote: 12Spearman correlation is specifically intended for comparing ranked lists, whereas Pearson correlation is more appropriate when numerical values are more important than ranks.
For the top 100 most highly cited papers, conventional citations counts and influence-primed citation counts have a high correlation. As we move down the list, the correlation drops. The two counts agree on the most highly ranked papers, but they disagree on the less cited papers. Weighting makes a difference.
Table 6 shows the Spearman correlation coefficients for the AAN authors, under these two different counting methods. The -indexes of the authors were calculated and were used to rank the authors. For each group of authors, we calculate the Spearman correlation between the -indexes and the hip-indexes. Comparing Tables 5 and 6, we see that the authors’ correlations steadily decline as we go down the rows of Table 6, but the papers’ correlations fluctuate with no clear trend as we go down the rows of Table 5. This indicates that conventional citation counts and influence-primed citation counts are not related by a simple linear transformation. That is, influence-primed counting is different from conventional counting in a non-trivial way.
| Authors | Correlations |
|---|---|
| 1–100 | |
| 101–200 | |
| 201–300 | |
| 301–400 | |
| 401–500 | |
| 501–600 | |
| 601–700 | |
| 701–800 | |
| 801–900 | |
| 901–1000 |
Identifying ACL Fellows
The Association for Computational Linguistics has seventeen fellows.1313endnote: 13ACL Fellows are listed at http://aclweb.org/aclwiki/index.php?title=ACL_Fellows. When we performed our experiments, there were only seventeen fellows, but there are more now. We might assume that these seventeen fellows can be identified by selecting the authors having the best -index scores. Indeed, ? (?) found that the -index was superior at predicting the future performance of a researcher than the number of citations, the number of papers, and mean citations per paper (?).
Table 7 shows the precision of the conventional -index and influence-primed hip-index at identifying ACL Fellows. For a given value of , we sort all authors in AAN in descending order of their -indexes and then count the number of ACL Fellows among the top authors in the sorted list. We also sort all authors in AAN in descending order of the hip-indexes and then count the number of ACL Fellows among the top . Precision is the number of ACL Fellows in the top divided by . Table 7 shows the precision as ranges from 1 to 17: we stop at 17 because there are 17 ACL Fellows in total. For example, the second row in the body of the table, with , shows that zero of the top two -index ranked authors are ACL Fellows (precision 0%), but one of the top two hip-index ranked authors is an ACL Fellow (precision 50%). For , -index finds zero ACL Fellows but hip-index finds two Fellows.
| Precision (%) | |||
| -index | hip-index | ||
| * | |||
| * | |||
| * | |||
| * | |||
| * | |||
| * | |||
| * | |||
| AveP | * | ||
The asterisks (*) in the table mark where the two methods have different results. The table shows that the influence-primed model identified the ACL fellows with a better precision for seven values of . When we limit to less than or equal to seventeen, hip-index is never worse but often better than -index. As grows, the differences between the two indexes become negligible. At , both indexes identify 5 out 17 ACL Fellows.
The last row of Table 7 shows the average precision measure (AveP), which is commonly used to evaluate search engines (?). The formula for AveP is
where is the point at which we cut off the list of search results for a search engine (in our case, , where we cut off the ranked lists of authors), is the total number of relevant documents (in our case, the total number of ACL Fellows, ), is the precision at each observation point (in our case, ranges from 1 to 17), and is an indicator function that equals 1 if the -th document is relevant to the given query and 0 otherwise (in our case, is 1 if the -th author is an ACL Fellow and 0 otherwise). From the table, we can see that the AveP score of the influence-primed model is 14% whereas that of the conventional model is 10%.
This better average precision measure is encouraging evidence that weighting the citations by our measures of influence could improve the identification of the best scientists.
Future work and limitations
Further work is needed to validate these results over more extensive and different datasets. We rely on authors to annotate their own papers. However, we did not assess the reliability of authors at identifying the key references. For papers with several authors, we could ask more than one author to provide annotation. Thus we could quantify the inter-annotator agreement. We could also ask the same authors, after a long delay, to annotate their own papers again. Furthermore, we would find it interesting to compare the performance of a machine learning approach with human-level performance. For this purpose, we could recruit independent annotators having specific degrees of expertise.
We assumed that the full text of the citing paper was available. Yet some citation indexing databases have a more limited access to the content due to copyright restrictions or technical limitations. It should not be difficult to extend these databases so that they have the necessary information to identify influential references or to count the number of times a paper mentions another. For example, this information could be provided by the copyright owner without giving access to the full text.
Intentionally, we limited our feature set so that we did not have to recover full text of the cited work (only the title). However, many other features are possible if we access the full text of both the citer and cited paper: ? (?) measure similarity by the overlap in the reference section. We could also add other features such as the prestige of the cited venue or the prestige of the cited authors (?). We also did not take into account the relationships between authors. Maybe authors who are similar or related are more likely to influence each other. In related work, ? (?) proposed to measure the number of citers (authors who cite) rather than the number of citations.
Moreover, identifying the genuinely significant citations might be viewed as an adversarial problem. Indeed, some authors and editors attempt to game (i.e., manipulate or exploit) citations counts. In a survey, ? (?) found that 20% of all authors were coerced into citing some references by an editor, after their manuscript had undergone normal peer review. In fact, the majority of authors reported that they were willing to add superfluous citations if it is an implied requirement by an editor. If we could determine that many non-influential references in some journals are citing some specific journals, this could indicate unethical behavior.
Our approach for identifying celebrated scientists is simple. State-of-the-art approaches such as that of ? (?) can achieve better precision and recall. We expect that they would benefit from an identification of the influential citations.
In some circumstances counting multiple occurrences of a citation might require coreference resolution (?, ?). By convention, some authors and editors only ever cite a reference once but mention it several times either with a nominal, or pronominal reference.
Mazloumian (?) found that a useful predictor of future performance was the annual number of citations at the time of citation. Maybe the annual number of influential citations could be a superior predictor.
A finer view of the problem is to rank or rate the references by their degrees of academic influence, which however could bring further complexity that we are avoiding in the present work; e.g., comparing two less influential or uninfluential references could be a harder task even for human annotators, and such annotation may be difficult to interpret.
Nevertheless, a weighted citation measure based on the number of occurrences of a citation could significantly alter other evaluation metrics that depend on simple citation counts, such as Impact Factor (?), Eigenfactor, and Article Influence (?). Even though such a refinement would not address the statistical charges leveled against citation-based evaluation metrics (?), it would at least address to some degree the need to distinguish between citations that acknowledge an intellectual debt and de-rigeur citations.
We conjecture that some types of research papers that tend to be highly cited, such as review or methodological articles, are less likely to be perceived as influential. ? (?) found that weighting citations by the in-paper frequency reduced the importance of reviews. We should further investigate this issue to verify whether original contributions are significantly more likely to be perceived as influential.
Conclusions
One of our main results is that counting the number of times a paper is cited () is one of the best predictors of how influential a reference is. This confirms an earlier result by ? (?) who stated, “Citation frequency of individual articles in other papers more fairly measures their scientific contribution than mere presence in reference lists.” Alternatively, we can count the number of sections in which a paper is cited ().
We believe that in assessing the influence of a research paper or researcher, weighting the citations by these features (e.g., ) would provide more robust results. It should also be used when tracking follow-up work or recommending research papers.
We have also shown that we could combine the in-paper citation counts () and the semantic relatedness between a reference and the citing paper, to derive a superior classifier. Though self-citations are only slightly correlated with academic influence, a classifier can derive some benefits when combining it with other features.
Acknowledgments
We are grateful to the volunteers who identified key citations in their own work. Daniel Lemire acknowledges support from the Natural Sciences and Engineering Research Council of Canada (NSERC) with grant number 26143. We thank M. Couture, V. Larivière and the anonymous reviewers for their helpful comments.
References
- Abu-Jbara and Radev Abu-Jbara, A., and Radev, D. (2011). Coherent citation-based summarization of scientific papers. In Proceedings of the 49th Annual Meeting of the Association for Computational Linguistics: Human Language Technologies - Volume 1, HLT ’11, pp. 500–509, Stroudsburg, PA, USA. Association for Computational Linguistics.
- Adler et al. Adler, R., Ewing, J., and Taylor, P. (2009). Citation statistics. Statistical Science, 24(1), 1–14.
- Agarwal et al. Agarwal, S., Choubey, L., and Yu, H. (2010). Automatically classifying the role of citations in biomedical articles. In AMIA Annual Symposium Proceedings, Vol. 2010, p. 11. American Medical Informatics Association.
- Ajiferuke et al. Ajiferuke, I., Lu, K., and Wolfram, D. (2010). A comparison of citer and citation-based measure outcomes for multiple disciplines. Journal of the American Society for Information Science and Technology, 61(10), 2086–2096.
- Athar and Teufel Athar, A., and Teufel, S. (2012). Detection of implicit citations for sentiment detection. In Proceedings of the Workshop on Detecting Structure in Scholarly Discourse, ACL ’12, pp. 18–26, Stroudsburg, PA, USA. Association for Computational Linguistics.
- Balaban Balaban, A. T. (2012). Positive and negative aspects of citation indices and journal impact factors. Scientometrics, 92(2), 241–247.
- Bergstrom Bergstrom, C. (2007). Measuring the value and prestige of scholarly journals. College & Research Library News, 68(5), 314–316.
- Bollen et al. Bollen, J., Van de Sompel, H., Hagberg, A., and Chute, R. (2009). A principal component analysis of 39 scientific impact measures. PloS One, 4(6), e6022.
- Bornmann and Daniel Bornmann, L., and Daniel, H.-D. (2008a). Functional use of frequently and infrequently cited articles in citing publications. European Science Editing, 34(2), 35–38.
- Bornmann and Daniel Bornmann, L., and Daniel, H.-D. (2008b). What do citation counts measure? a review of studies on citing behavior. Journal of Documentation, 64(1), 45–80.
- Bornmann et al. Bornmann, L., Mutz, R., and Daniel, H.-D. (2008). Are there better indices for evaluation purposes than the index? a comparison of nine different variants of the index using data from biomedicine. Journal of the American Society for Information Science and Technology, 59(5), 830–837.
- Buckley and Voorhees Buckley, C., and Voorhees, E. M. (2000). Evaluating evaluation measure stability. In Proceedings of the 23rd annual international ACM SIGIR conference on Research and development in information retrieval, SIGIR ’00, pp. 33–40, New York, NY, USA. ACM.
- Chang and Lin Chang, C.-C., and Lin, C.-J. (2011). LIBSVM: A library for support vector machines. ACM Transactions on Intelligent Systems and Technology, 2(3), 27:1–27:27.
- Chubin and Moitra Chubin, D. E., and Moitra, S. D. (1975). Content analysis of references: adjunct or alternative to citation counting?. Social studies of science, 5(4), 423–441.
- Councill et al. Councill, I. G., Giles, C. L., and Kan, M.-Y. (2008). Parscit: An open-source crf reference string parsing package. In Proceedings of the Language Resources and Evaluation Conference. European Language Resources Association.
- Di Marco et al. Di Marco, C., Kroon, F. W., and Mercer, R. E. (2006). Using hedges to classify citations in scientific articles. In Shanahan, J., Qu, Y., and Wiebe, J. (Eds.), Computing Attitude and Affect in Text: Theory and Applications, Vol. 20 of The Information Retrieval Series, pp. 247–263. Springer Netherlands.
- Dietz et al. Dietz, L., Bickel, S., and Scheffer, T. (2007). Unsupervised prediction of citation influences. In Proceedings of the 24th international conference on Machine learning, pp. 233–240. ACM.
- Ding Ding, Y. (2011). Applying weighted pagerank to author citation networks. Journal of the American Society for Information Science and Technology, 62(2), 236–245.
- Ding and Cronin Ding, Y., and Cronin, B. (2011). Popular and/or prestigious? measures of scholarly esteem. Information processing & management, 47(1), 80–96.
- Dubin Dubin, D. (2004). The most influential paper Gerard Salton never wrote. Library Trends, 52(4), 748–764.
- Egghe Egghe, L. (2006). Theory and practise of the g-index. Scientometrics, 69(1), 131–152.
- Garfield Garfield, E. (1965). Can citation indexing be automated?. In Statistical association methods for mechanized documentation, Symposium proceedings, ed. M. E. Stevens et al. (Washington: National Bureau of Standards, Miscellaneous Publication 269, 1965), pp. 188–192.
- Garfield Garfield, E. (2006). The history and meaning of the journal impact factor. JAMA: the Journal of the American Medical Association, 295(1), 90–93.
- Garfield and Malin Garfield, E., and Malin, M. V. (1968). Can nobel prize winners be predicted. In 135th meetings of the American Association for the Advancement of Science, Dallas, TX.
- Garzone and Mercer Garzone, M., and Mercer, R. (2000). Towards an automated citation classifier. In Hamilton, H. (Ed.), Advances in Artificial Intelligence, Vol. 1822 of Lecture Notes in Computer Science, pp. 337–346. Springer Berlin Heidelberg.
- Gilbert Gilbert, G. N. (1977). Referencing as persuasion. Social Studies of Science, 7(1), 113–122.
- Giles et al. Giles, C. L., Bollacker, K. D., and Lawrence, S. (1998). CiteSeer: an automatic citation indexing system. In Proceedings of the third ACM conference on Digital libraries, DL ’98, pp. 89–98, New York, NY, USA. ACM.
- Gingras and Wallace Gingras, Y., and Wallace, M. L. (2010). Why it has become more difficult to predict nobel prize winners: a bibliometric analysis of nominees and winners of the chemistry and physics prizes (1901–2007). Scientometrics, 82(2), 401–412.
- Gonzalez-Pereira et al. Gonzalez-Pereira, B., Guerrero-Bote, V. P., and Moya-Anegón, F. (2010). A new approach to the metric of journals’ scientific prestige: The sjr indicator. Journal of Informetrics, 4(3), 379–391.
- Hanney et al. Hanney, S., Frame, I., Grant, J., Buxton, M., Young, T., and Lewison, G. (2005). Using categorisations of citations when assessing the outcomes from health research. Scientometrics, 65(3), 357–379.
- Haque and Ginsparg Haque, A.-u., and Ginsparg, P. (2011). Phrases as subtopical concepts in scholarly text. In Proceedings of the 11th annual international ACM/IEEE joint conference on Digital libraries, JCDL ’11, pp. 25–28, New York, NY, USA. ACM.
- Hirsch Hirsch, J. E. (2005). An index to quantify an individual’s scientific research output. Proceedings of the National Academy of Sciences of the United states of America, 102(46), 16569.
- Hirsch Hirsch, J. E. (2007). Does the h index have predictive power?. Proceedings of the National Academy of Sciences, 104(49), 19193–19198.
- Hou et al. Hou, W.-R., Li, M., and Niu, D.-K. (2011). Counting citations in texts rather than reference lists to improve the accuracy of assessing scientific contribution. BioEssays, 33(10), 724–727.
- Ioannidis Ioannidis, J. P. (2006). Concentration of the most-cited papers in the scientific literature: analysis of journal ecosystems. PLoS One, 1(1), e5.
- Kaplan et al. Kaplan, D., Iida, R., and Tokunaga, T. (2009). Automatic extraction of citation contexts for research paper summarization: a coreference-chain based approach. In Proceedings of the 2009 Workshop on Text and Citation Analysis for Scholarly Digital Libraries, NLPIR4DL ’09, pp. 88–95, Stroudsburg, PA, USA. Association for Computational Linguistics.
- Le et al. Le, M.-H., Ho, T.-B., and Nakamori, Y. (2006). Detecting citation types using finite-state machines. In Ng, W.-K., Kitsuregawa, M., Li, J., and Chang, K. (Eds.), Advances in Knowledge Discovery and Data Mining, Vol. 3918 of Lecture Notes in Computer Science, pp. 265–274. Springer Berlin / Heidelberg.
- Lehmann et al. Lehmann, S., Jackson, A. D., and Lautrup, B. E. (2006). Measures for measures. Nature, 444(7122), 1003–1004.
- Leskovec et al. Leskovec, J., Backstrom, L., and Kleinberg, J. (2009). Meme-tracking and the dynamics of the news cycle. In Proceedings of the 15th ACM SIGKDD international conference on Knowledge discovery and data mining, KDD ’09, pp. 497–506, New York, NY, USA. ACM.
- Lewis Lewis, D. (1991). Evaluating text categorization. In Proceedings of the Speech and Natural Language Workshop, pp. 312–318.
- Liang et al. Liang, Y., Li, Q., and Qian, T. (2011). Finding relevant papers based on citation relations. In Wang, H., Li, S., Oyama, S., Hu, X., and Qian, T. (Eds.), Web-Age Information Management, Vol. 6897 of Lecture Notes in Computer Science, pp. 403–414. Springer Berlin / Heidelberg.
- Long Long, S. J. (1997). Regression Models for Categorical and Limited Dependent Variables. Sage, New York.
- Marchant Marchant, T. (2009). Score-based bibliometric rankings of authors. Journal of the American Society for Information Science and Technology, 60(6), 1132–1137.
- Mazloumian Mazloumian, A. (2012). Predicting scholars’ scientific impact. PloS One, 7(11), e49246.
- Mercer et al. Mercer, R. E., Di Marco, C., and Kroon, F. W. (2004). The frequency of hedging cues in citation contexts in scientific writing. In Advances in Artificial Intelligence, Vol. 3060 of Lecture Notes in Computer Science, pp. 75–88. Springer Berlin Heidelberg.
- Mohammad and Turney Mohammad, S., and Turney, P. (2010). Emotions evoked by common words and phrases: Using mechanical turk to create an emotion lexicon. In Proceedings of the NAACL-HLT 2010 Workshop on Computational Approaches to Analysis and Generation of Emotion in Text.
- Moravcsik and Murugesan Moravcsik, M. J., and Murugesan, P. (1975). Some results on the function and quality of citations. Social studies of science, 5(1), 86–92.
- Nanba and Okumura Nanba, H., and Okumura, M. (1999). Towards multi-paper summarization using reference information. In International Joint Conference on Artificial Intelligence, Vol. 16, pp. 926–931.
- Osgood et al. Osgood, C. E., Suci, G. J., and Tannenbaum, P. H. (1957). The measurement of meaning. University of Illinois Press.
- Peroni and Shotton Peroni, S., and Shotton, D. (2012). FaBiO and CiTO: Ontologies for describing bibliographic resources and citations. Web Semantics: Science, Services and Agents on the World Wide Web, 17(0), 33–43.
- Pham and Hoffmann Pham, S., and Hoffmann, A. (2003). A new approach for scientific citation classification using cue phrases. In Tamás Domonkos Gedeon, L. C. C. F. (Ed.), AI 2003: Advances in Artificial Intelligence, Vol. 2903 of Lecture Notes in Computer Science, pp. 759–771. Springer Berlin Heidelberg.
- Pinski and Narin Pinski, G., and Narin, F. (1976). Citation influence for journal aggregates of scientific publications: Theory, with application to the literature of physics. Information Processing & Management, 12(5), 297–312.
- Porter Porter, M. (1980). An algorithm for suffix stripping. Program, 14, 130–137.
- Qazvinian and Radev Qazvinian, V., and Radev, D. R. (2008). Scientific paper summarization using citation summary networks. In Proceedings of the 22nd International Conference on Computational Linguistics - Volume 1, COLING ’08, pp. 689–696, Stroudsburg, PA, USA. Association for Computational Linguistics.
- Qazvinian and Radev Qazvinian, V., and Radev, D. R. (2010). Identifying non-explicit citing sentences for citation-based summarization. In Proceedings of the 48th Annual Meeting of the Association for Computational Linguistics, ACL ’10, pp. 555–564, Stroudsburg, PA, USA. Association for Computational Linguistics.
- Qi et al. Qi, X., Nie, L., and Davison, B. D. (2007). Measuring similarity to detect qualified links. In Proceedings of the 3rd international workshop on Adversarial information retrieval on the web, AIRWeb ’07, pp. 49–56, New York, NY, USA. ACM.
- Radev et al. Radev, D. R., Muthukrishnan, P., and Qazvinian, V. (2009). The ACL Anthology Network corpus. In Proceedings of the 2009 Workshop on Text and Citation Analysis for Scholarly Digital Libraries, NLPIR4DL ’09, pp. 54–61, Stroudsburg, PA, USA. Association for Computational Linguistics.
- Ritchie et al. Ritchie, A., Robertson, S., and Teufel, S. (2008). Comparing citation contexts for information retrieval. In Proceedings of the 17th ACM conference on Information and knowledge management, CIKM ’08, pp. 213–222, New York, NY, USA. ACM.
- Rokach et al. Rokach, L., Kalech, M., Blank, I., and Stern, R. (2011). Who is going to win the next association for the advancement of artificial intelligence fellowship award? evaluating researchers by mining bibliographic data. Journal of the American Society for Information Science and Technology, 62(12), 2456–2470.
- Schreiber Schreiber, M. (2008). To share the fame in a fair way, modifies for multi-authored manuscripts. New Journal of Physics, 10(4), 040201.
- Shotton Shotton, D. (2010). CiTO, the Citation Typing Ontology. Journal of biomedical semantics, 1(Suppl 1), S6.
- Simkin and Roychowdhury Simkin, M. V., and Roychowdhury, V. P. (2003). Read before you cite!. Complex Systems, 14(3), 269–274.
- Small Small, H. (1982). Citation context analysis. Progress in communication sciences, 3, 287–310.
- Soon et al. Soon, W. M., Ng, H. T., and Lim, D. C. Y. (2001). A machine learning approach to coreference resolution of noun phrases. Computational linguistics, 27(4), 521–544.
- Stone et al. Stone, P. J., Dunphy, D. C., and Smith, M. S. (1966). The general inquirer: a computer approach to content analysis. MIT Press, Cambridge.
- Taheriyan Taheriyan, M. (2011). Subject classification of research papers based on interrelationships analysis. In Proceedings of the 2011 workshop on Knowledge discovery, modeling and simulation, KDMS ’11, pp. 39–44, New York, NY, USA. ACM.
- Teufel et al. Teufel, S., Siddharthan, A., and Tidhar, D. (2006). Automatic classification of citation function. In Proceedings of the 2006 Conference on Empirical Methods in Natural Language Processing, EMNLP ’06, pp. 103–110, Stroudsburg, PA, USA. Association for Computational Linguistics.
- Turney Turney, P. D. (1993). Robust classification with context-sensitive features. In Proceedings of the Sixth International Conference on Industrial and Engineering Applications of Artificial Intelligence and Expert Systems, pp. 268–276.
- Turney Turney, P. D. (1996). The management of context-sensitive features: A review of strategies. In Proceedings of Workshop on Learning in Context-Sensitive Domains at the 13th International Conference on Machine Learning (ICML96), pp. 60–66.
- Turney and Littman Turney, P. D., and Littman, M. L. (2003). Measuring praise and criticism: Inference of semantic orientation from association. ACM Transactions on Information Systems, 21(4), 315–346.
- Turney and Pantel Turney, P. D., and Pantel, P. (2010). From frequency to meaning: Vector space models of semantics. Journal of Artificial Intelligence Research, 37, 141–188.
- Vanclay Vanclay, J. K. (2013). Factors affecting citation rates in environmental science. Journal of Informetrics, 7(2), 265–271.
- Vellino Vellino, A. (2010). A comparison between usage-based and citation-based methods for recommending scholarly research articles. Proceedings of the American Society for Information Science and Technology, 47(1), 1–2.
- Waltman and van Eck Waltman, L., and van Eck, N. J. (2012). The inconsistency of the -index. Journal of the American Society for Information Science and Technology, 63(2), 406–415.
- Wilhite and Fong Wilhite, A. W., and Fong, E. A. (2012). Coercive citation in academic publishing. Science, 335(6068), 542–543.
- Witten et al. Witten, I. H., Frank, E., and Hall, M. A. (2011). Data Mining: Practical Machine Learning Tools and Techniques. Morgan Kaufmann, Burlington.
- Yan and Ding Yan, E., and Ding, Y. (2010). Weighted citation: An indicator of an article’s prestige. Journal of the American Society for Information Science and Technology, 61(8), 1635–1643.
- Zitt and Small Zitt, M., and Small, H. (2008). Modifying the journal impact factor by fractional citation weighting: The audience factor. Journal of the American Society for Information Science and Technology, 59(11), 1856–1860.