Spin-Polarized Quantum Well States on Bi2-xFexSe3
Abstract
Low temperature scanning tunneling microscopy is used to image the doped topological insulator FexBi2-xSe3. Interstitial Fe defects allow the detection of quasiparticle interference (QPI), and the reconstruction of the empty state band structure. Quantitative comparison between measured data and density functional theory calculations reveals the unexpected coexistence of quantum well states (QWS) with topological surface states (TSS) on the atomically clean surface of FexBi2-xSe3. Spectroscopic measurements quantify the breakdown of linear dispersion due to hexagonal warping. Nonetheless, both QWS and TSS remain spin-polarized and protected from backscattering to almost 1 eV above the Dirac point, suggesting their utility for spin-based applications.
pacs:
68.37.Ef, 71.20.-b, 73.20.At, 71.15.MbTopological insulators (TIs), recently discovered materials with insulating bulk and topologically protected helical Dirac surface states, have generated widespread excitement due to proposed applications such as dissipationless spintronics, ambipolar transistors, and fault-tolerant quantum computers Hasan and Kane (2010); Qi and Zhang (2011); Ando (2013). Many of these applications hinge on the predicted ability to preserve spin information without backscattering. Bi2Se3 has attracted particular attention due to the accessibility of its Dirac point within a relatively large 300 meV bulk band gap Hsieh et al. (2009), and the availability of additional quantum well surface states Bianchi et al. (2010); Wray et al. (2010); Benia et al. (2011); Zhu et al. (2011); Bianchi et al. (2011); Ye et al. (2011); Chen et al. (2012); Valla et al. (2012); Roy et al. (2014) which may be spin-polarized by a large Rashba effect King et al. (2011); Bahramy et al. (2012). However, spin-polarized quantum well states (QWS) depend sensitively on adsorbents, and have not been observed on clean surfaces. More generally, little is known about the empty state band structure of Bi2Se3, which is inaccessible to angle-resolved photoemission spectroscopy (ARPES). For both topological surface states (TSS) and QWS, it remains crucial to characterize the high energy extent to which they remain linearly dispersing, spin-polarized, and protected against surface-bulk scattering Park et al. (2010); Kim et al. (2011) and backscattering Lee et al. (2009).
Scanning tunneling microscopy (STM) can provide real space images of both filled and empty states and their local relationship to surface and near-surface impurities. STM also provides access to momentum space information via quasiparticle interference (QPI) imaging. When quasiparticle states of energy scatter elastically from impurities, the interference between initial and final quasiparticle wavevectors and can result in a standing wave pattern with wavevector at energy . The observed dispersion of , and the inversion of to find , has established QPI as a reliable -space probe Crommie et al. (1993). Indeed, QPI imaging has been used to demonstrate the protection against backscattering Zhang et al. (2009); Alpichshev et al. (2010) and the high energy breakdown of linear dispersion in pristine Bi2Te3 Sessi et al. (2013), as well as the onset of backscattering in FexBi2-xTe3 Okada et al. (2011). However, dispersing QPI in Bi2Se3 has been elusive Hanaguri et al. (2010); Kim et al. (2011); Alpichshev et al. (2012), appearing only in a limited energy range with inconsistent velocity Wang et al. (2011); Beidenkopf et al. (2011); Zhang et al. (2013). Therefore, the high energy band structure and scattering mechanisms of Bi2Se3 are unknown.
Here we address these issues using STM measurements of bulk FexBi2-xSe3, coupled with density functional theory (DFT). Previous experiments focused on the magnetic properties of bulk Fe dopants via transport Cha et al. (2010), ARPES Chen et al. (2010), or SR and magnetization measurements Salman et al. (2012); or adsorbed Fe Wray et al. (2010); Scholz et al. (2012); Schlenk et al. (2013); Honolka et al. (2012); or Fe dopants in thin films Song et al. (2012). In this first STM study of bulk FexBi2-xSe3, we report multiple dispersing QPI modes, which give the first access to the full high energy band structure, up to 1 eV above the Dirac point. Furthermore, we provide the first real space evidence for the coexistence of QWS and TSS on the pristine surface of a bulk material. Finally, we demonstrate the absence of backscattering of the QWS, and we report the relationship of scattering between TSS, QWS, and bulk. All of these observations are enabled by interstitial Fe in the van der Waals (vdW) gap between adjacent Bi2Se3 quintuple layers (QLs).
We studied FexBi2-xSe3 single crystals with nominal Eto et al. (2010) and 0.07 Salman et al. (2012). Samples were cleaved in vacuum at K and immediately inserted into our home-built STM at 4 K. Topographic images were obtained in constant current mode () at a fixed sample bias (). Differential conductance , proportional to the local density of states, was measured at a fixed tip-sample distance using a standard lockin technique. Theoretical calculations were performed using the linearized augmented-plane-wave method in the WIEN2K packages Blaha et al. (2001) and an ab initio DFT slab method Zhu et al. (2013).
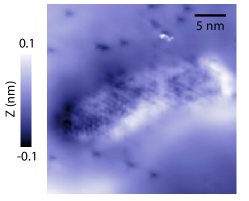
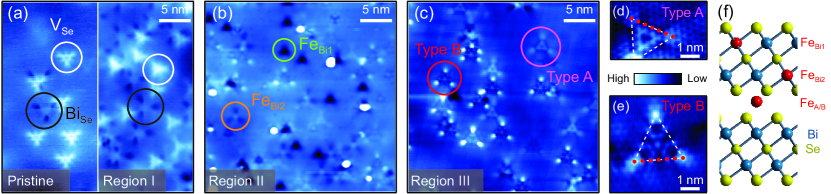
Topographic images of flat terraces of FexBi2-xSe3 reveal multiple species of three-fold symmetric defects, segregated into three distinct micron-scale regions, and typified in Figs. 1(a-c). Region I is dominated by the same Se vacancies and BiSe antisite defects seen in “pristine” Bi2Se3 Urazhdin et al. (2002); Hor et al. (2009). Region II is dominated by Fe substitutions in the top two Bi layers, FeBi1 and FeBi2 Song et al. (2012). Region III is dominated by two larger defects, detailed in Figs. 1(d-e). The first (“type-A”), centered between topmost Se atoms, was identified as an interstitial Fe Song et al. (2012). The second (“type-B”), centered on a topmost Se atom, has not been previously observed. Based on their vertex-to-vertex distance of nm, and the assumption that their perturbations propagate primarily along the chains extending out and upwards to the surface Urazhdin et al. (2002), we conclude that both defects in region III are Fe interstitials at inequivalent sites within the vdW gap beneath the top QL. The density of atomic Fe defects in regions II and III is lower than the nominal doping by a factor of , but occasional Fe clusters do appear Sup .
The low Fe concentration is consistent with the small size of Fe3+ compared to Bi3+, which makes it difficult to dope Zhang et al. (2012). The spatial separation of distinct impurities can be understood from calculations showing that Fe substitution in Bi2Se3 is allowed only in Se-rich conditions Zhang et al. (2012); Abdalla et al. (2013), which also inhibit the formation of Se vacancies West et al. (2012); Wang et al. . On the other hand, Fe interstitials are not energetically favored under any Bi/Se ratio. Such interstitials may appear due to kinetic constraint where the local growth temperature is too low for Fe to overcome the energy barrier to substitute for Bi Zhang et al. (2012).
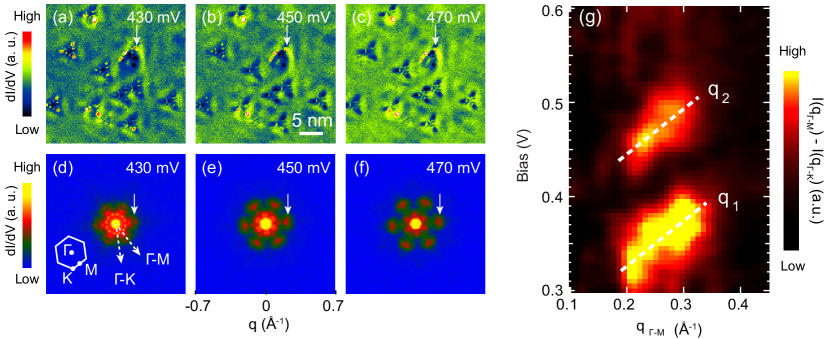
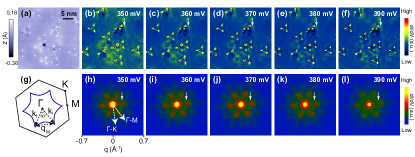
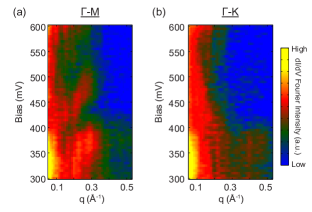
We now focus on the electronic structure in region III. The maps in Figs. 2(a-c) display clear QPI patterns, particularly around the new type-B interstitials. The QPI has three remarkable features. First, the scattering modes appear at unexpected high energy levels, almost 1 eV above the Dirac point. At such high energies the band structure of Bi2Se3 was expected to consist of bulk continuum states and was not expected to have a well-defined TSS Zhang et al. (2009); Eremeev et al. (2010). Second, the Fourier transform maps in Figs. 2(d-f) show no dispersing - modes, but two - modes ( and ) which disperse with similar slope but 0.1 eV relative offset. To better isolate the dispersing - modes from the long-wavelength dopant disorder (presumed to be isotropic), we plot as a function of bias voltage and wavevector in Fig. 2(g). Third, the - mode velocities, , are substantially smaller than the ARPES-measured TSS velocity near the Dirac point () Kuroda et al. (2010). Finally, we emphasize that QPI is observed only in region III.
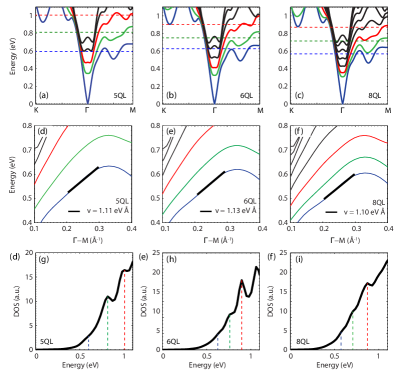
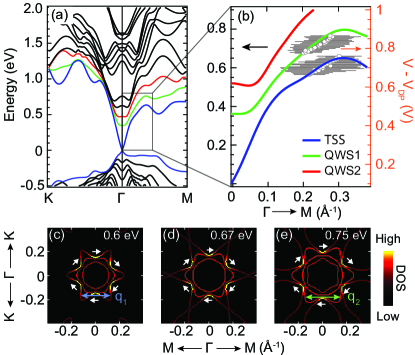
We argue that the parallel - scattering modes in Fig. 2(g) demonstrate a remarkable extension of both TSS and QWS, far above the energy range accessible to ARPES Bianchi et al. (2010); Wray et al. (2010); Benia et al. (2011); Zhu et al. (2011); Bianchi et al. (2011); Chen et al. (2012); Valla et al. (2012); Roy et al. (2014); King et al. (2011); Bahramy et al. (2012); Ye et al. (2011). To support this claim, Fig. 3(a) shows our calculated band structure in a 5QL slab, the minimal system which prevents interactions between top and bottom surfaces, but also supports QWS with depth comparable to fits of ARPES data Bianchi et al. (2010); Benia et al. (2011); King et al. (2011) and the independently measured bulk screening length Löptien et al. (2014). (We also checked that the calculated band velocity here is a robust feature, nearly independent of the slab thickness Sup .) Constant energy contours (CECs) in Figs. 3(c-e) show the hexagonal warping Fu (2009) which emerges at high energy in both TSS and QWS, along with the expected spin texture of these states Bahramy et al. (2012). Similar to previous studies on Bi2Te3 Zhang et al. (2009); Alpichshev et al. (2010); Sessi et al. (2013), scattering in Bi2Se3 is expected to depend on the warping of the CECs, with a dominant mode emerging between two adjacent -oriented corners of the hexagram (denoted by ). Because these corners are separated by an angle of , the velocity of should well approximate the band velocity along the - direction: Sup . Furthermore, the warping of TSS and QWS in Figs. 3(c-e) evolves similarly, but shifted in energy, akin to the parallel scattering modes observed in Fig. 2(g). Indeed, Fig. 3(b) shows excellent quantitative agreement between our STM scattering data and DFT calculations, confirming that and modes arise from scattering between adjacent -oriented corners of the CECs of the TSS and QWS1, respectively.
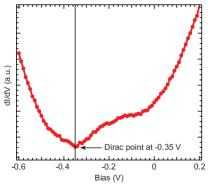
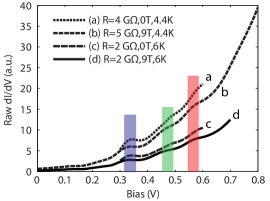
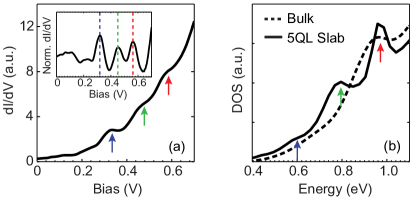
Spectroscopic evidence further supports the presence of QWS. In Fig. 4(a), the spatially averaged spectrum from region III shows three distinct kinks over the same energy range as the observed QPI. These kinks are qualitatively well reproduced in Fig. 4(b), which shows the momentum-integrated density of states from the DFT band structure in Fig. 3(a). By comparison with Fig. 3(a), we see that the three kinks in the DOS occur near the three energies where the linear dispersions of the TSS, QWS1, and QWS2 bands break down.
Despite the breakdown of linear dispersion and the onset of bulk bands, both TSS and QWS remain unexpectedly robust against backscattering and surface-bulk scattering. We observe no dispersing - modes throughout the measured energy range, which rules out backscattering and indicates the spin polarization of the bands to almost 1 eV above the Dirac point. We observe one weak, non-dispersing - mode around meV above Sup . Previous studies ascribed non-dispersing QPI modes to surface-bulk scattering in Bi2Se3 Kim et al. (2011). However, our observed wavevector corresponds very nearly to the distance from the bright center to the lobes of the type-B interstitial Fe defects, which is determined simply by the bond geometry of the impurity Urazhdin et al. (2002). We therefore find no evidence of backscattering or surface-bulk scattering deteriorating the TSS or the QWS at high energy in Bi2Se3.
Finally, we comment on the origin of QWS. Previously observed QWS in Bi2Se3 were believed to arise from band bending due to charged adsorbents Benia et al. (2011); Zhu et al. (2011); Bianchi et al. (2011); King et al. (2011); Bahramy et al. (2012), or vdW gap expansion due to burrowing adsorbents Ye et al. (2011); Eremeev et al. (2012). Here we have reported the first evidence of QWS at the clean surface of a bulk crystal. Fe interstitials may induce QWS at the clean surface of bulk FexBi2-xSe3 by two mechanisms: (1) their ionization to Fe3+ would donate three electrons to induce downward band bending Song et al. (2012); (2) their cores would physically expand the vdW gap. Either mechanism supposes vertical dopant inhomogeneity, in keeping with the lateral inhomogeneity demonstrated in Fig. 1. (The tip itself can’t be responsible for the the observed QWS, because the tip’s positive bias can’t cause the downward band bending required to induce QWS in the bulk conduction band.)
In conclusion, our STM/STS study of FexBi2-xSe3 provides fundamental new information about the empty state band structure of Bi2Se3. Scattering from a previously unobserved interstitial Fe defect allowed QPI imaging and band structure reconstruction up to 1 eV above the Dirac point, from which we draw three main conclusions. First, quantitative comparison between our QPI data and DFT calculations proves the unexpected appearance of QWS, coexisting with TSS, at the clean surface of a bulk material. These well-defined surface states persist to almost 1 eV above the Dirac point, overlapping by eV with the bulk conduction band, but showing no evidence of backscattering. Second, distinctive kinks in spectra reveal the breakdown of linear dispersion for TSS and the first two QWS. The new high-energy velocity is smaller than the velocity near the Dirac point, and is consistent with our DFT calculations. Third, the absence of dispersing - scattering demonstrates the protection of both TSS and QWS against backscattering, well beyond the breakdown of linear dispersion, even in the presence of sparse Fe dopants. Our results suggest that interstitial defects in the vdW gap of Bi2Se3 can lead to the coexistence of protected spin-polarized QWS and TSS over a wide energy range, far outside the bulk band gap. These discoveries bode well for the controlled use of spins in future devices.
Acknowledgements.
We benefited from computational resources provided by Ilya Elfimov. This research was supported by the US National Sciences Foundation under grant DMR-110623. M.M.Y. was supported by an NSERC PGS-D fellowship, Z.H.Z. was supported by an NSERC PDF fellowship, A.S. was supported by A*STAR, Y.H. was supported by the New York Community Trust - George Merck fund, and C.L.S. was supported by the Lawrence Golub fellowship at Harvard University. Work at Osaka University was supported by JSPS (KAKENHI 25220708) and AFOSR (AOARD 124038).References
- Hasan and Kane (2010) M. Z. Hasan and C. Kane, Rev. Mod. Phys. 82, 3045 (2010).
- Qi and Zhang (2011) X.-L. Qi and S.-C. Zhang, Rev. Mod. Phys. 83, 1057 (2011).
- Ando (2013) Y. Ando, J. Phys. Soc. Jpn. 82, 102001 (2013).
- Hsieh et al. (2009) D. Hsieh, Y. Xia, D. Qian, L. Wray, J. H. Dil, F. Meier, J. Osterwalder, L. Patthey, J. G. Checkelsky, N. P. Ong, A. V. Fedorov, H. Lin, A. Bansil, D. Grauer, Y. S. Hor, R. J. Cava, and M. Z. Hasan, Nature 460, 1101 (2009).
- Bianchi et al. (2010) M. Bianchi, D. Guan, S. Bao, J. Mi, B. B. Iversen, P. D. C. King, and P. Hofmann, Nat. Commun. 1, 128 (2010).
- Wray et al. (2010) L. A. Wray, S.-Y. Xu, Y. Xia, D. Hsieh, A. V. Fedorov, Y. S. Hor, R. J. Cava, A. Bansil, H. Lin, and M. Z. Hasan, Nat. Phys. 7, 32 (2010).
- Benia et al. (2011) H. M. Benia, C. Lin, K. Kern, and C. R. Ast, Phys. Rev. Lett. 107, 177602 (2011).
- Zhu et al. (2011) Z.-H. Zhu, G. Levy, B. Ludbrook, C. N. Veenstra, J. A. Rosen, R. Comin, D. Wong, P. Dosanjh, A. Ubaldini, P. Syers, N. P. Butch, J. Paglione, I. S. Elfimov, and A. Damascelli, Phys. Rev. Lett. 107, 186405 (2011).
- Bianchi et al. (2011) M. Bianchi, R. C. Hatch, J. Mi, B. B. Iversen, and P. Hofmann, Phys. Rev. Lett. 107, 086802 (2011).
- Ye et al. (2011) M. Ye, S. V. Eremeev, K. Kuroda, M. Nakatake, S. Kim, Y. Yamada, E. E. Krasovskii, E. V. Chulkov, M. Arita, H. Miyahara, T. Maegawa, K. Okamoto, K. Miyamoto, T. Okuda, K. Shimada, H. Namatame, M. Taniguchi, Y. Ueda, and A. Kimura, Arxiv Preprint , 1112.5869 (2011), arXiv:1112.5869 .
- Chen et al. (2012) C. Chen, S. He, H. Weng, W. Zhang, L. Zhao, H. Liu, X. Jia, D. Mou, S. Liu, J. He, Y. Peng, Y. Feng, Z. Xie, G. Liu, X. Dong, J. Zhang, X. Wang, Q. Peng, Z. Wang, S. Zhang, F. Yang, C. Chen, Z. Xu, X. Dai, Z. Fang, and X. J. Zhou, Pro. Natl. Acad. Sci. USA 109, 3694 (2012).
- Valla et al. (2012) T. Valla, Z.-H. Pan, D. Gardner, Y. S. Lee, and S. Chu, Phys. Rev. Lett. 108, 117601 (2012).
- Roy et al. (2014) S. Roy, H. L. Meyerheim, A. Ernst, K. Mohseni, C. Tusche, M. G. Vergniory, T. V. Menshchikova, M. M. Otrokov, A. G. Ryabishchenkova, Z. S. Aliev, M. B. Babanly, K. A. Kokh, O. E. Tereshchenko, E. V. Chulkov, J. Schneider, and J. Kirschner, Phys. Rev. Lett. 113, 116802 (2014).
- King et al. (2011) P. D. C. King, R. C. Hatch, M. Bianchi, R. Ovsyannikov, C. Lupulescu, G. Landolt, B. Slomski, J. H. Dil, D. Guan, J. L. Mi, E. D. L. Rienks, J. Fink, A. Lindblad, S. Svensson, S. Bao, G. Balakrishnan, B. B. Iversen, J. Osterwalder, W. Eberhardt, F. Baumberger, and P. Hofmann, Phys. Rev. Lett. 107, 096802 (2011).
- Bahramy et al. (2012) M. S. Bahramy, P. D. C. King, A. de la Torre, J. Chang, M. Shi, L. Patthey, G. Balakrishnan, P. Hofmann, R. Arita, N. Nagaosa, and F. Baumberger, Nat. Commun. 3, 1159 (2012).
- Park et al. (2010) S. R. Park, W. S. Jung, C. Kim, D. J. Song, C. Kim, S. Kimura, K. D. Lee, and N. Hur, Phys. Rev. B 81, 041405 (2010).
- Kim et al. (2011) S. Kim, M. Ye, K. Kuroda, Y. Yamada, E. Krasovskii, E. Chulkov, K. Miyamoto, M. Nakatake, T. Okuda, Y. Ueda, K. Shimada, H. Namatame, M. Taniguchi, and A. Kimura, Phys. Rev. Lett. 107, 056803 (2011).
- Lee et al. (2009) W.-C. Lee, C. Wu, D. P. Arovas, and S.-C. Zhang, Phys. Rev. B 80, 245439 (2009).
- Crommie et al. (1993) M. F. Crommie, C. P. Lutz, and D. M. Eigler, Nature 363, 524 (1993).
- Zhang et al. (2009) T. Zhang, P. Cheng, X. Chen, J.-F. Jia, X. Ma, K. He, L. Wang, H. Zhang, X. Dai, Z. Fang, X. Xie, and Q.-K. Xue, Phys. Rev. Lett. 103, 266803 (2009).
- Alpichshev et al. (2010) Z. Alpichshev, J. G. Analytis, J.-H. Chu, I. R. Fisher, Y. L. Chen, Z. X. Shen, A. Fang, and A. Kapitulnik, Phys. Rev. Lett. 104, 016401 (2010).
- Sessi et al. (2013) P. Sessi, M. M. Otrokov, T. Bathon, M. G. Vergniory, S. S. Tsirkin, K. A. Kokh, O. E. Tereshchenko, E. V. Chulkov, and M. Bode, Phys. Rev. B 88, 161407 (2013).
- Okada et al. (2011) Y. Okada, C. Dhital, W. Zhou, E. Huemiller, H. Lin, S. Basak, A. Bansil, Y.-B. Huang, H. Ding, Z. Wang, S. Wilson, and V. Madhavan, Phys. Rev. Lett. 106, 206805 (2011).
- Hanaguri et al. (2010) T. Hanaguri, K. Igarashi, M. Kawamura, H. Takagi, and T. Sasagawa, Phys. Rev. B 82, 081305 (2010).
- Alpichshev et al. (2012) Z. Alpichshev, R. Biswas, A. Balatsky, J. Analytis, J.-H. Chu, I. Fisher, and A. Kapitulnik, Phys. Rev. Lett. 108, 206402 (2012).
- Wang et al. (2011) J. Wang, W. Li, P. Cheng, C. Song, T. Zhang, P. Deng, X. Chen, X. Ma, K. He, J.-F. Jia, Q.-K. Xue, and B.-F. Zhu, Phys. Rev. B 84, 235447 (2011).
- Beidenkopf et al. (2011) H. Beidenkopf, P. Roushan, J. Seo, L. Gorman, I. Drozdov, Y. S. Hor, R. J. Cava, and A. Yazdani, Nat. Phys. 7, 939 (2011).
- Zhang et al. (2013) T. Zhang, N. Levy, J. Ha, Y. Kuk, and J. A. Stroscio, Phys. Rev. B 87, 115410 (2013).
- Cha et al. (2010) J. J. Cha, J. R. Williams, D. Kong, S. Meister, H. Peng, A. J. Bestwick, P. Gallagher, D. Goldhaber-Gordon, and Y. Cui, Nano Letters 10, 1076 (2010).
- Chen et al. (2010) Y. L. Chen, J.-H. Chu, J. G. Analytis, Z. K. Liu, K. Igarashi, H.-H. Kuo, X. L. Qi, S. K. Mo, R. G. Moore, D. H. Lu, M. Hashimoto, T. Sasagawa, S. C. Zhang, I. R. Fisher, Z. Hussain, and Z. X. Shen, Science 329, 659 (2010).
- Salman et al. (2012) Z. Salman, E. Pomjakushina, V. Pomjakushin, A. Kanigel, K. Chashka, K. Conder, E. Morenzoni, T. Prokscha, K. Sedlak, and A. Suter, Arxiv Preprint , 1203.4850 (2012), arXiv:1203.4850 .
- Scholz et al. (2012) M. R. Scholz, J. Sánchez-Barriga, D. Marchenko, A. Varykhalov, A. Volykhov, L. V. Yashina, and O. Rader, Phys. Rev. Lett. 108, 256810 (2012).
- Schlenk et al. (2013) T. Schlenk, M. Bianchi, M. Koleini, A. Eich, O. Pietzsch, T. Wehling, T. Frauenheim, A. Balatsky, J.-L. Mi, B. Iversen, J. Wiebe, A. Khajetoorians, P. Hofmann, and R. Wiesendanger, Phys. Rev. Lett. 110, 126804 (2013).
- Honolka et al. (2012) J. Honolka, A. A. Khajetoorians, V. Sessi, T. O. Wehling, S. Stepanow, J.-L. Mi, B. B. Iversen, T. Schlenk, J. Wiebe, N. B. Brookes, A. I. Lichtenstein, P. Hofmann, K. Kern, and R. Wiesendanger, Phys. Rev. Lett. 108, 256811 (2012).
- Song et al. (2012) C.-L. Song, Y.-P. Jiang, Y.-L. Wang, Z. Li, L. Wang, K. He, X. Chen, X.-C. Ma, and Q.-K. Xue, Phys. Rev. B 86, 045441 (2012).
- Eto et al. (2010) K. Eto, Z. Ren, A. A. Taskin, K. Segawa, and Y. Ando, Phys. Rev. B 81, 195309 (2010).
- Blaha et al. (2001) P. Blaha, K. Schwarz, G. Madsen, D. Kvasnicka, and J. Luitz, in An augmented plane wave plus local orbitals program for calculating crystal properties, edited by K. Schwarz (Technical University of Wien, Vienna, 2001).
- Zhu et al. (2013) Z.-H. Zhu, C. N. Veenstra, G. Levy, A. Ubaldini, P. Syers, N. P. Butch, J. Paglione, M. W. Haverkort, I. S. Elfimov, and A. Damascelli, Phys. Rev. Lett. 110, 216401 (2013).
- Urazhdin et al. (2002) S. Urazhdin, D. Bilc, S. Tessmer, S. Mahanti, T. Kyratsi, and M. Kanatzidis, Phys. Rev. B 66, 161306 (2002).
- Hor et al. (2009) Y. Hor, A. Richardella, P. Roushan, Y. Xia, J. Checkelsky, A. Yazdani, M. Hasan, N. Ong, and R. Cava, Phys. Rev. B 79, 195208 (2009).
- (41) See Supplemental Material for more experimental data and DFT calculations with various slab thickness.
- Zhang et al. (2012) J.-M. Zhang, W. Zhu, Y. Zhang, D. Xiao, and Y. Yao, Phys. Rev. Lett. 109, 266405 (2012).
- Abdalla et al. (2013) L. B. Abdalla, L. Seixas, T. M. Schmidt, R. H. Miwa, and A. Fazzio, Phys. Rev. B 88, 045312 (2013).
- West et al. (2012) D. West, Y. Y. Sun, H. Wang, J. Bang, and S. B. Zhang, Phys. Rev. B 86, 121201 (2012).
- (45) L.-L. Wang, M. Huang, S. Thimmaiah, A. Alam, S. Bud’ko, A. Kaminski, T. Lograsso, P. Canfield, and D. Johnson, Phys. Rev. B , 125303.
- Eremeev et al. (2010) S. V. Eremeev, Y. M. Koroteev, and E. V. Chulkov, JETP Letters 91, 387 (2010).
- Kuroda et al. (2010) K. Kuroda, M. Arita, K. Miyamoto, M. Ye, J. Jiang, A. Kimura, E. Krasovskii, E. Chulkov, H. Iwasawa, T. Okuda, K. Shimada, Y. Ueda, H. Namatame, and M. Taniguchi, Phys. Rev. Lett. 105, 076802 (2010).
- Löptien et al. (2014) P. Löptien, L. Zhou, J. Wiebe, A. A. Khajetoorians, J. L. Mi, B. B. Iversen, P. Hofmann, and R. Wiesendanger, Phys. Rev. B 89, 085401 (2014).
- Fu (2009) L. Fu, Phys. Rev. Lett. 103, 266801 (2009).
- Eremeev et al. (2012) S. V. Eremeev, M. G. Vergniory, T. V. Menshchikova, A. A. Shaposhnikov, and E. V. Chulkov, New J. Phys. 14, 113030 (2012).
Supplementary Material for:
Spin-Polarized Quantum Well States on Bi2-xFexSe3
Michael M. Yee, Z. -H. Zhu, Anjan Soumyanarayanan, Yang He, Can-Li Song, Ekaterina Pomjakushina, Zaher Salman, Amit Kanigel, Kouji Segawa, Yoichi Ando, Jennifer E. Hoffman