Mass without radiation: Heavily obscured AGNs, the X–ray background, and the black hole mass density
A recent revision of black hole scaling relations indicate that the local mass density in black holes should be five times higher than previously determined values. The local black hole mass density is connected to the mean radiative efficiency of accretion through the time integral of the AGN volume density and a significant increase in the local black hole mass density would have interesting consequences on AGN accretion properties and demography. One possibility to explain a large black hole mass density is that most of the black hole growth is via radiatively inefficient channels such as super Eddington accretion; however, this solution is not unique. Here we show how it is possible to accommodate a larger fraction of heavily buried, Compton-thick AGNs, without violating the limit imposed by the spectral energy density of the hard X–ray and mid–infrared backgrounds.
Key Words.:
galaxies: active – galaxies: bulges – quasars: supermassive black holes – X–rays:diffuse background1 Introduction
The strong correlations between the masses of the central super massive black holes (SMBH) and the global properties of their host spheroids such as luminosities, dynamical masses and velocity dispersions, i.e. the scaling relations, can be used to convert the mass function of local galaxies into a black hole mass function and, by integration, into a local SMBH mass density .
A recent comprehensive analysis of black hole mass measurements and scaling relations concluded that the canonical black-hole-to-bulge mass ratio, , shows a mass dependence and varies from 0.1–0.2% at to % at (Graham & Scott 2013, Kormendy & Ho 2013). The revised normalization is a factor of 2 to 5 larger than previous estimates ranging from 0.10% (Merrit & Ferrarese 2001, McLure & Dunlop 2002, Sani et al. 2011) to 0.23% (Marconi & Hunt, 2003), therefore resulting in an overall increase in the normalization, which is dominated by massive bulges.
The mass function expected from black holes grown by accretion during active phases and the corresponding integral over the cosmic time , are closely related to the AGN luminosity function via a mass–to–luminosity conversion factor. The argument, originally proposed by Soltan (1982), can be formulated as a continuity equation for the mass density of black holes (e.g. Marconi et al. 2004; Shankar et al. 2004; Merloni & Heinz 2008). Assuming a constant radiative efficiency and neglecting mergers, the continuity equation can be integrated to obtain
| (1) |
where is the radiative efficiency, is the bolometric, comoving energy density of AGNs described by a bolometric luminosity function ,
| (2) |
The comoving energy density can be written as the product of the X–ray energy density times an average bolometric correction factor to convert the X–ray emissivity to bolometric emissivity (e.g. Lusso et al. 2012).
Equation 1 is widely used in AGN demographic studies to infer the efficiency of accretion processes by comparing the values obtained by the integration of the bolometric luminosity function with the local black hole mass density obtained from the scaling relations. A good match between and is achieved for an accretion efficiency consistent with that expected from a standard Shakura & Sunyaev (1973) accretion disk, broadly supporting the possibility that most of the SMBH mass is efficiently accreted over the Hubble time (e.g. Fabian & Iwasawa 1999). Using the X–ray background as an integral constraint and assuming that the bulk of the X–ray emissivity is at 2, Elvis et al. (2002) infer a lower limit on the accretion efficiency of 0.15, arguing that most SMBH are rapidly spinning.
Most recent estimates are in good agreement with 0.1. For instance, Marconi et al. (2004) used luminosity functions in the optical B-band (Boyle et al., 2000), soft X–ray, 0.5–2 keV band (Miyaji et al., 2000), and hard X–ray, 2–10 keV band (Ueda et al., 2003) transformed into a bolometric luminosity function using a luminosity dependent X–ray to optical spectral index (Vignali et al., 2003). The correction for the number of missed AGNs in hard X–ray surveys (i.e. Compton-thick) is obtained by requiring that the observed X–ray luminosity function matches the X–ray background spectrum. The resulting estimate of , assuming =0.1, is fully consistent with the local mass density = 4.6 Mpc-3. More recently, Ueda et al. (2014) published an updated version of the hard X–ray luminosity function, including an estimate of the Compton-thick population needed to fit the hard X–ray background spectrum. They reached similar conclusions on the average accretion efficiency using the Hopkins et al. (2007) bolometric corrections and the Vika et al. (2009) best fit value for = 4.9 Mpc-3.
The agreement of the two approaches described above is not surprising despite the different assumptions of the luminosity functions and bolometric corrections. In fact, both are linked to reproduce the hard X–ray background, which can be considered an integral constraint on the total mass accreted over the cosmic time and locked in SMBH. The almost identical values of the assumed local density () thus lead to very similar conclusions on the average accretion efficiency.
At face value, and keeping all the factors entering in Eq. 1 fixed at the fiducial values described above, a higher value of the integral local mass density would lead to a similarly lower value for the average radiative efficiency. The possibility that radiatively inefficient accretion processes may be more common than previously thought has been put forward by Novak (2013). His argument is based on a simple linear scaling of the commonly accepted value for the accretion efficiency (0.1) by a factor of 5, the maximum discrepancy between the revised estimate (Graham & Scott 2013, Kormendy & Ho 2013) and previous values. Radiatively inefficient processes (i.e. slim accretion disks) are advocated to explain the fast growth of SMBH in the early Universe (e.g. Madau et al. 2014).
The revised estimate of the local mass density of SMBH may have important consequences for AGN demography and accretion physics. In the following we discuss the impact of an increased fraction of heavily obscured SMBH with respect to current observational constraints.
2 A large population of deeply buried SMBH?
The contribution to the SMBH mass density of unobscured and obscured AGNs and the degeneracies intrinsic to the comparison between and , are manifest if equation 1 is written as
| (3) |
where is the X–ray energy density of unobscured AGNs, as determined from the soft X–ray luminosity function (e.g. Hasinger et al. 2005), while is the average bolometric correction which is assumed to be the same for obscured and unobscured AGNs (e.g. Lusso et al. 2012). The sum is over the ratios to unobscured AGNs of the obscured population contributing to the SMBH mass density and the X–ray background:
| (4) |
In the following we refer to the Marconi et al. (2006) calculations, which are based on the Gilli, Comastri & Hasinger (2007, GCH07) AGN synthesis model where the population of Compton-thick (CT) AGNs is split into mildly CT (MCT) when the optical depth for Compton scattering is of the order of a few, and heavily CT (HCT), or reflection-dominated, when . The former provide the largest contribution to the XRB (X–ray background) spectrum at 20–30 keV, while the contribution of the latter depends mainly on the fraction of the reprocessed radiation reflected or scattered towards the observer which, in turn, depends on the geometry of the absorber. In GCH07 the value in the 2–10 keV band is assumed to be 0.02, in broad agreement with the observations of Compton-thick AGNs in the local Universe (see Fig. 1 in GCH07). Moreover, the ratio between Compton-thin and unobscured sources is luminosity dependent and smoothly decreases from at low luminosities (log) to at high luminosities (log). The luminosity dependent obscured fraction is assumed to be the same for both Compton-thin and Compton-thick objects. As a result, the total (thin plus thick) obscured-to-unobscured ratio decreases from 8:1 at low luminosities to 2:1 at high luminosities. The luminosity averaged ratio is approximately 3 which means that for each unobscured AGN there are three Compton-thin and three Compton-thick sources (1.5 MCT and 1.5 HCT) and thus =6. An excellent match between and , satisfying the XRB constraints, is found for 0.1 (Marconi et al., 2006).
We consider the most conservative case of a local mass density which is a factor of 2 higher than previously considered. The revised value (Graham & Scott 2013, Kormendy & Ho 2013) is almost exactly a factor of 2 higher than that obtained by Marconi et al. (2004) and Vika et al. (2009). We also assume that the additional mass density is not due to a lower efficiency, but to a new population described by the same global parameters (cosmological evolution, bolometric correction, and radiative efficiency) of the known AGNs responsible for the XRB. If this were the case, equation 3 becomes
| (5) |
where is the contribution of the new population responsible for the local mass density excess. It is straightforward to show that
| (6) |
implying that the contribution to the mass density of the new population is the same as that already contributing to the XRB. It goes without saying that the new population would vastly exceed the limits imposed by the XRB itself, unless the sources are so extremely obscured that X–rays are almost completely suppressed. In other words, the upward revised normalization can be matched if each SMBH contributing to the XRB, has an X–ray quiet counterpart that adds mass, but almost no X–ray radiation.
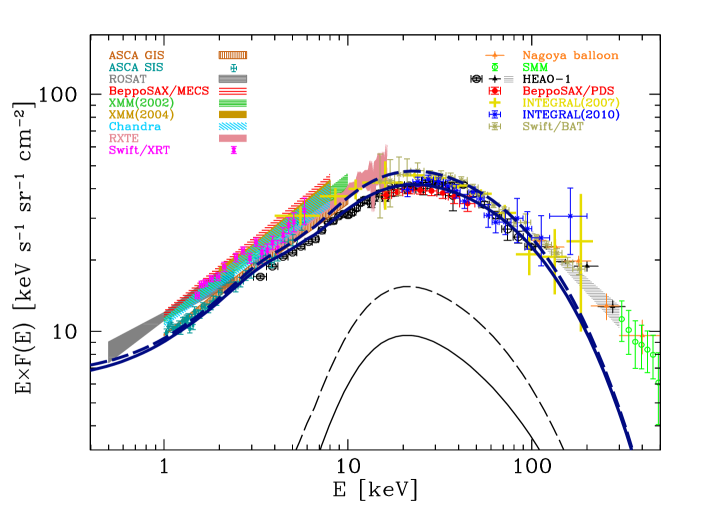
This figure could be mitigated noting that the present uncertainties on the XRB spectral intensity at 20–30 keV are such that it would be possible to accommodate additional sources with the same spectrum of HCT in GCH07. More specifically, if the reflection-dominated sources are four times more numerous than in GCH07 (Fig. 1), the predicted XRB flux at 20–30 keV would still be consistent with the data, within the measurement errors. If this were the case the size of the X–ray quiet population would be reduced to = 2.5. This new value is derived by the equality
| (7) |
we note that is 1.5. In this scenario, only about 18% of the SMBH population would be X–ray quiet, but having significantly increased the fraction of HCT sources in the GCH07 model, the fraction of deeply buried AGN (HCT plus X–ray quiet) would be about 60% of the total SMBH population.
We can relax the GCH07 assumption of the reflection yield (), and assume that both the GCH07 model HCT sources and the new population are described by a heavily obscured, reflection-dominated spectrum, with the same value of the reflection yield in the 2–10 keV band. In this case the new values of the yield of reflection-dominated sources are obtained from
| (8) |
where =1.5 is the fraction assumed in GCH07. With these assumptions, we obtain =0.0035 and =0.014 for =7 or =2.5, depending on the assumed level of the XRB.
3 Discussion
A large population of heavily obscured, reflection-dominated AGNs is considered here to fill the mass gap between the most recent estimate of and previous values. In order to accommodate a significantly higher number of SMBH without violating the limit imposed by the X–ray background, the hypothetical new population should be characterized by an extremely faint, almost vanishing, X–ray emission.
The suppression of the hard X–ray emission (up to a few hundred keV) would require both extremely high column densities ( 10) and large covering factors (approaching ). The detection and the measure of column densities in the high regime ( cm-2 or even more) is extremely challenging. Large covering factors of the obscuring gas, with reflection yields much lower than 1%, are invoked to explain the observations of a few heavily obscured and Compton-thick AGNs observed with Suzaku (e.g. Ueda et al. 2007; Comastri et al. 2010). There is also tentative evidence for a larger covering factor for increasing absorption among Chandra Deep Field South faint sources (Brightman et al., 2014). The upper limits on the 2–10 keV X–ray emission of a small sample of luminous AGNs, hosted by nearby ULIRGS (Nardini & Risaliti, 2011), are so tight that the corresponding upper limits on are of the order of . If the presence of these AGNs is widespread among infrared galaxies, they could be excellent candidates for the new population.
At face value, a population of reflection-dominated Compton-thick AGNs, with a suitable combination of covering factor and column density, would still be consistent with the upper envelope of present uncertainties of the hard XRB spectrum.
While the new population could have so far escaped direct detection in present deep, soft ( 10 keV) X–ray surveys, and would remain largely undetected in shallow NuSTAR hard X–ray surveys (Alexander et al., 2013), the reprocessed AGN luminosity will emerge in the infrared. A first order, integral estimate may be obtained using the hard XRB spectral intensity as a limit of the total energy output combined with suitable bolometric corrections (e.g. Fabian & Iwasawa 1999, Risaliti et al. 2002). The results indicate that the AGNs responsible for the XRB make 10–15% of the IR background around its 100m peak. Their contribution increases at shorter wavelengths, being of the order of 20–40% at 60m and possibly higher at 15m depending on the dust effective temperature (Risaliti et al., 2002) and the relative fraction of Compton-thick sources in the adopted XRB model. The impact of the new population of heavily Compton-thick AGNs hypothesized here is even more uncertain. In the most naive approximation, the above estimates should be rescaled by a factor of 2 making the AGN contribution dominant at short wavelengths ( 20 m). However, according to a recent, comprehensive population synthesis model of the X–ray and infrared backgrounds (Shi et al., 2013), the contribution of the X–ray emitting AGNs to the 100m background is negligible and is of the order of 15% at 5–10m. If this were the case, there would be plenty of room to fit a large population of heavily obscured SMBH without exceeding the limits imposed by the IR background.
Observational constraints on the abundance of sources likely to harbor a deeply buried new AGN may be obtained by mid-infrared photometric and spectroscopic surveys carried out with the Spitzer Space Telescope. Highly obscured and Compton-thick AGNs are likely to be affected by heavy dust absorption and steep mid-infrared to optical slopes. A widely adopted selection method is based on the optical to 24m color (e.g. Fiore et al. 2009). The optical depth of the silicate absorption feature at 9.7m is also considered a reliable tracer of heavy dust absorption. Good quality, mid-infrared spectra were obtained for local luminous infrared galaxies in the GOALS survey (Stierwalt et al., 2013) and 0.7 COSMOS galaxies (Fu et al., 2010). The fraction of optically thick (1) galaxies, which are likely to host a buried AGN on the basis of SED decomposition, is estimated to be of the order of 10% or even lower. However, it should be noted that current mid-infrared photometric and spectroscopic surveys are relatively shallow and, moreover, there are many Compton-thick AGNs that do not display strong silicate absorption features (e.g. Georgantopoulos et al. 2011). Given the present uncertainties and the difficulty of distinguishing the hypothetical population of deeply buried sources from normal and star-forming galaxies, we conclude that the new population, is unlikely to exceed the IR background spectral intensity. Candidates of the new population may be found among sources with a steeply rising SED from the near- to the far-infrared and/or among those with the highest extinction in the silicate absorption feature at 9.7m.
4 Conclusions
We put forward the possibility that a sizeable population of hitherto uncovered ultra obscured AGNs would explain the revised upward value of the SMBH local mass density .
We are aware of the strong degeneracies between the various parameters used to build our argument and, in particular, the radiative efficiency . Within the reasonable assumptions that the evolution of the X–ray luminosity function and bolometric corrections are robustly constrained by recent surveys, and the spectral intensity of the X–ray background and the accretion processes are self similar and not evolving, a large number of deeply buried SMBH may be a viable solution beyond, radiatively inefficient accretion, for example.
This would imply that the column density distribution of nuclear obscuring gas in SMBH is top heavy and skewed towards values of the order of cm-2 or even higher and the covering fraction of obscuring material may approach . Finding observational proof of the existence of these ultra-obscured SMBH is challenging. Deep mid-far-infrared photometric and spectroscopic surveys, matched with sensitive X–ray surveys would be needed to estimate the fraction of infrared emitting AGNs without an X–ray counterpart and thus presumably heavily buried. High density gas illuminated by a hidden nuclear source may be traced by molecular transitions observable in the far-IR with ALMA (Imanishi & Nakanishi, 2014). A fraction of them could be found among the sources responsible for the unresolved XRB in the 6–8 keV band (Xue et al., 2012). We are hopeful that a few examples will be uncovered by forthcoming deep hard X–ray surveys with NuSTAR (Harrison et al., 2013) and ultra-deep ATHENA surveys.
Acknowledgements.
This work was partially supported by the ASI/INAF I/037/12/0–011/13, the PRIN–INAF–2011 and the PRIN–INAF–2012 grants. We thank Marcella Brusa, Marco Mignoli and Gianni Zamorani for useful discussions, and the anonymous referee for constructive comments. AC acknowledges the support of a Caltech Kingsley visitor fellowship.References
- Ajello et al. (2008) Ajello, M., Greiner, J., Sato, G., et al. 2008, ApJ, 689, 666
- Alexander et al. (2013) Alexander, D.M.; Stern, D., Del Moro, A., et al. 2013, ApJ, 773, 125
- Boyle et al. (2000) Boyle, B.J., Shanks, T., Croom, S.M., et al. 2000, MNRAS, 317, 1014
- Brightman et al. (2014) Brightman, M., Nandra, K., Salvato, M., et al. 2014, MNRAS, 443, 1999
- Churazov et al. (2007) Churazov, E., Sunyaev, R., Revnivtsev, M., et al. 2007, A&A, 467, 529
- Comastri et al. (2010) Comastri, A., Iwasawa, K., Gilli, R., et al. 2010, ApJ, 717, 787
- De Luca & Molendi (2004) De Luca, A., Molendi, S. 2004, A&A, 419, 837
- Elvis et al. (2002) Elvis M., Risaliti, G., Zamorani, G. 2002, ApJ, 565, L75
- Fabian & Iwasawa (1999) Fabian A.C., Iwasawa, K. 1999, MNRAS, 303, L34
- Fiore et al. (2009) Fiore F., et al. 2009, ApJ, 693, 447
- Frontera et al. (2007) Frontera, F., Orlandini, M., Landi, R., et al. 2007, ApJ, 666, 86
- Fu et al. (2010) Fu, H., Lin, Y., Scoville, N.Z., et al. 2010, ApJ, 722, 653
- Fukada et al. (1975) Fukada, Y., Hayakawa, S., Kasahara, I., et al. 1975, Nature, 254, 398
- Gendreau et al. (1995) Gendreau, K.C., Mushotzky, R.F., Fabian, A.C., et al. 1995, PASJ, 47, L5
- Georgantopoulos et al. (1996) Georgantopoulos, I., Stewart, G.C., Shanks, et al. 1996, MNRAS, 280, 276
- Georgantopoulos et al. (2011) Georgantopoulos, I., et al. 2011, A&A, 531, A116
- Gilli et al. (2007) Gilli, R., Comastri, A., & Hasinger, G. 2007, A&A, 463, 79 GCH07
- Graham & Scott (2013) Graham, A.W., Scott, N. 2013, ApJ, 764, 151
- Gruber et al. (1999) Gruber, D.E., Matteson, J.L., Peterson, L.E., Jung, G.V. 1999, ApJ, 520, 124
- Harrison et al. (2013) Harrison, F.A., et al. 2013, ApJ, 770, 103
- Hasinger et al. (2005) Hasinger, G., Miyaji, T., Schmidt, M. 2005, A&A, 441, 417
- Hopkins et al. (2007) Hopkins, P.F., Richards, G.T., Hernquist, L. 2007, ApJ, 654, 731
- Imanishi & Nakanishi (2014) Imanishi M., Nakanishi, K. 2014, AJ, 148, 9
- Kinzer et al. (1997) Kinzer, R.L., Jung, G.V., Gruber, D.E., et al. 1997, ApJ, 467, 361
- Kormendy & Ho (2013) Kormendy, J., Ho, L.C. 2013, ARA&A, 51, 511
- Kushino et al. (2002) Kushino, A., Ishisaki, Y., Morita, U., et al. 2002, PASJ, 54, 327
- Lumb et al. (2002) Lumb, D.H., Warwick, R.S., Page, M., De Luca, A. 2002, A&A, 389, 93
- Lusso et al. (2012) Lusso, E., Comastri, A., Simmons, B.D., et al. 2012, MNRAS, 425, 623
- Madau et al. (2014) Madau, P., Haardt, F., Dotti, M. 2014, ApJ, 784, L38
- Marconi & Hunt (2003) Marconi, A., Hunt L.K. 2003, ApJ, 589, L21
- Marconi et al. (2004) Marconi, A., Risaliti, G., Gilli, R., et al. 2004, MNRAS, 351, 169
- Marconi et al. (2006) Marconi, A., Comastri, A., Gilli, R., et al. 2006, Mem. S.A.It. 77, 742
- McLure & Dunlop (2002) McLure, R. J., Dunlop, J. S. 2002, MNRAS, 331, 795
- Merloni & Heinz (2008) Merloni, A., Heinz, S. 2008, MNRAS, 388, 1011
- Merrit & Ferrarese (2001) Merrit, D., Ferrarese, L. 2001, ApJ, 547, 140
- Miyaji et al. (2000) Miyaji, T. Hasinger, G., Schmidt, M. 2000, A&A, 353, 25
- Nardini & Risaliti (2011) Nardini, E., Risaliti, G. 2011, MNRAS, 415, 619
- Novak (2013) Novak, G.S. 2013, MNRAS, submitted, arXiv:1310.3833
- Revnivtsev et al. (2005) Revnivtsev, M., Gilfanov, M., Jahoda, K., Sunyaev, R. 2005, A&A, 444, 381
- Risaliti et al. (2002) Risaliti, G., Elvis, M., Gilli, R. 2002, ApJ, 566, L67
- Sani et al. (2011) Sani, E., Marconi, A., Hunt, L.K., Risaliti, G. 2011, MNRAS, 413, 1479
- Shakura & Sunyaev (1973) Shakura, N.I., Sunyaev, R.A. 1973, A&A, 24, 337
- Shankar et al. (2004) Shankar, F., Salucci, P., Granato, G.L., et al. 2004, MNRAS, 354, 1020
- Shi et al. (2013) Shi, Y., Helou, G., Armus, L., et al. 2013, ApJ, 764, 28
- Soltan (1982) Soltan, A. 1982, MNRAS, 200, 115
- Stierwalt et al. (2013) Stierwalt, S., Armus, L., Surace, J.A., et al. 2013, ApJS, 206, 1
- Turler et al. (2010) Turler, M., Chernyakova, M., Courvoisier, T.J.L., et al. 2010, A&A, 512, A49
- Ueda et al. (2003) Ueda, Y. Akiyama, M., Ohta, K., Miyaji, T. 2003, ApJ, 598,886
- Ueda et al. (2007) Ueda, Y., Eguchi, S., Terashima, Y., et al. 2007, ApJ, 664, L79
- Ueda et al. (2014) Ueda, Y., Akiyama, M., Hasinger, G., et al. 2014, ApJ, 786, 104
- Vecchi et al. (1999) Vecchi, A., Molendi, S., Guainazzi, M., et al. 1999, A&A, 349, L73
- Vignali et al. (2003) Vignali, C., Brandt, W.N., Schneider, D.P. 2003, AJ, 125, 433
- Vika et al. (2009) Vika, M., Driver, S.P., Graham, A.W., Liske, J. 2009, MNRAS, 400, 1451
- Watanabe et al. (1997) Watanabe, K., et al. 1997, in The Fourth CGRO Symposium, ed. C. D. Dermer, M. S. Strickman, & J. D. Durfess, AIP Conf. Proc., 410, 1223
- Xue et al. (2012) Xue, Y.Q., Wang, S.X., Brandt, W.N., et al. 2012, ApJ, 758, 129